Category: Analytics
This shelf is the job, not a tool manual. You are here if someone expects a number, a chart, or a “what should we do,” and the spreadsheet is starting to argue with itself. The articles cover the question before the query, a metric with a written definition, a chart that answers something, data that is fit to ship, and the messy middle of pipelines and stewardship.
It is not the SQL category. SQL is how you ask a table. Analytics is what you are trying to decide, and whether the number is even the right one. It is not the AI category either. A model can draft the email about the metric. It does not pick the metric.
Where to start: Analytics foundations if you do not yet have a clear question. Metrics if the team is arguing about a definition. Charts if the picture is pretty and the decision is still fuzzy. The SQL series when you are ready to ask the table yourself. Learn groups these as a track so you do not have to guess an order from a flat list.
What data orchestration does, explained with one simple metaphor
Orchestration is kitchen management for data: schedules, dependencies, and retries. Learn the Airflow and dbt mental models so broken morning numbers point to a clear task, not a…

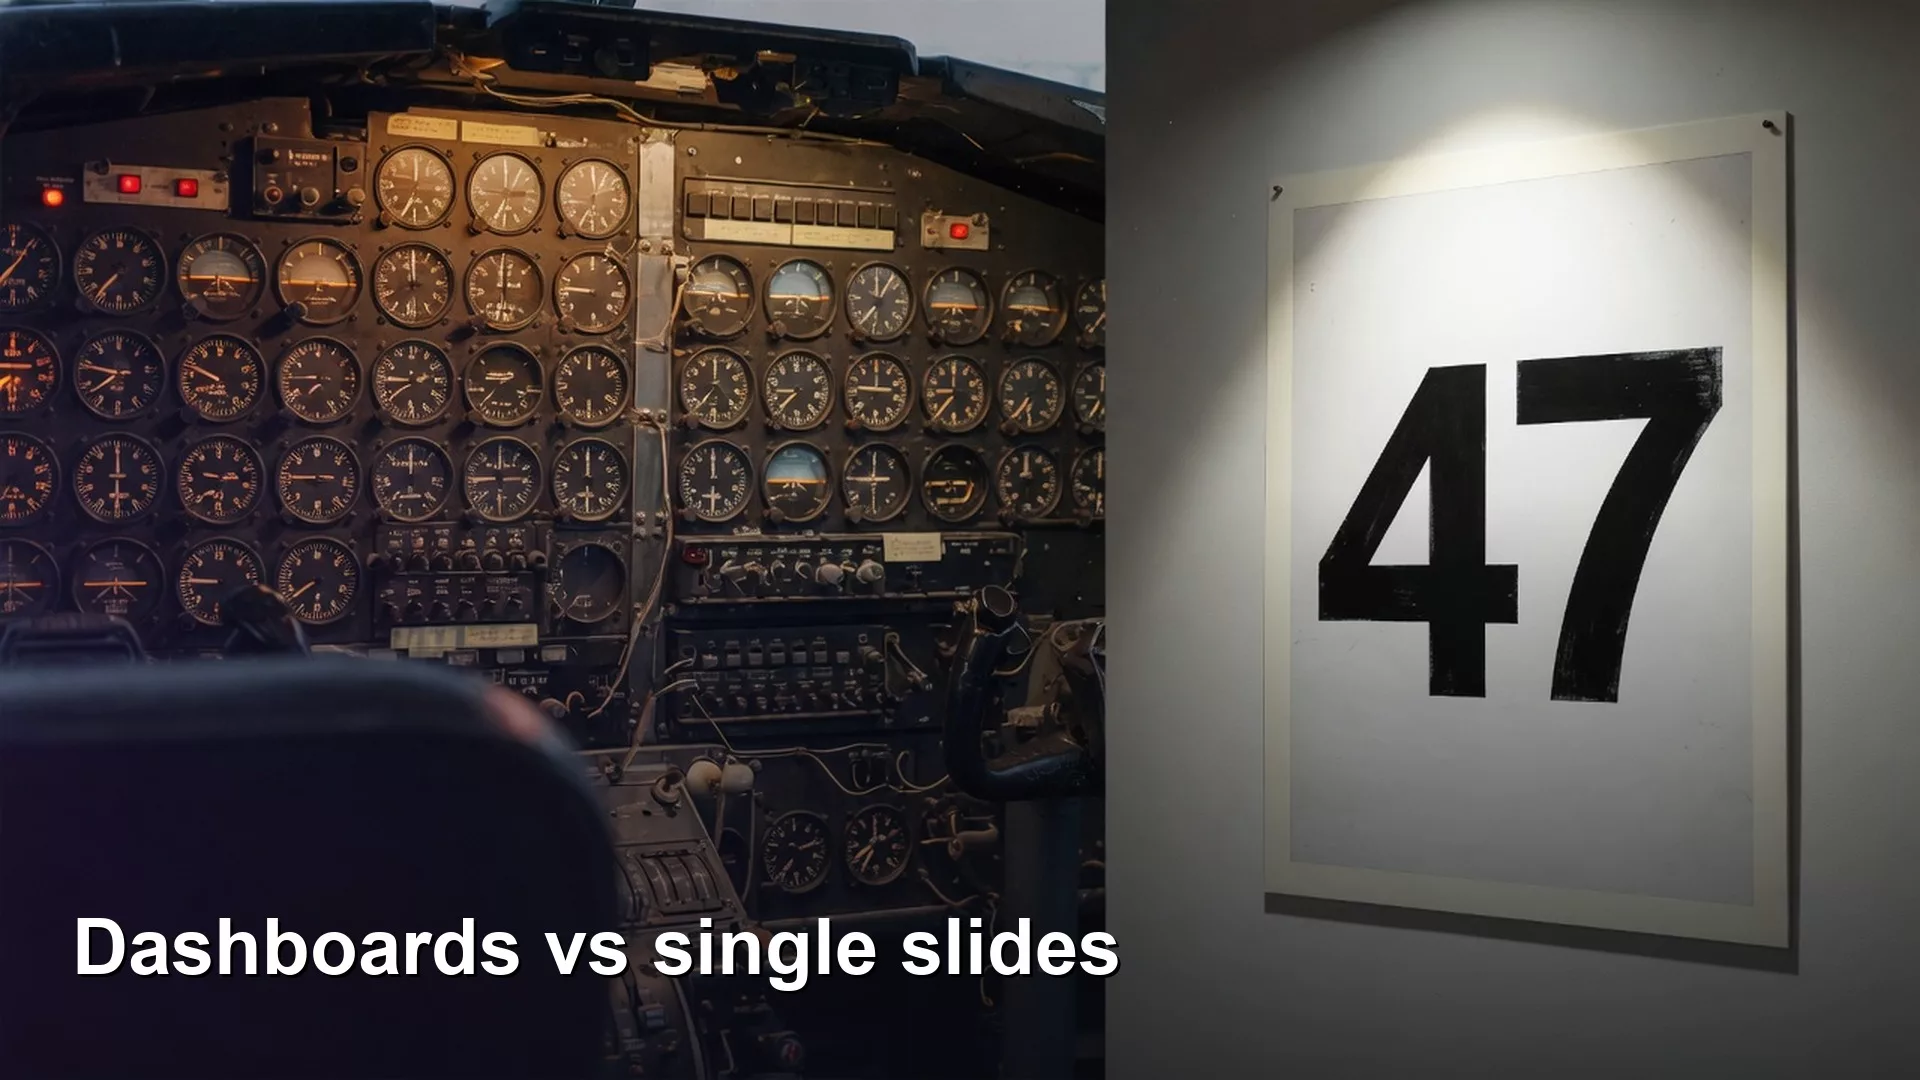
Should you build a dashboard or a single slide for your data?
Dashboards monitor change; single slides carry one decision. Use the one-idea-per-view rule and a declutter checklist so a busy ops page stops pretending to be a decision document.
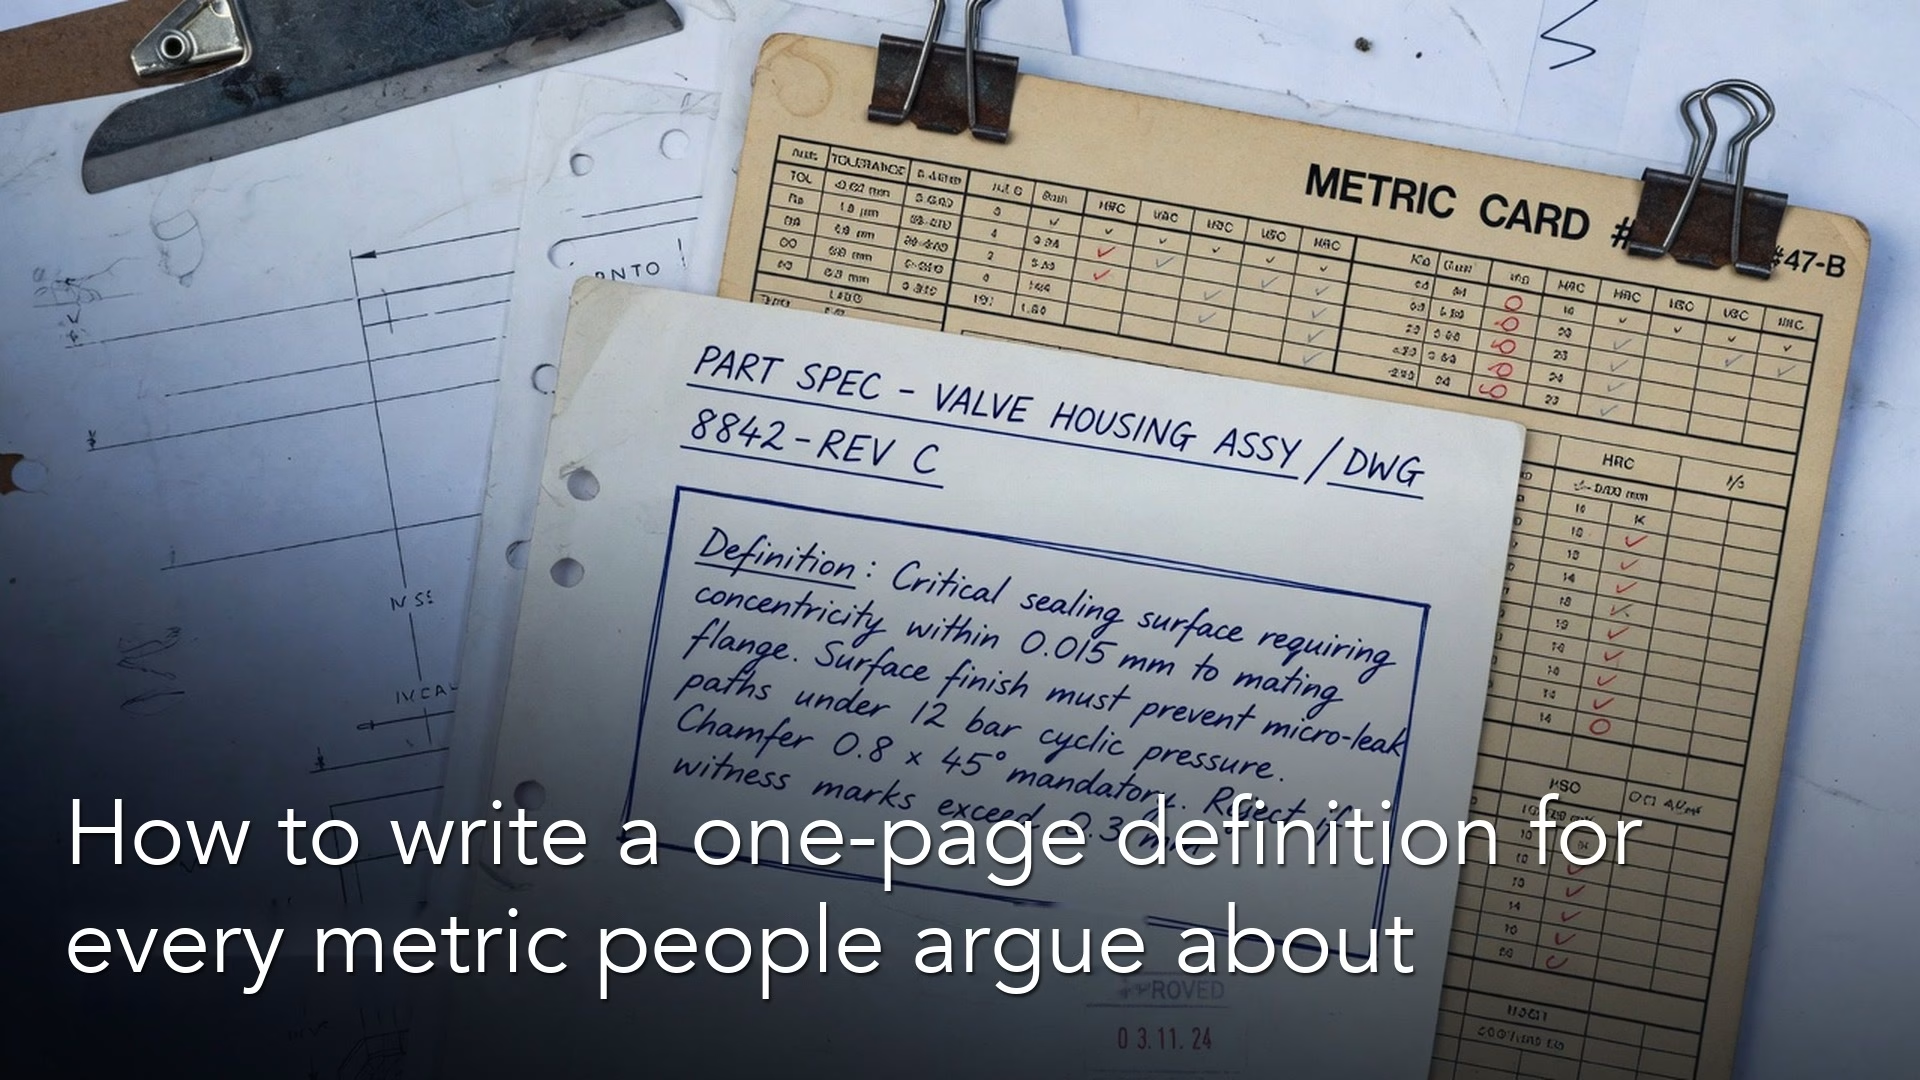
How to write a one-page definition for every business metric people argue about
Write a one-page metric spec with owner, grain, formula, filters, and caveats. Definitions beat dashboard debates when two people rebuild the same number.
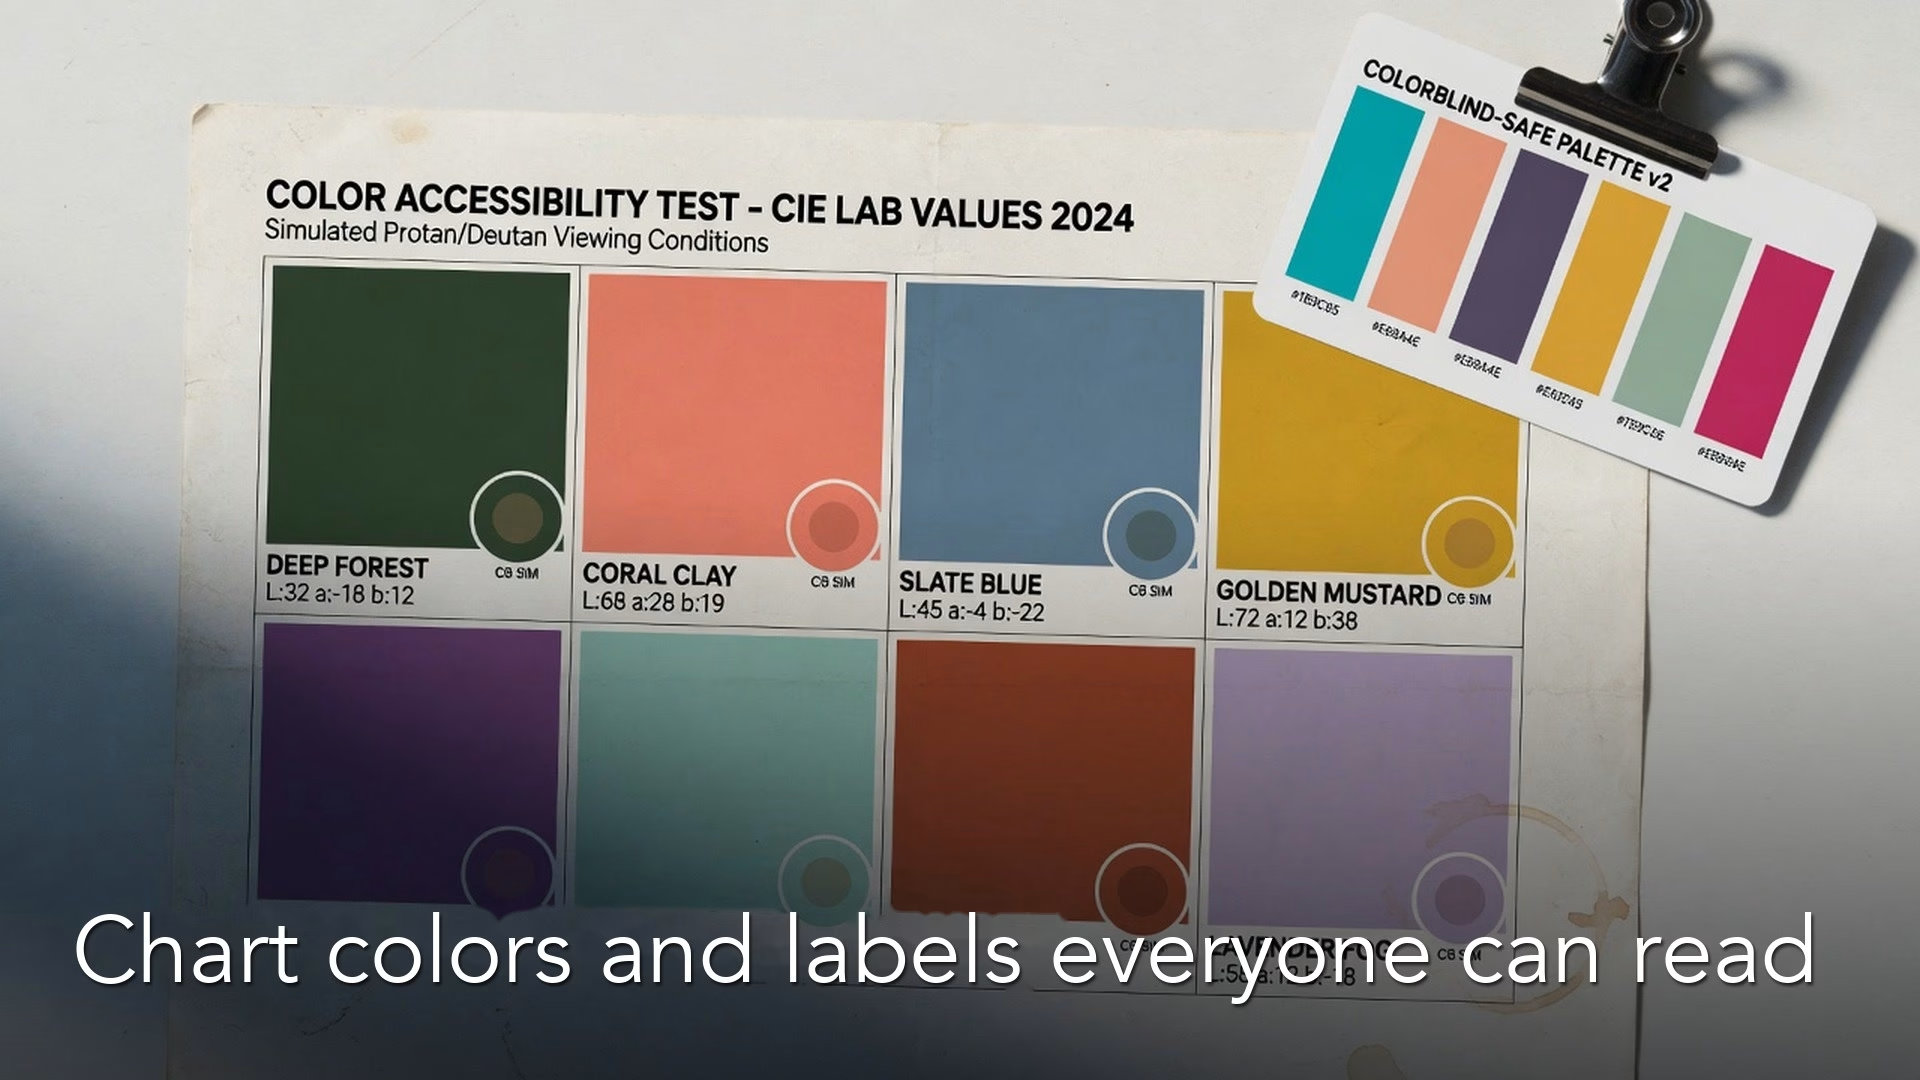
How to choose chart colors and labels that everyone can read
Color and labels are accessibility decisions, not brand sprinkles. Build colorblind-safe charts with strong labels that still work in grayscale, on printouts, and on a phone at 7…
Leading vs lagging indicators: which business metrics warn you early
Use lagging indicators for outcomes and leading indicators for early warning. Put both on the review so a green result tile cannot hide a thin pipeline.