Category: Analytics
This shelf is the job, not a tool manual. You are here if someone expects a number, a chart, or a “what should we do,” and the spreadsheet is starting to argue with itself. The articles cover the question before the query, a metric with a written definition, a chart that answers something, data that is fit to ship, and the messy middle of pipelines and stewardship.
It is not the SQL category. SQL is how you ask a table. Analytics is what you are trying to decide, and whether the number is even the right one. It is not the AI category either. A model can draft the email about the metric. It does not pick the metric.
Where to start: Analytics foundations if you do not yet have a clear question. Metrics if the team is arguing about a definition. Charts if the picture is pretty and the decision is still fuzzy. The SQL series when you are ready to ask the table yourself. Learn groups these as a track so you do not have to guess an order from a flat list.
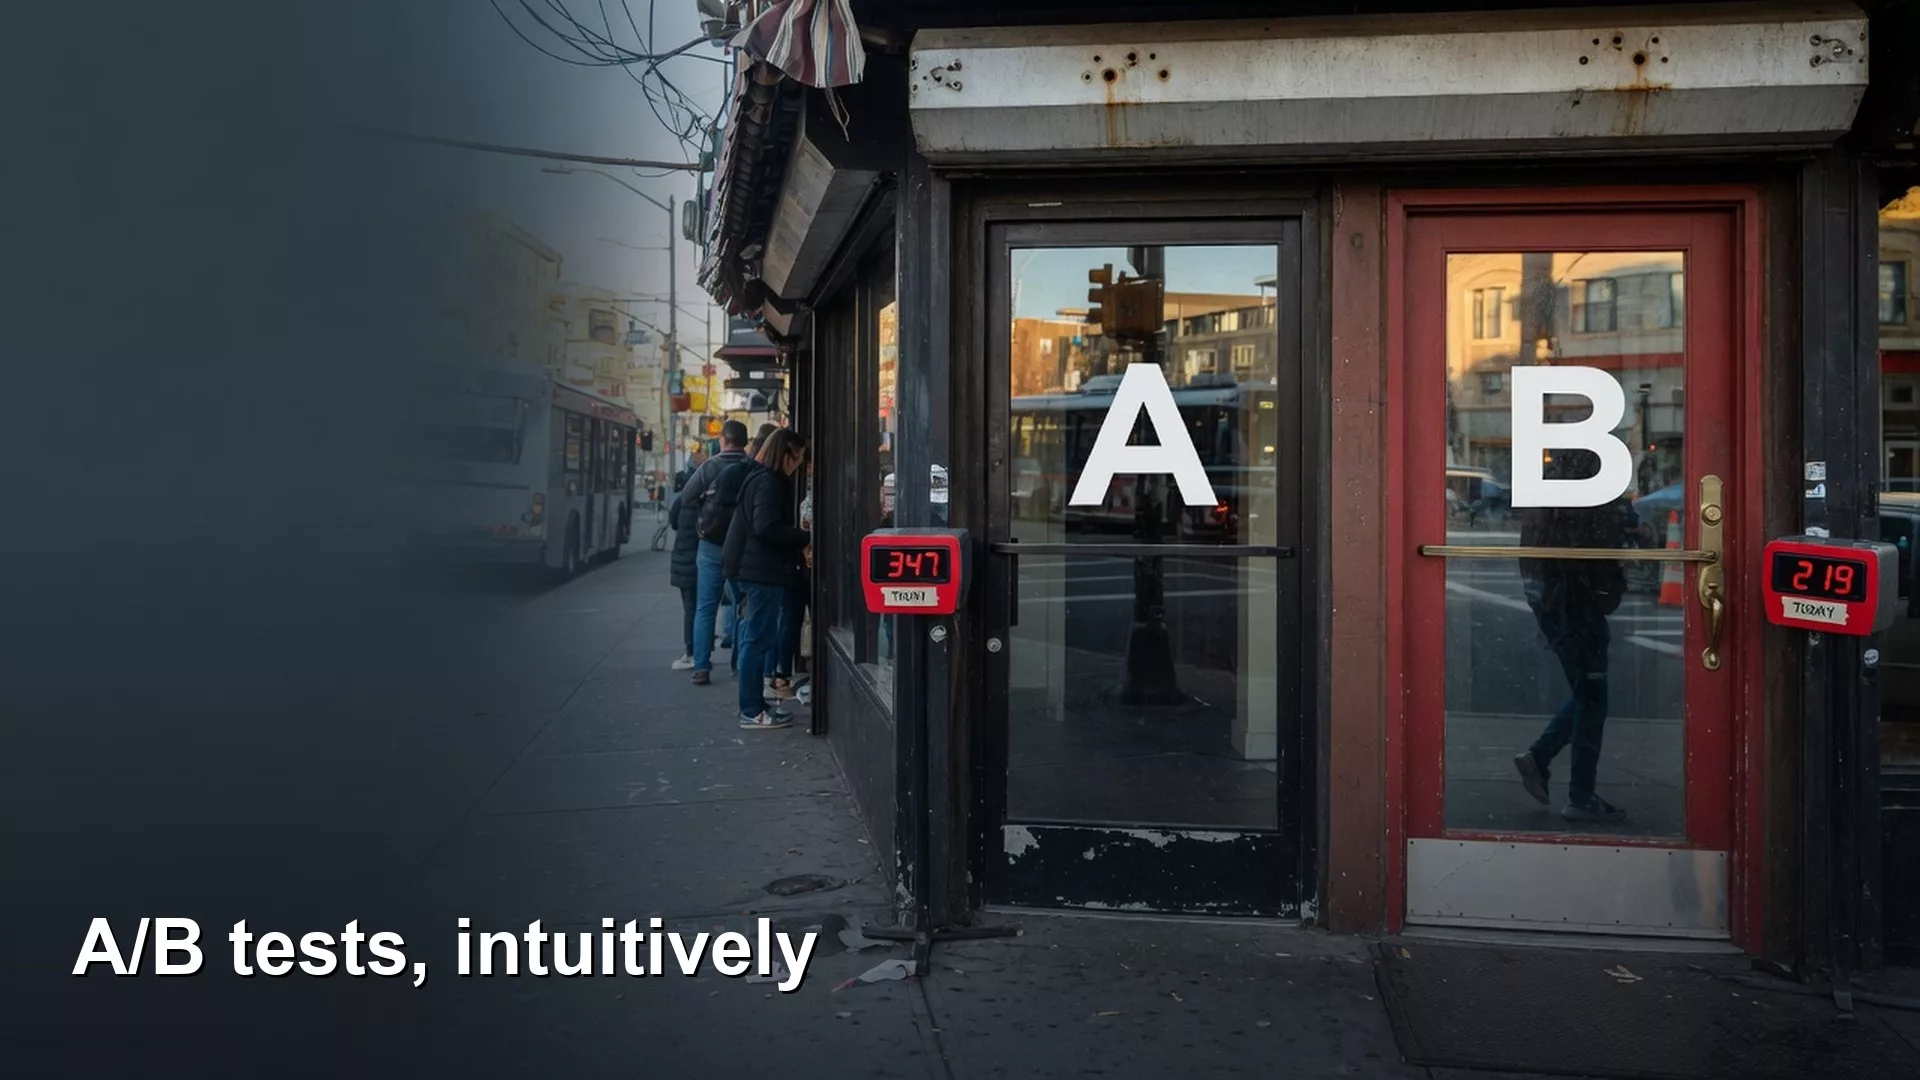
A/B tests intuition for analysts
A/B tests need a clear unit, a primary metric, and honest peeking rules. A green checkmark with +3.2% lift can still be calendar-driven science if you stop early.
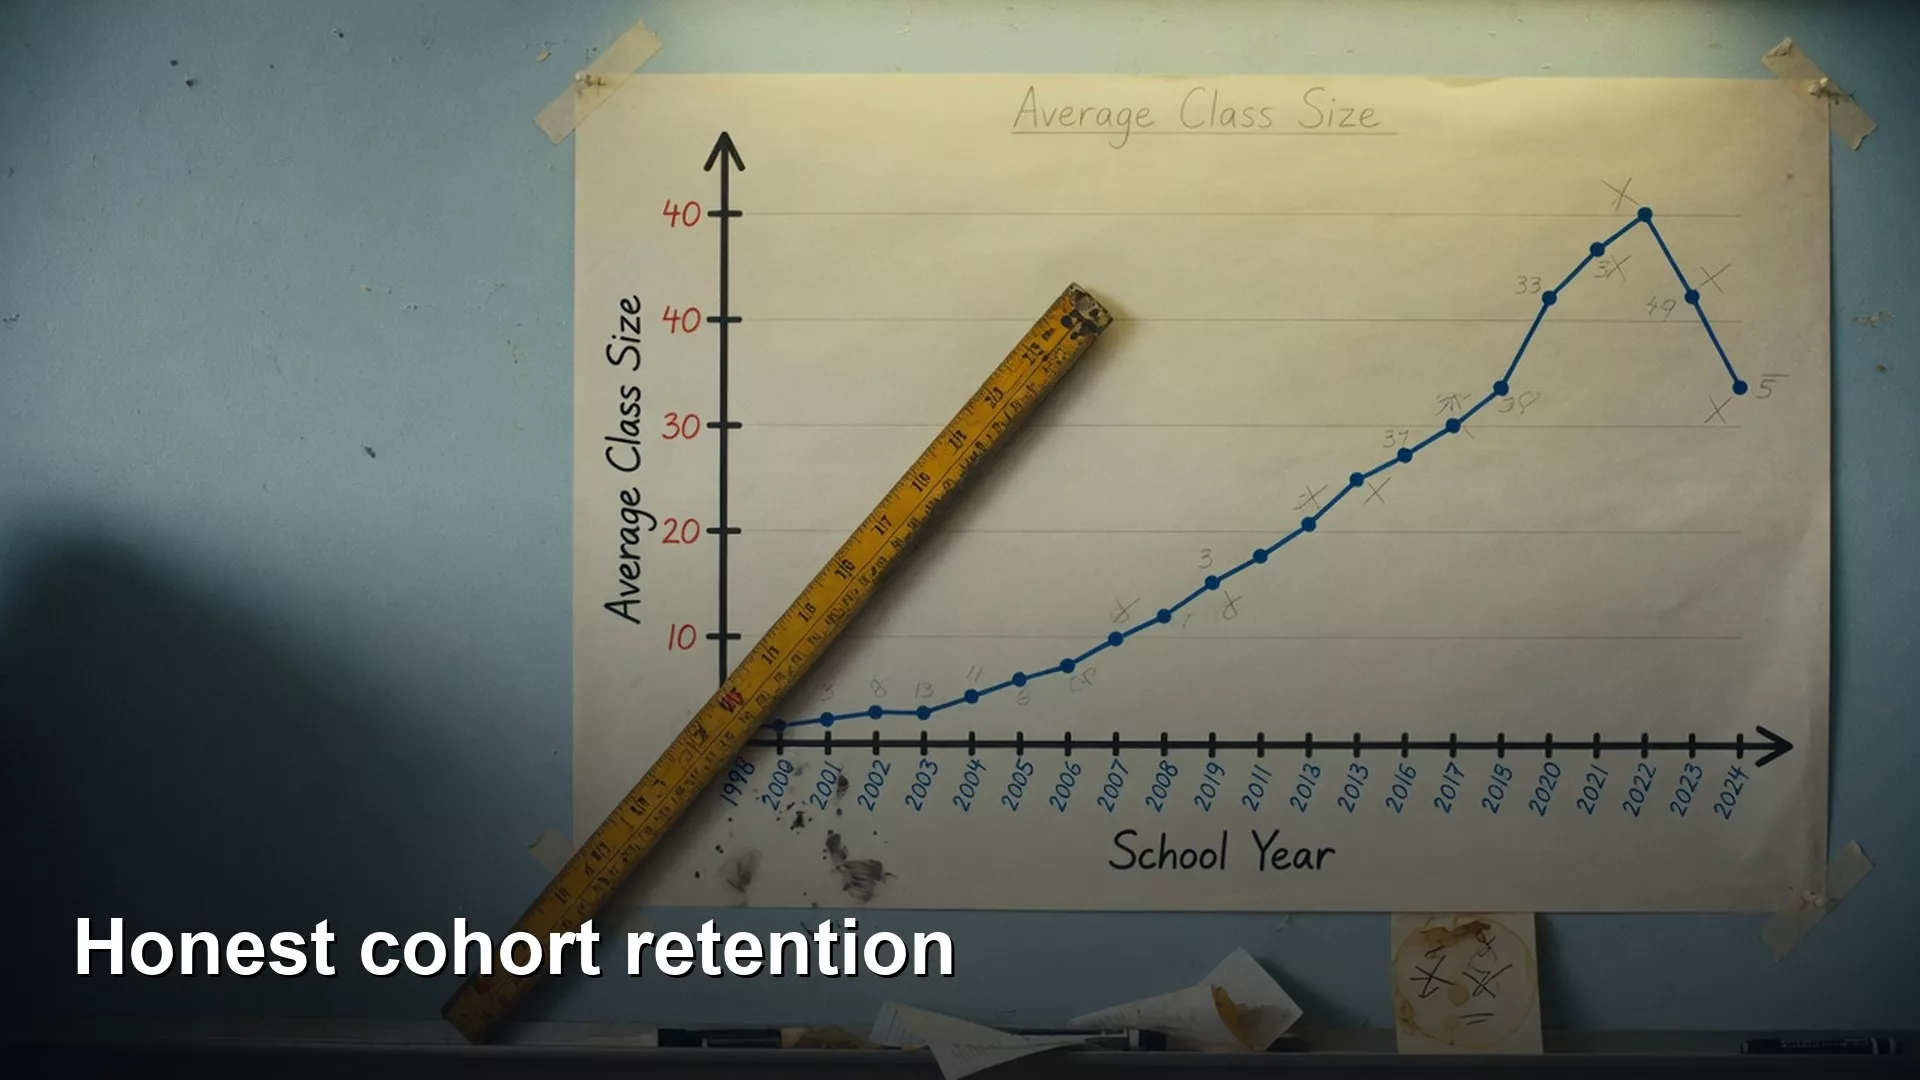
How to build cohort retention charts that don’t mislead
Cohort retention charts need honest periods and clear incomplete cells. Build the table first, then the heatmap, so calendar scars and survivor tricks do not hide.
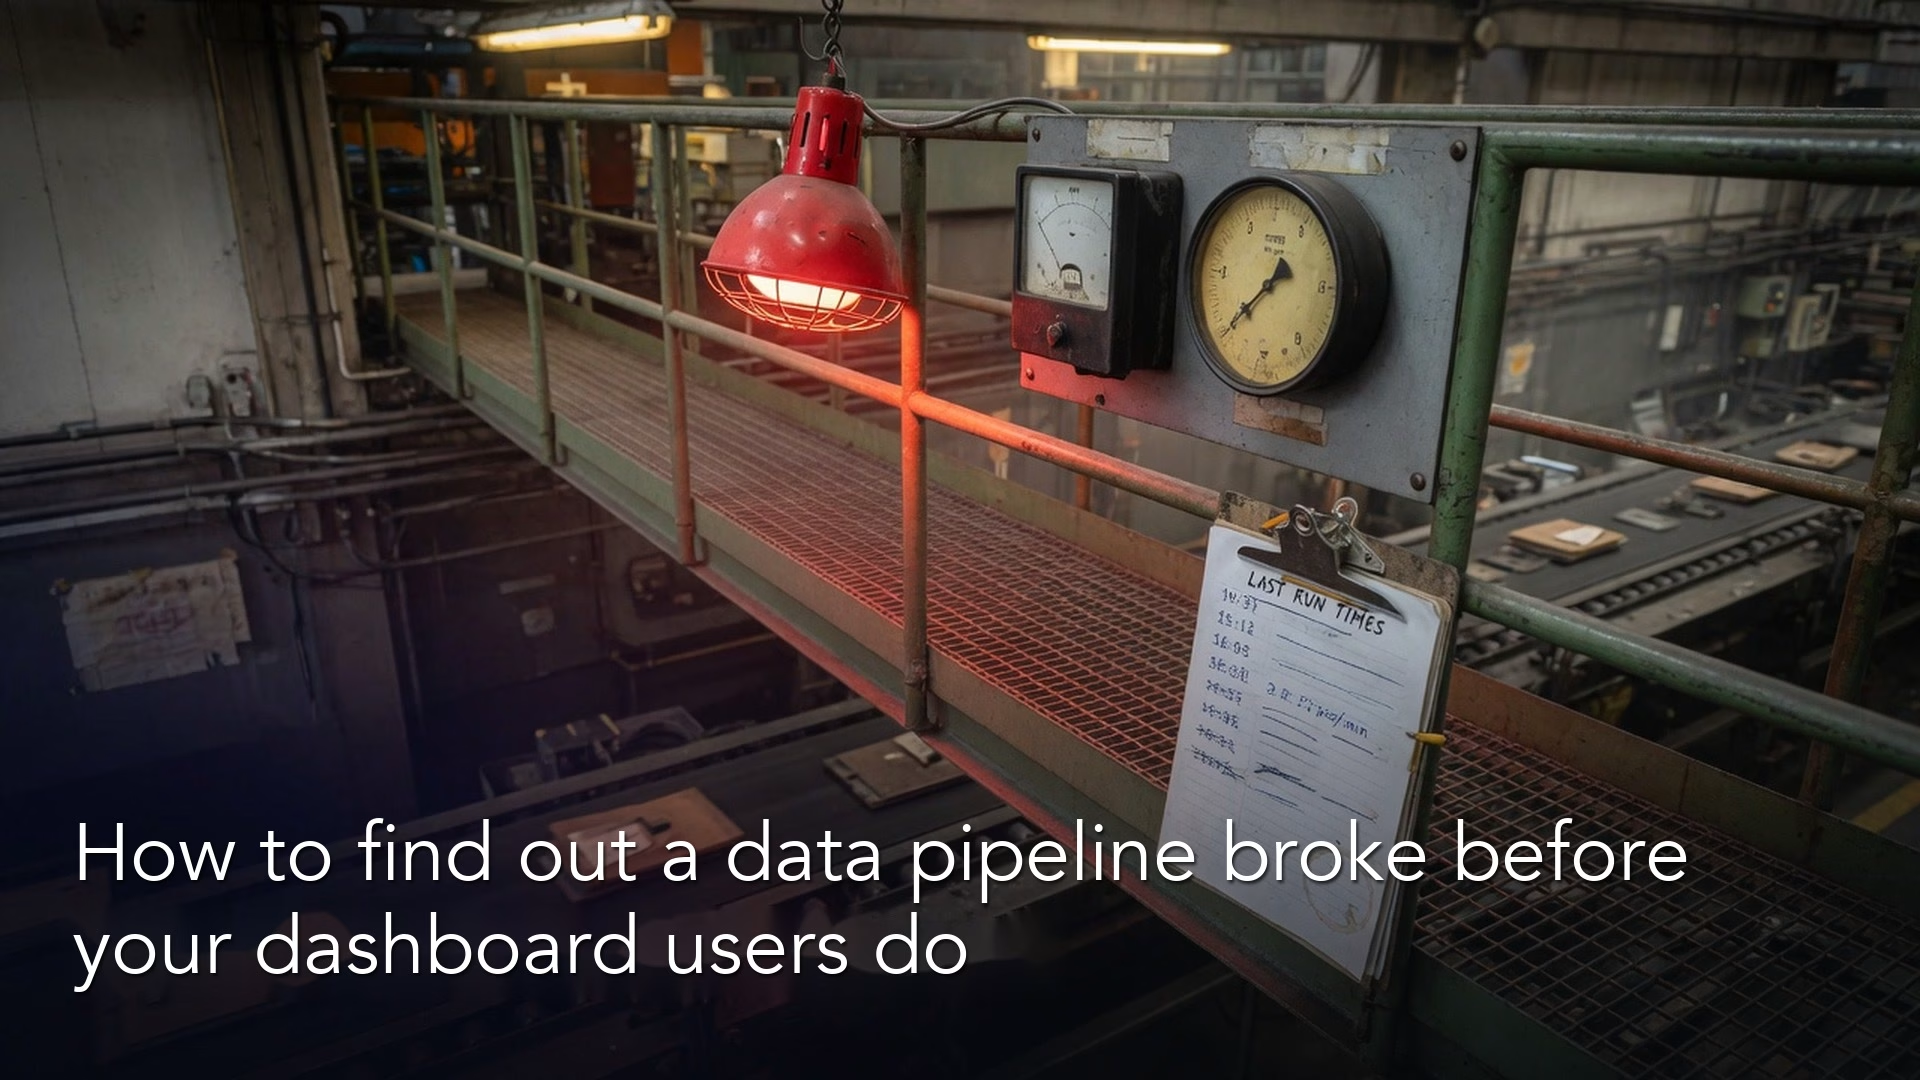
How to find out a data pipeline broke before your dashboard users do
Pipeline observability means early signals: freshness, volume, schema, and a business check. Red, yellow, green without theater, plus a human who gets paged.
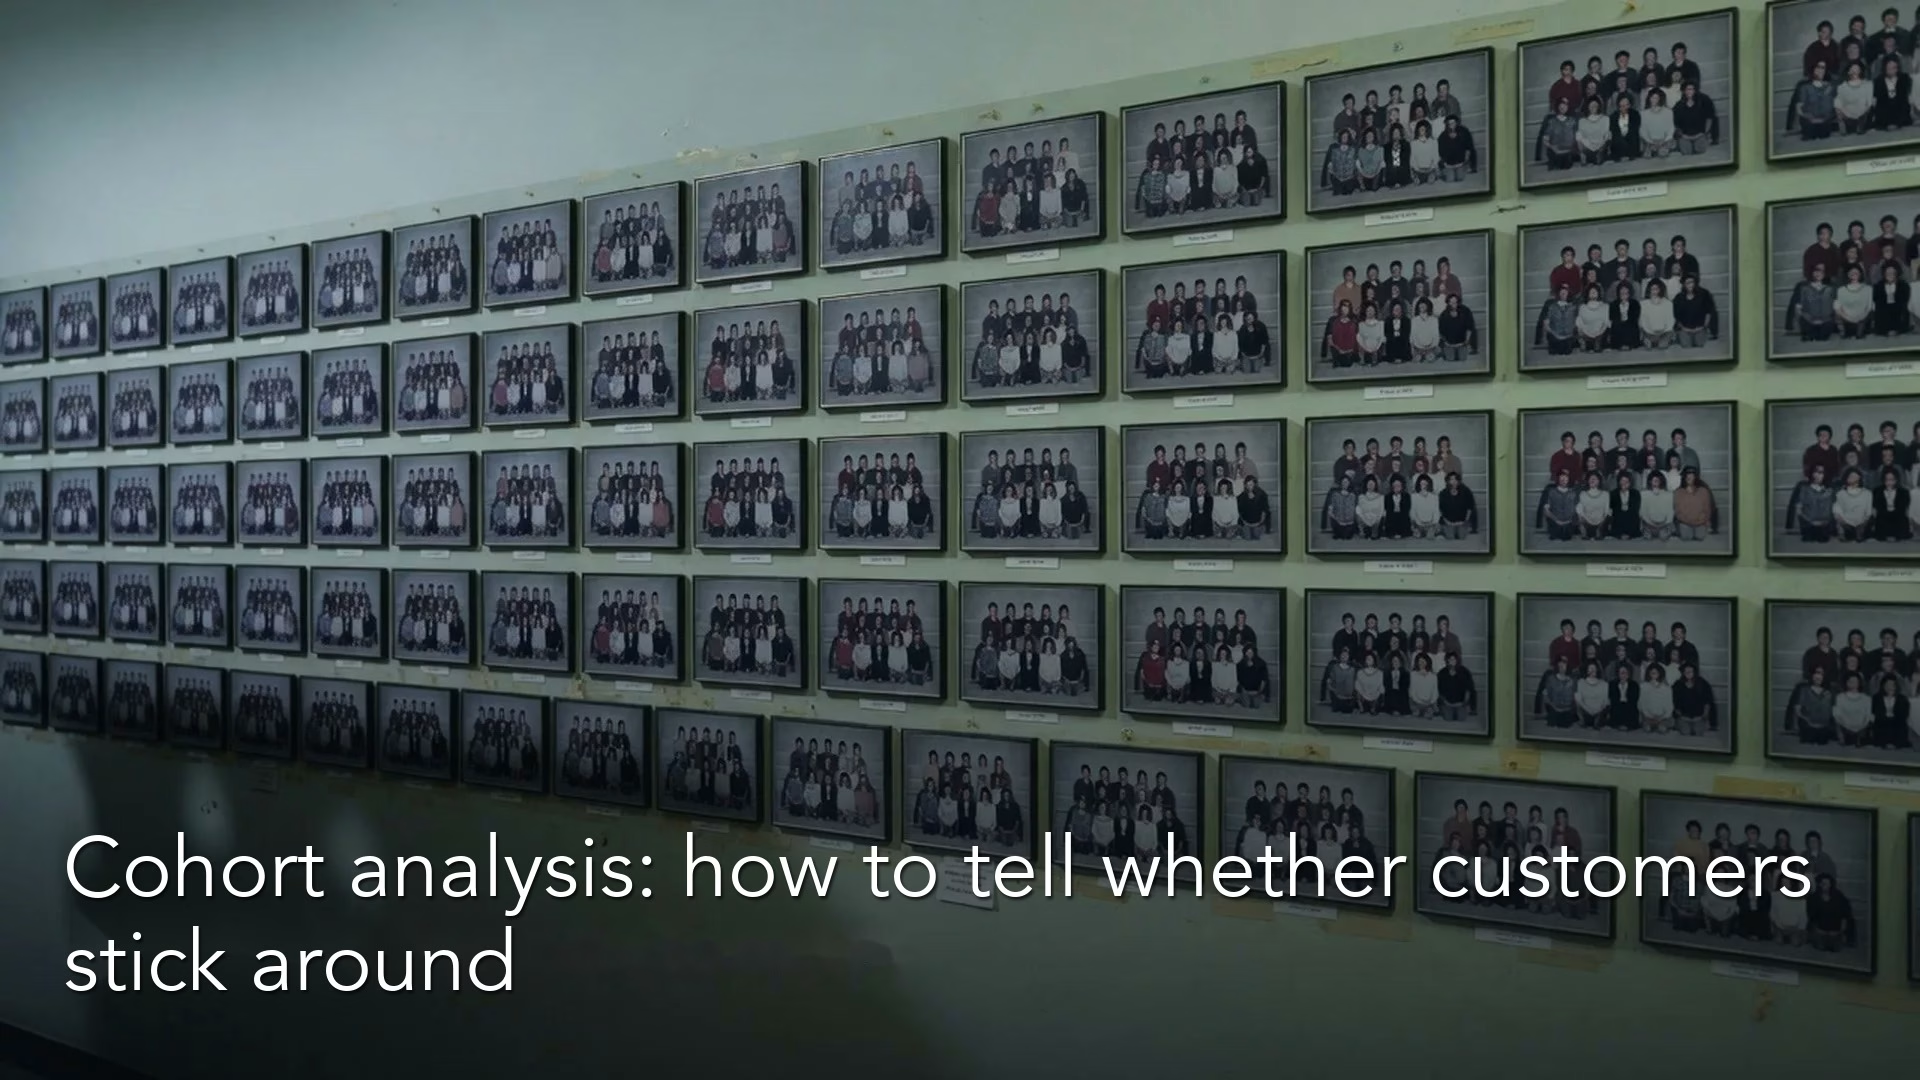
Cohort analysis: how to tell whether customers stick around
Cohorts group users by a shared start and measure them on the same clock. Define active clearly, prefer acquisition cohorts for retention grids, and label behavioral cohorts as…
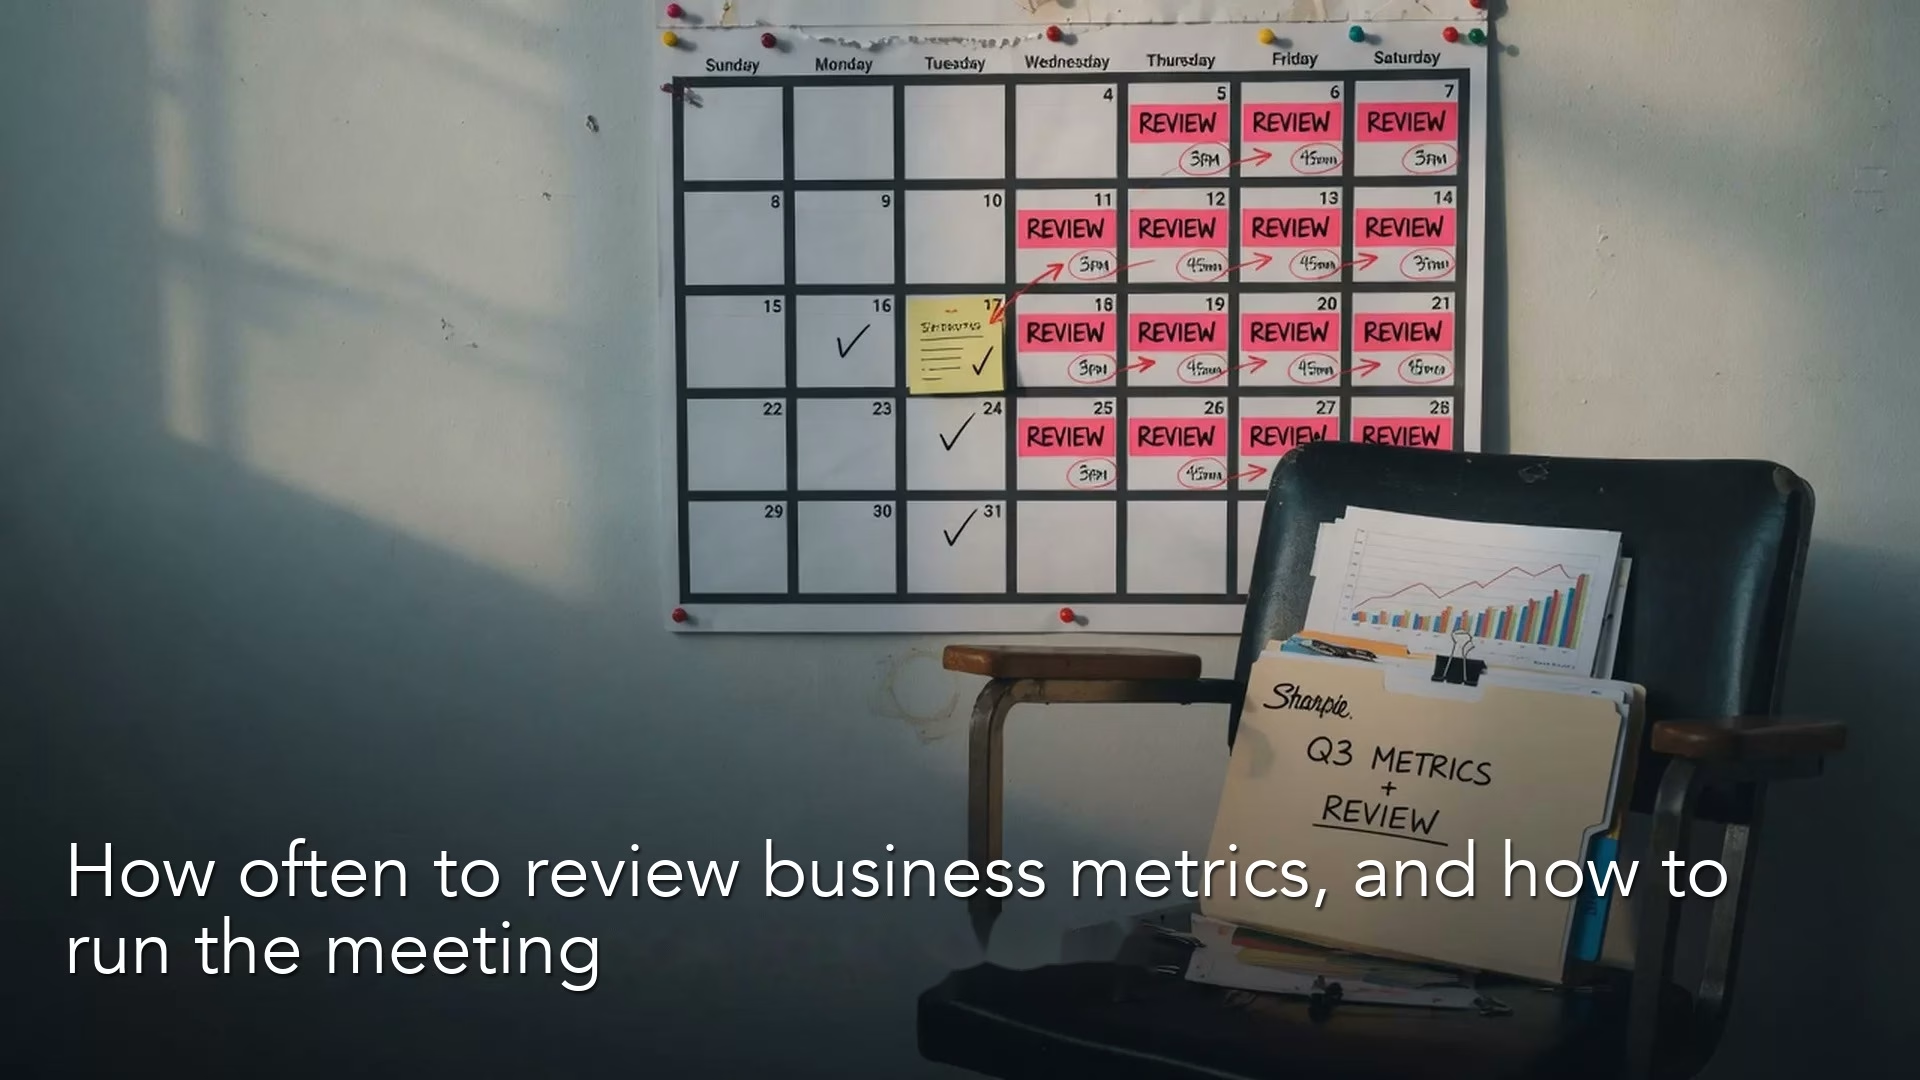
How to run a business metrics review meeting, and how often to hold it
Run a metrics cadence that decides: weekly for levers, monthly for outcomes. Bring roles, a pre-read, and a decision log so the hour is not theater.