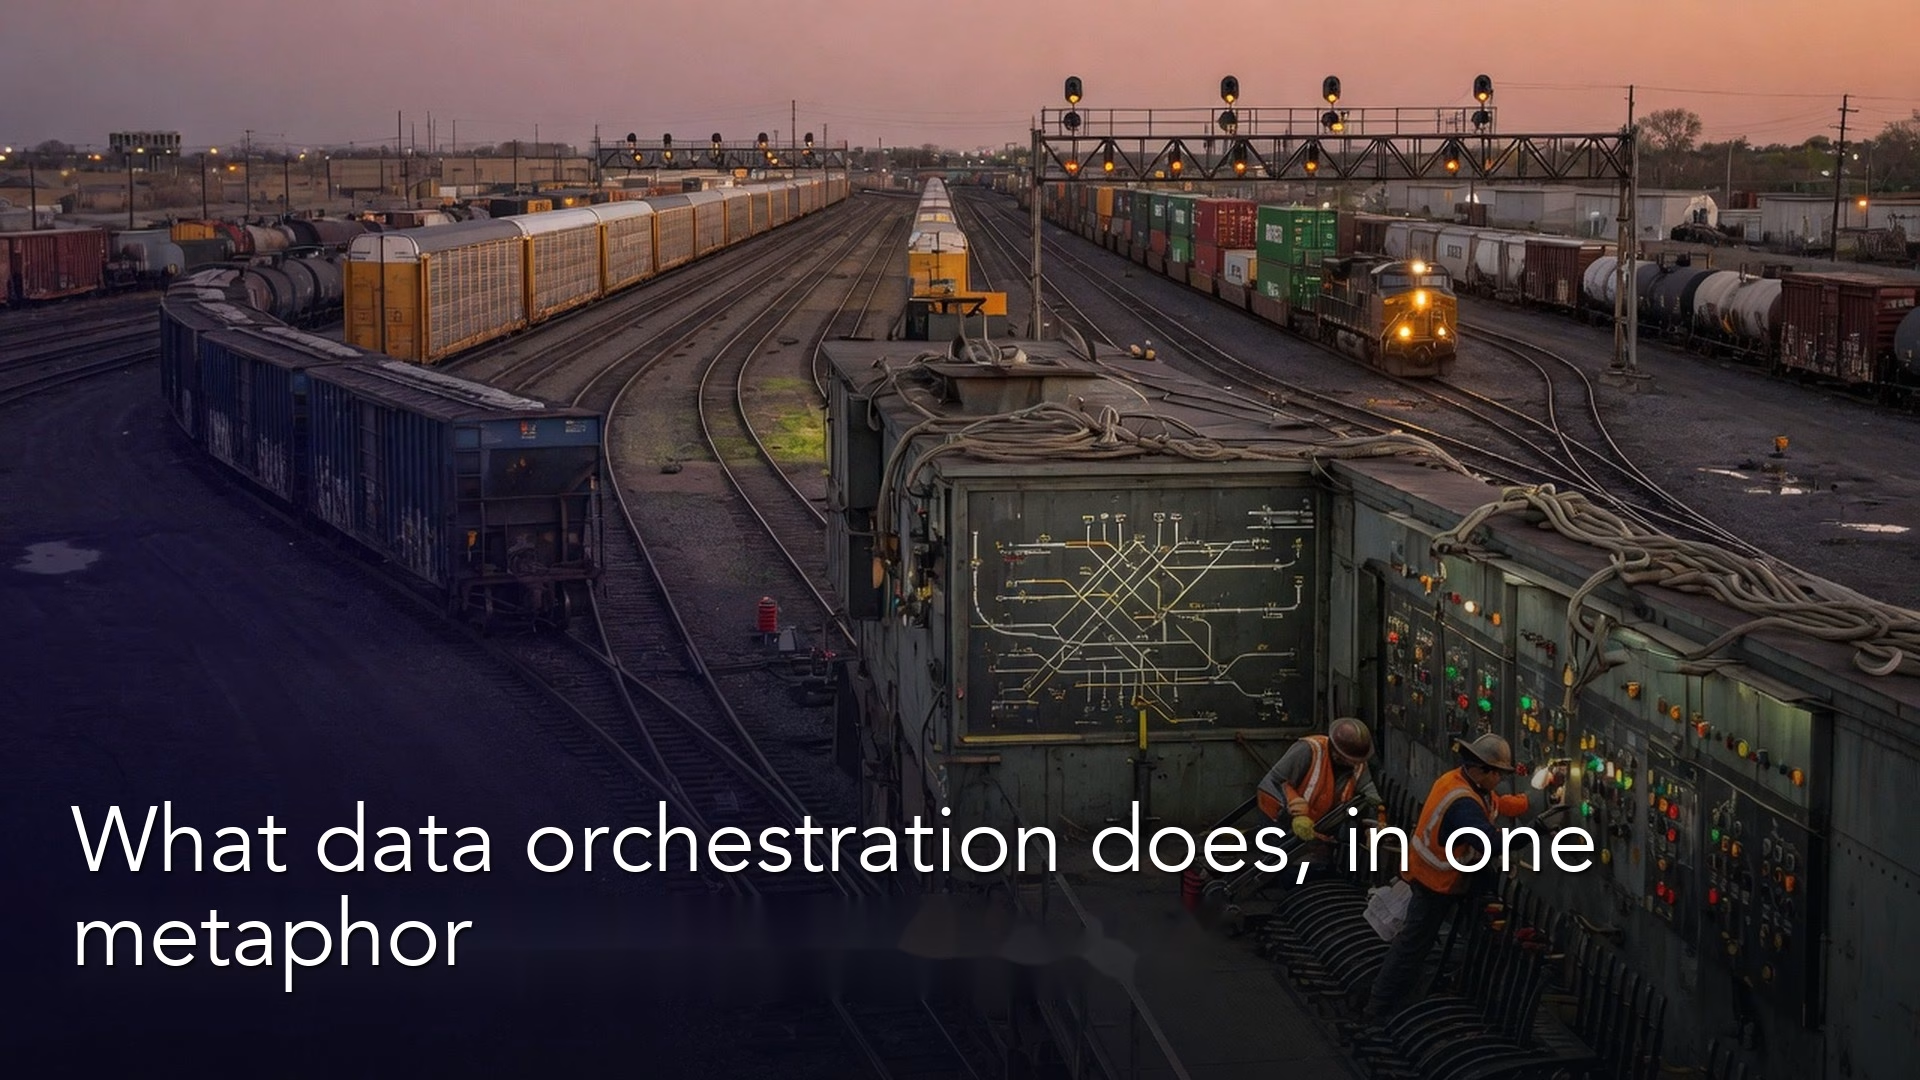
Orchestration makes your data steps run on time, in the right order, and try again when something breaks, so the numbers are ready before anyone opens a report. It comes down to three things: schedules, dependencies (which step waits for which), and retries. Think of a restaurant kitchen, where someone has to open on time, cook the steps in order, redo the burnt tray, and tell the dining room when brunch is late.
Say you open your dashboard one morning and the numbers are wrong because a step that cleans data ran before the step that loads it had finished. Slack fills with “is the warehouse down?” The real answer is that a dependency was missing (nothing told the second step to wait for the first), not that some mysterious outage happened. The kitchen opened before the delivery truck arrived.
Orchestration is not the recipe, which is your SQL (the language used to ask databases for data), and it is not the pantry, which is your warehouse. It is the schedule, the order of steps, and the redo rules that keep breakfast from turning into a mystery meat buffet.
The kitchen metaphor (kept boring on purpose)
It helps to map the ideas once, side by side, and then stop thinking about kitchens.
| Kitchen | Data platform | Why it matters |
|---|---|---|
| Menu / recipes | SQL models, Python jobs, extracts | What work means |
| Pantry | Lake, warehouse, app sources | Where ingredients live |
| Ticket rail / expo | Orchestrator | Order, timing, redo, alerts |
| Dining room | Dashboards, exports, apps | Who eats the result |
| Health inspection | Tests, freshness checks | Refuse to serve bad food |
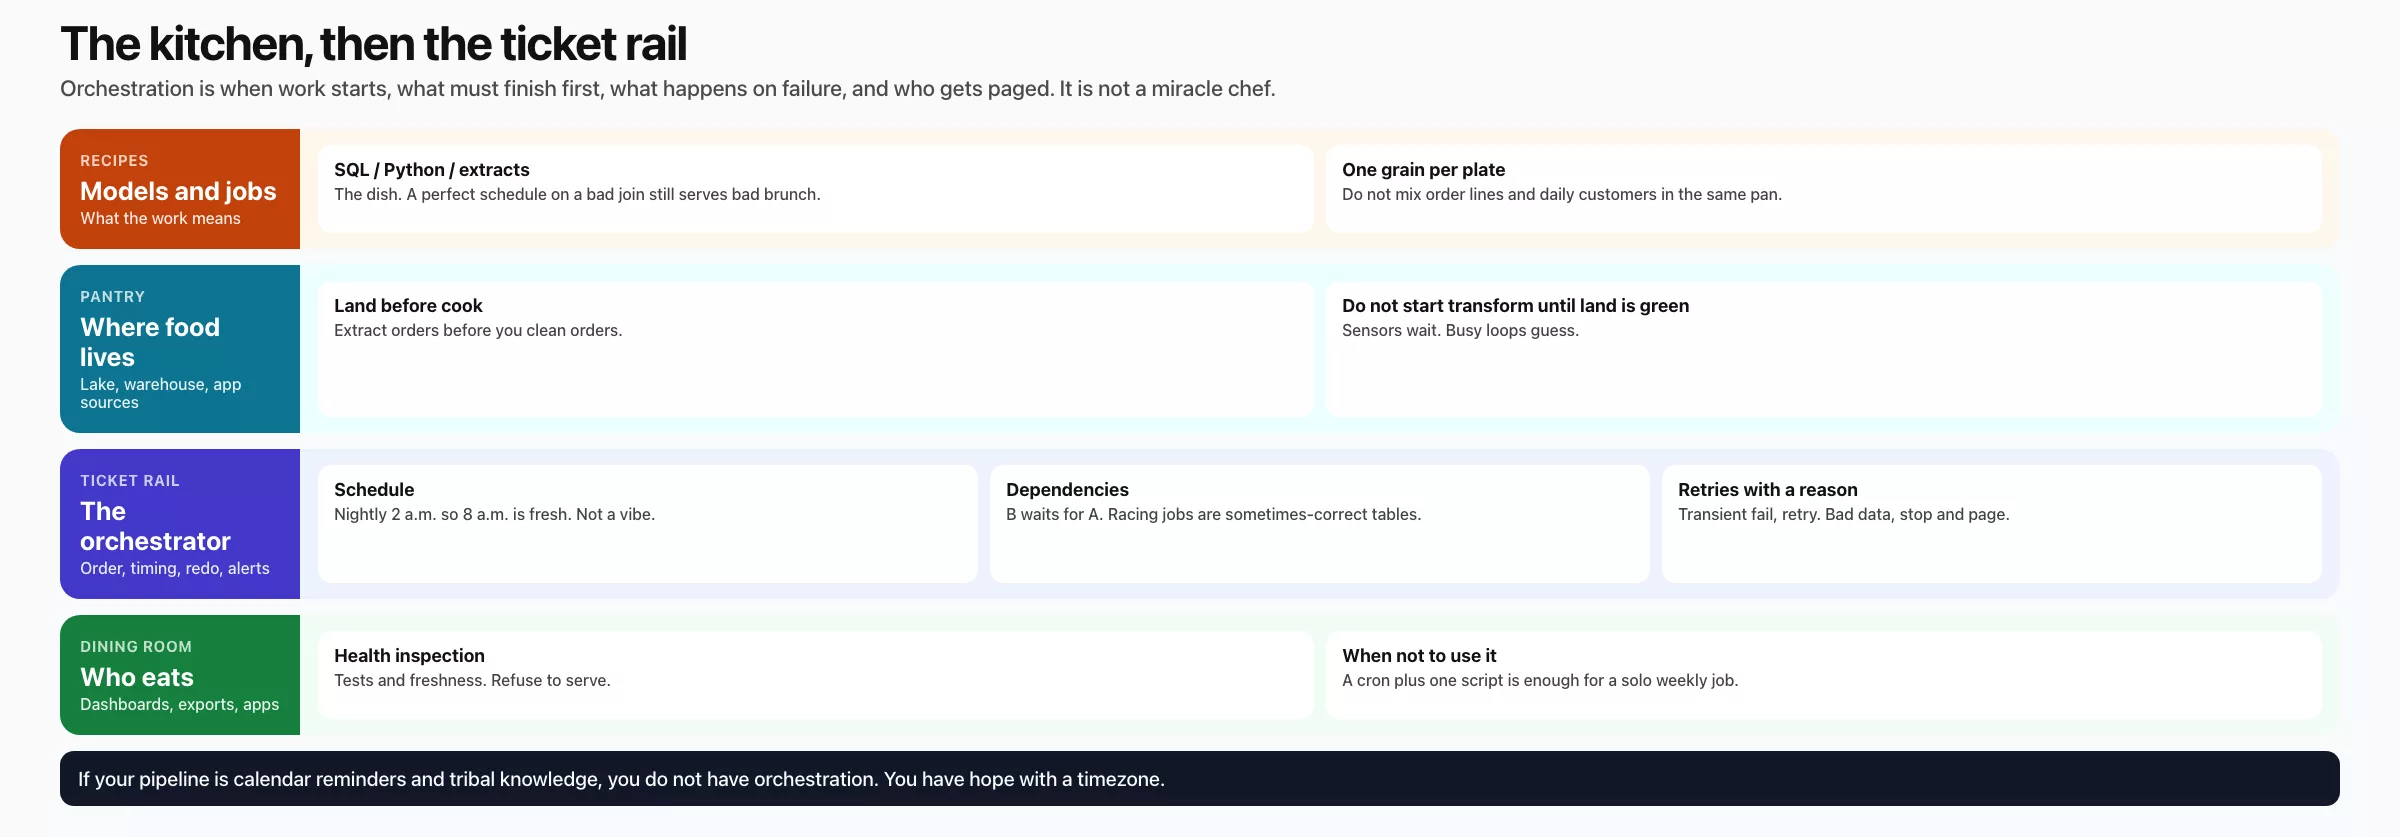
Orchestration answers four questions: when the work starts, what must finish first, what happens on failure, and who gets paged (called on their phone) when something breaks. It does not replace good models, because a perfect schedule running bad joins (steps that combine tables the wrong way) still serves bad brunch.
Rule of thumb: If your “pipeline”, meaning your chain of data steps, is a chain of calendar reminders and tribal knowledge, you do not have orchestration. You have hope with a time zone.
Three ideas that do most of the work
1. Schedules: when the kitchen opens
A schedule says when the work should start, such as nightly at 2 a.m., hourly, every Monday, or when a file lands. Schedules create expectations for everyone downstream. “The dashboard is fresh by 8 a.m.” is really a schedule plus a promised deadline (often called a service level agreement, or SLA), not a personality trait of the warehouse.
Here is a tip for analysts: learn the schedule behind any number you publish. If leadership looks at 9 a.m. and the job finishes at 9:30 on good days, you do not have a metrics problem. You have a kitchen open-time problem.
2. Dependencies: do not plate before the sauce is done
A dependency says that task B cannot start until task A succeeds. You extract orders before you clean orders, you clean orders before you build the revenue table, and you build the revenue table before you refresh the business intelligence (BI) dashboard. Without dependencies, jobs race each other. Racing jobs create tables that are “sometimes correct,” which is the worst kind, because they pass a quick screenshot check and fail an audit.
Dependencies come in three shapes.
- Task dependencies live inside one orchestrated flowchart, where A runs, then B, then C.
- Dataset dependencies mean waiting until a table slice for yesterday exists.
- Cross-system dependencies mean waiting for an export from another software service, and then loading it.
When a number is wrong “only on Mondays,” ask what is different about Monday. The cause might be a late upstream file, a job that ran longer than usual, overlapping jobs, or a weekly task that was never connected into the flowchart.
3. Retries: the burnt tray policy
Retries say what to do when a step fails, and the options are to try again, wait, alert someone, or stop everything downstream. Not every failure should retry forever. A bad password should not retry 50 times, while a flaky network blip might retry three times with a growing pause between tries. A failed data test should often block serving instead of pushing known-bad numbers to the dining room.
A tip for analysts is to tell infrastructure failures, such as timeouts and permission errors, apart from data failures, such as a spike of blank values or duplicate keys. Retries fix many of the first kind. The second kind needs a human to decide on a definition or a fix at the source.
Airflow-shaped thinking (an example, not an install lab)
Apache Airflow popularized a mental model that many teams still use even on other tools, which is the directed acyclic graph (DAG). In plain language, a DAG is a flowchart of tasks that never loops back on itself, with a schedule and clear arrows showing which tasks come before and after.
Here are the core terms you will hear.
- DAG: the whole kitchen plan for one pipeline.
- Task: one step, such as extract, run a group of models, check quality, or send a notification.
- Operator or sensor: how a step runs or waits, which is an implementation detail you can mostly ignore.
- Run: one execution for a logical date, which is the day the data belongs to, like yesterday’s brunch service.
- SLA, timeout, and retry policy: how late is too late, and how many redos are allowed.
You do not need to write Python DAGs to benefit from all this. You need to read the graph when something breaks, so you can see which task failed, what was blocked downstream, and which date is incomplete. That is how you write a ticket that says “extract_billing failed for 2026-03-12, marts not refreshed” instead of “dashboard broken.”
dbt-shaped thinking (transforms inside the pantry)
dbt is not mainly an orchestrator for the whole company. It is a framework for transforming data, built around SQL models, tests, documentation, and a dependency graph among the models. Many teams still schedule dbt with Airflow, with cron (the old built-in Unix timer), with a cloud scheduler, or with a vendor’s job runner. That split is healthy, and it looks like this.
- dbt (or a similar tool): decides what SQL runs, in what model order, and with which tests.
- The orchestrator: decides when dbt runs relative to extracts, to sending data back into business apps (called reverse ETL: ETL means extract, transform, load, the usual copy into the warehouse, and this is the opposite), and to dashboard caches.
dbt’s model graph is still close to orchestration. Its ref() links mean “build customers before orders_enriched,” its tests mean “do not silently ship duplicates,” and its docs mean “the dining room can read the menu.” A later post in this series goes deeper on dbt in concept. For now, remember that transform graphs and platform schedules are partners.
Worked example: the 2 a.m. revenue service
Say leadership wants daily net revenue by 8 a.m. local time. Here is the kitchen plan.
| Order | Task | Depends on | Retry idea | On hard fail |
|---|---|---|---|---|
| 1 | Extract billing invoices (land) | Schedule 02:00 | 3x network blips | Page platform; stop line |
| 2 | Extract refunds | Schedule 02:00 | 3x | Page platform; stop line |
| 3 | dbt run staging models | Tasks 1 and 2 success | 1x then alert | Stop marts |
| 4 | dbt test unique invoice_id | Task 3 | No blind retry | Block serve; ticket analytics |
| 5 | dbt run mart.revenue_daily | Task 4 pass | 1x | Stop BI refresh |
| 6 | Refresh BI extract | Task 5 | 2x | Show last-good + banner |
| 7 | Freshness notify #data-ops | Task 6 | n/a | Human acknowledgment |
| job | depends_on | retry |
|---|---|---|
| extract_orders | – | 3 |
| build_stg_orders | extract_orders | 3 |
| build_fct_orders | build_stg_orders | 3 |
| test_and_notify | build_fct_orders | 1 |
Conceptual graph (a simplified sketch, not production config)
# conceptual orchestration sketch
pipeline: daily_revenue
schedule: "0 2 * * *"
timezone: America/New_York
sla_finish_by: "07:30"

tasks:
  - id: extract_invoices
    retries: 3
  - id: extract_refunds
    retries: 3
  - id: dbt_staging
    needs: [extract_invoices, extract_refunds]
  - id: dbt_tests_staging
    needs: [dbt_staging]
    on_fail: block_downstream
  - id: dbt_mart_revenue
    needs: [dbt_tests_staging]
  - id: bi_refresh
    needs: [dbt_mart_revenue]
  - id: notify_fresh
    needs: [bi_refresh]
Here is what a successful run looks like as a status table that an analyst can understand.
| Task | Logical date | Status | Finished |
|---|---|---|---|
| extract_invoices | 2026-03-12 | success | 02:18 |
| extract_refunds | 2026-03-12 | success | 02:21 |
| dbt_staging | 2026-03-12 | success | 02:40 |
| dbt_tests_staging | 2026-03-12 | success | 02:44 |
| dbt_mart_revenue | 2026-03-12 | success | 03:05 |
| bi_refresh | 2026-03-12 | success | 03:12 |
| notify_fresh | 2026-03-12 | success | 03:13 |
Now imagine the failure story. The task dbt_tests_staging fails its uniqueness check on invoice_id, so everything downstream stays blocked. The dashboard still shows March 11 with a stale banner, if you built that honesty in. Leadership sees an old number with a warning instead of a quietly wrong new number. That is orchestration and quality working together, in the same spirit as the data quality series.
What analysts should do when the kitchen is on fire
You are not always the on-call engineer, but you still need a response pattern.
- Name the impact on the people using the number. For example, “the revenue tile is stale for board prep at 8:30.”
- Find the first failed task or the last successful logical date.
- Classify the problem as an empty extract, a transform error, a test failure, or a dashboard refresh problem only.
- Route it to the owner of that stage, using the ownership card from the earlier post on how data moves.
- Tell stakeholders the time of the last good data in one sentence.
- Do not “fix” a number in the dashboard tool unless you are deliberately running a temporary manual process with an end date.
This is also where metrics discipline helps. If the definition is fuzzy, every outage turns into a debate about what the number should have been. Keep your definitions tight, as the metrics series explains, so that outages stay a question of operations.
Waiting done right: sensors without busy loops
Sometimes a task should not start on the clock alone. It should start when a file arrives, when an upstream table slice is ready, or when an export from another service finishes. Orchestrators call these waits sensors or external triggers. The kitchen metaphor still works here: do not start the omelet until the eggs are delivered, but also do not stand in the walk-in fridge forever without telling the dining room that brunch is delayed.
Good waits have a timeout and an owner. Bad waits check forever, fail silently, or start on pure clock time while the upstream data is empty, which produces successful green jobs with zero rows. Pair waits with freshness checks, so that “ran” is not confused with “useful.”
For analysts, the practical move is to learn whether your number’s upstream is triggered by time or by arrival. Blank Mondays often come from a weekend file that never landed while the schedule still fired.
Idempotency: reheating without double-salting
Here is one more practical orchestration word: idempotent, which means safe to run twice. If a task runs twice for the same logical date, you should not double-count revenue. Designs that keep adding rows and never replace the day’s slice create duplicate brunch plates. Designs that rebuild the slice for that date can retry without shame.
Analysts feel non-idempotent bugs as “the number jumped after a rerun.” When you see that, ask whether the job deletes and reloads the date’s slice, or only inserts new rows. That one question saves days of ghost hunting.
How this sits with SQL, Python, and the rest of the path
Orchestration coordinates work written in many languages. SQL models in the warehouse (see the SQL series), Python utilities for awkward APIs (see the Python series), quality tests, and refreshes of what people see all become tasks on one rail. The terms extract, transform, load (ETL) and extract, load, transform (ELT) describe whether cleanup happens before or after the data lands in storage, and the orchestrator is what makes either pattern repeatable. For broader learning routes, use the Learn hub. Questions about who may rerun production jobs belong with data governance thinking, because least privilege applies to the buttons that rebuild tables and not only to reading data.
Common mistakes
- Cron soup without dependencies. Everything starts at 2:00 and races, so nothing is reliably ready.
- Retrying data test failures forever. Bad data does not become good with patience.
- Alert fatigue. If you page people on every warning, soon nobody answers the real fire.
- Using the orchestrator as a code dumping ground. Business logic belongs in tested models when possible, not only in opaque task scripts.
- No message about the last good data. Stakeholders invent rumors during outages.
- Green success with an empty table. A job can “succeed” at doing nothing useful if nobody checks the row counts.
- One giant task. A “run everything” step fails as a single unit and teaches you nothing about where it broke.
- Treating dbt as the scheduler for the whole platform when extracts and dashboards still need coordination, or the reverse: scheduling only extracts and leaving transforms manual.
Quick recap
- Orchestration is kitchen management: schedules, dependencies, retries, and alerts.
- Recipes (models) and pantries (storage) still matter, and orchestration makes them repeatable.
- Airflow-style DAGs are flowcharts of tasks, while dbt-style graphs are transform dependencies that something else often schedules.
- Block serving when data tests fail, because honesty beats false freshness.
- Safe-to-rerun date slices make reruns painless.
- Analysts add value by reading graphs, classifying failures, and communicating the time of the last good data.
How to practice this week
- Pick one dashboard you trust in the morning, and find the name of its upstream job or its schedule document, so you know where to look the day it shows something strange.
- List the chain of dependencies in five boxes or fewer: extract → transform → test → summary table → serve.
- Write down the finish-by time that consumers assume, even if nobody documented a promised deadline.
- Ask what happens on a test failure: does the pipeline block, warn, or ignore it? If the answer is “ignore,” that is your improvement backlog.
- Draft a one-sentence outage template, such as “The latest good data for [metric] is from [date] because [task] failed, and [team] owns the fix.”
- Optional: open any orchestrator screen you have access to and identify one DAG or job that feeds your work. Bookmark it.
The next post in this series covers what dbt is in concept (SQL models, tests, and docs) and why analysts should care even if they never own the scheduler.
Series notes
This is Part 4 of How data actually moves. Previous: where data lives. Keep the path, timing, and homes posts nearby.
Sources
- Apache Airflow documentation, “Core Concepts” overview
- Apache Airflow documentation, “DAGs”
- dbt Labs, “About dbt” introduction
- dbt Labs, “About ref function” (model dependencies)
- dbt Labs, “Tests” (generic data tests as quality gates)
- Google Cloud, “What is a data warehouse?” (serve-layer context for scheduled transforms)
Keep going
Same lessons in your feed
Short diagrams, hooks, and weekly tutorials on Substack, Instagram, X, and Facebook.