Category: Analytics
This shelf is the job, not a tool manual. You are here if someone expects a number, a chart, or a “what should we do,” and the spreadsheet is starting to argue with itself. The articles cover the question before the query, a metric with a written definition, a chart that answers something, data that is fit to ship, and the messy middle of pipelines and stewardship.
It is not the SQL category. SQL is how you ask a table. Analytics is what you are trying to decide, and whether the number is even the right one. It is not the AI category either. A model can draft the email about the metric. It does not pick the metric.
Where to start: Analytics foundations if you do not yet have a clear question. Metrics if the team is arguing about a definition. Charts if the picture is pretty and the decision is still fuzzy. The SQL series when you are ready to ask the table yourself. Learn groups these as a track so you do not have to guess an order from a flat list.
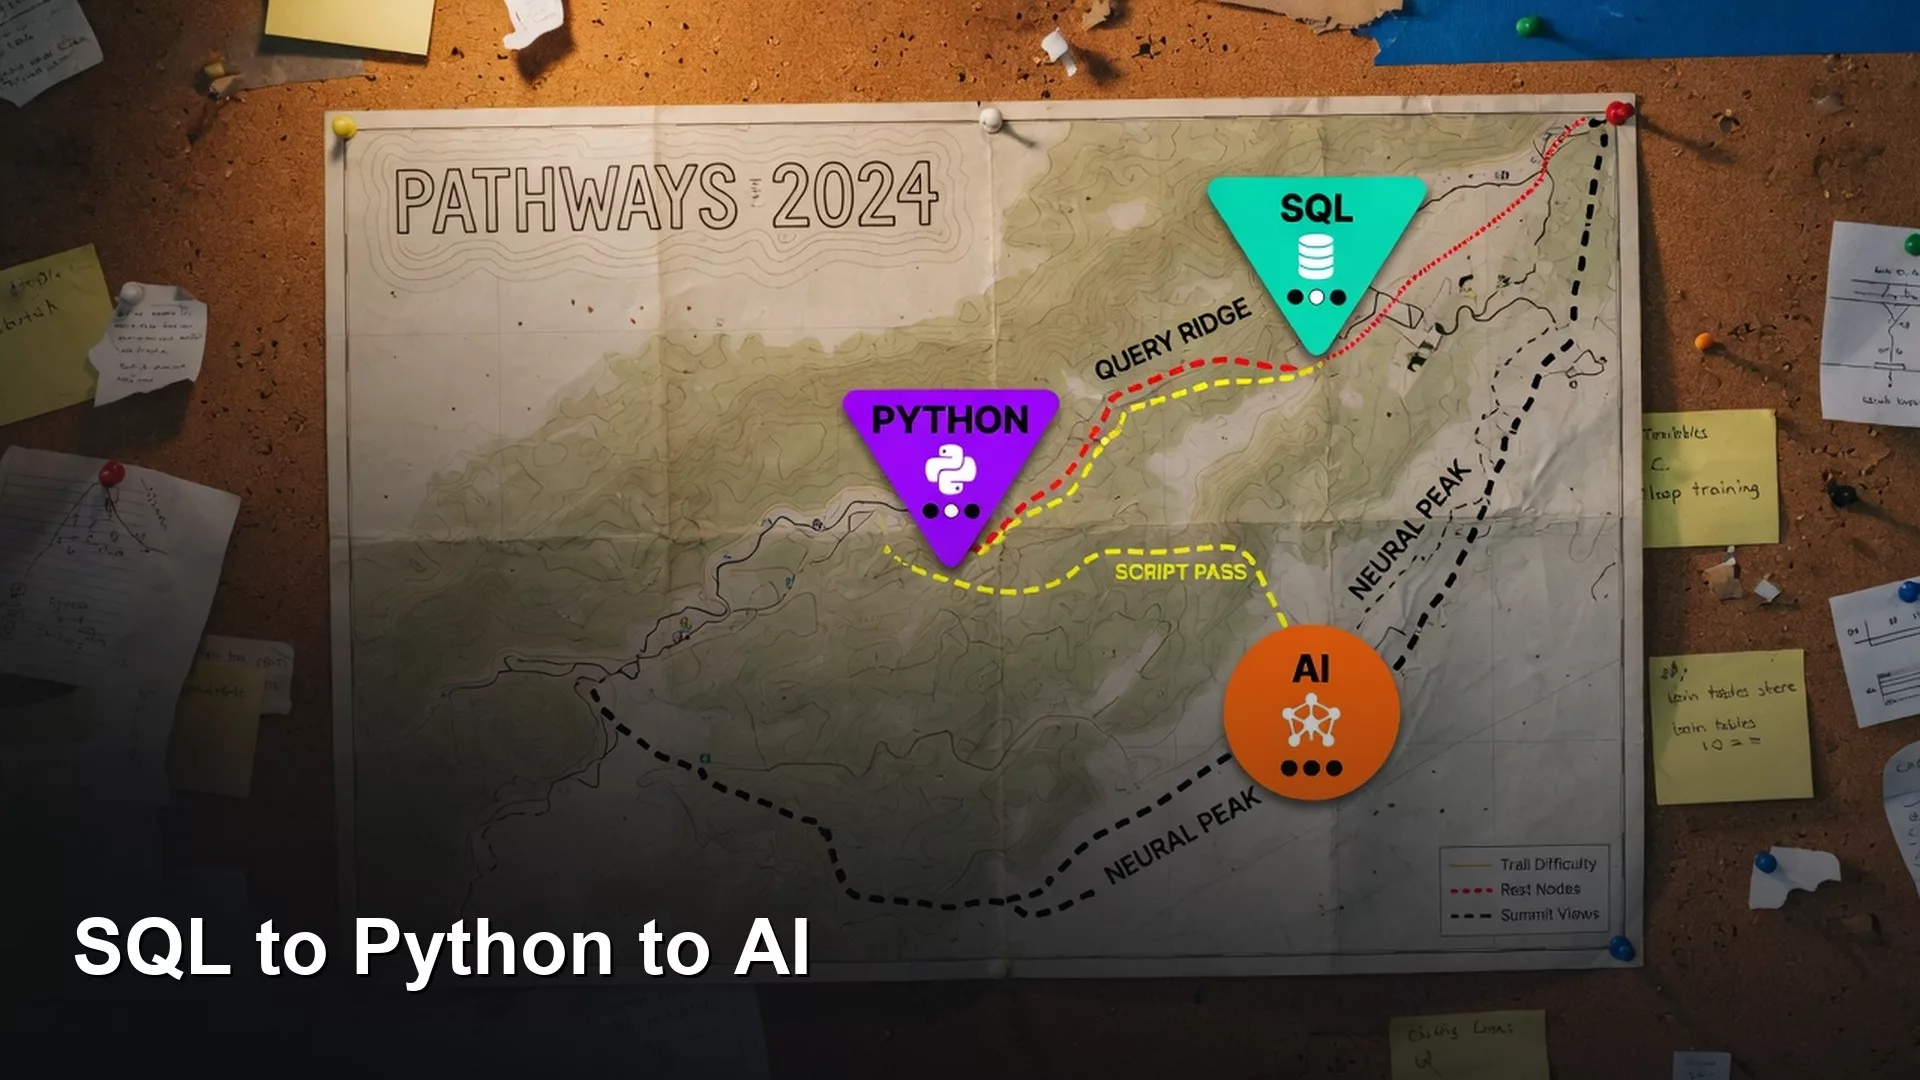
Building a personal learning plan: SQL to Python to AI
A personal learning plan from SQL to Python to AI beats random tutorials. Build a sequenced path, a weekly hour budget, and proof of skill so you stop…
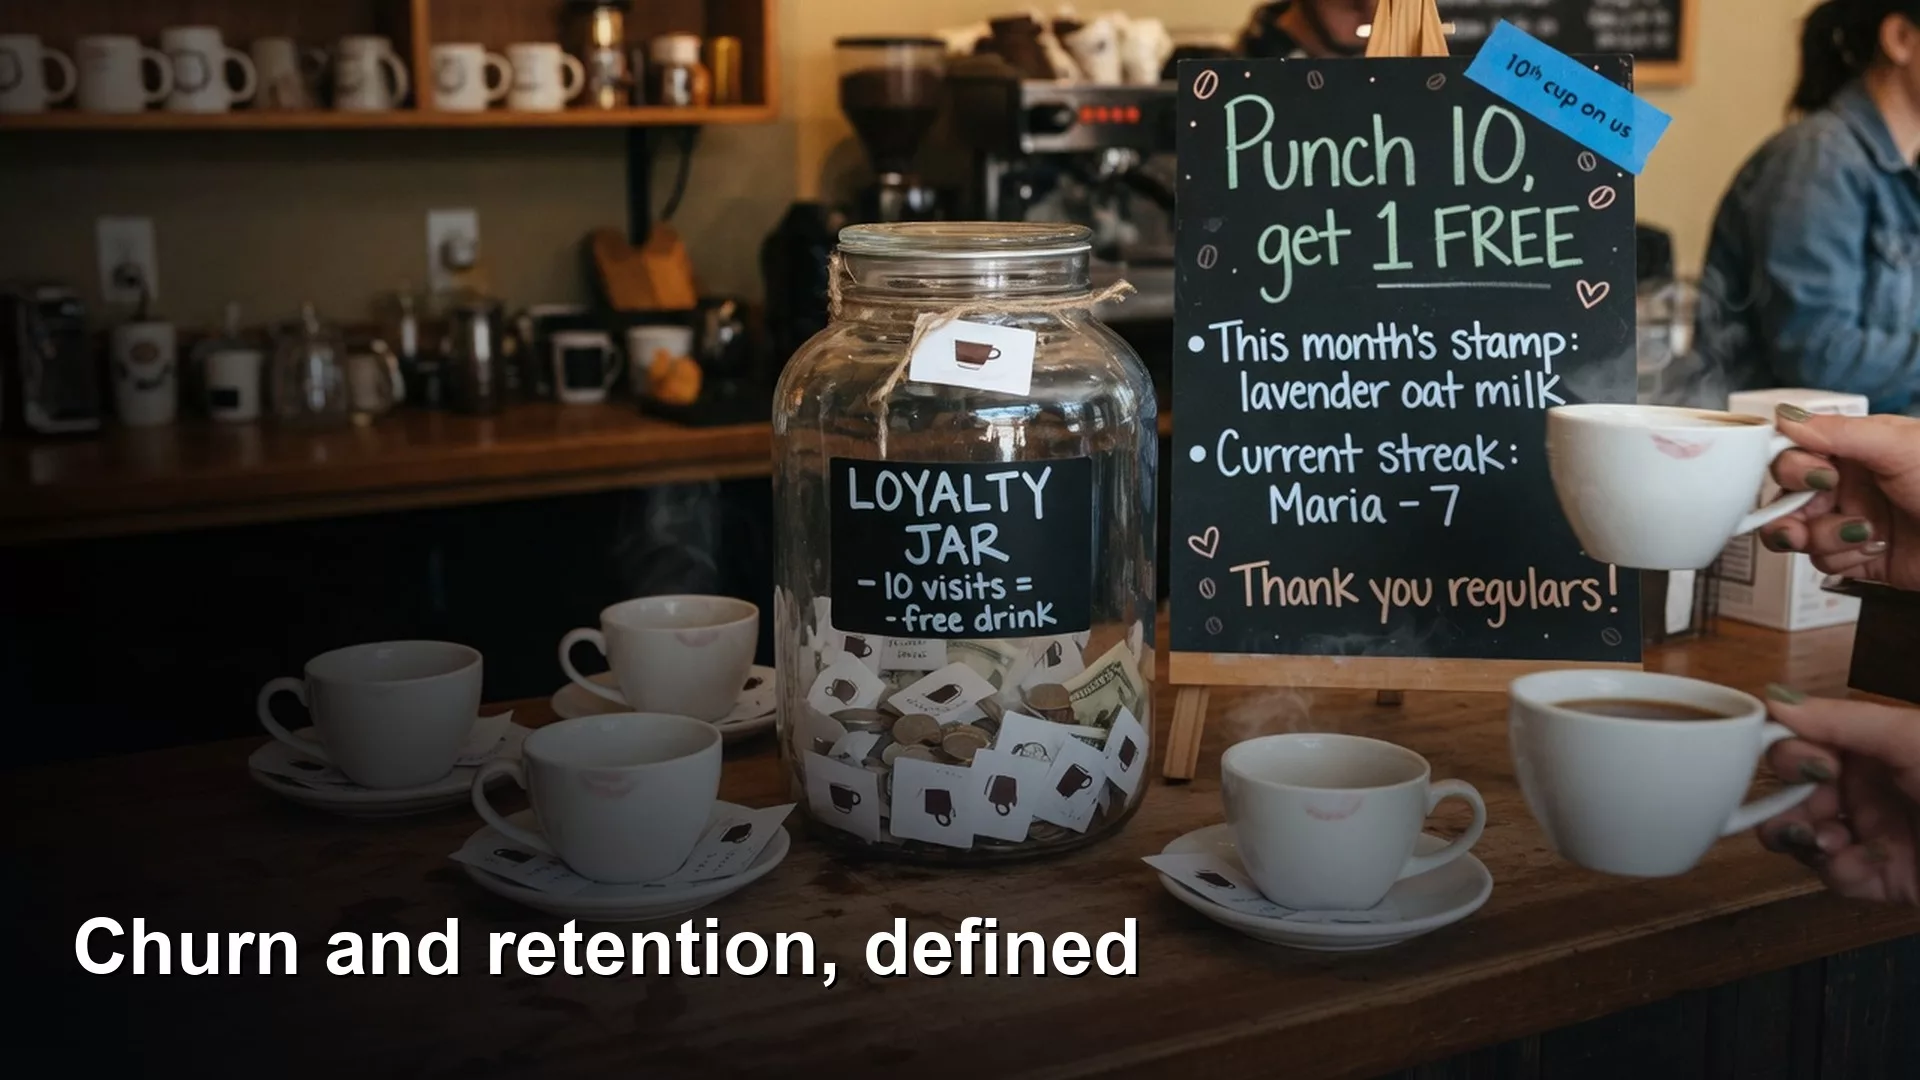
How to define customer churn and retention so everyone agrees
Separate logo churn, revenue churn, gross retention, and net retention before you argue. Same word, different formulas, different decisions.
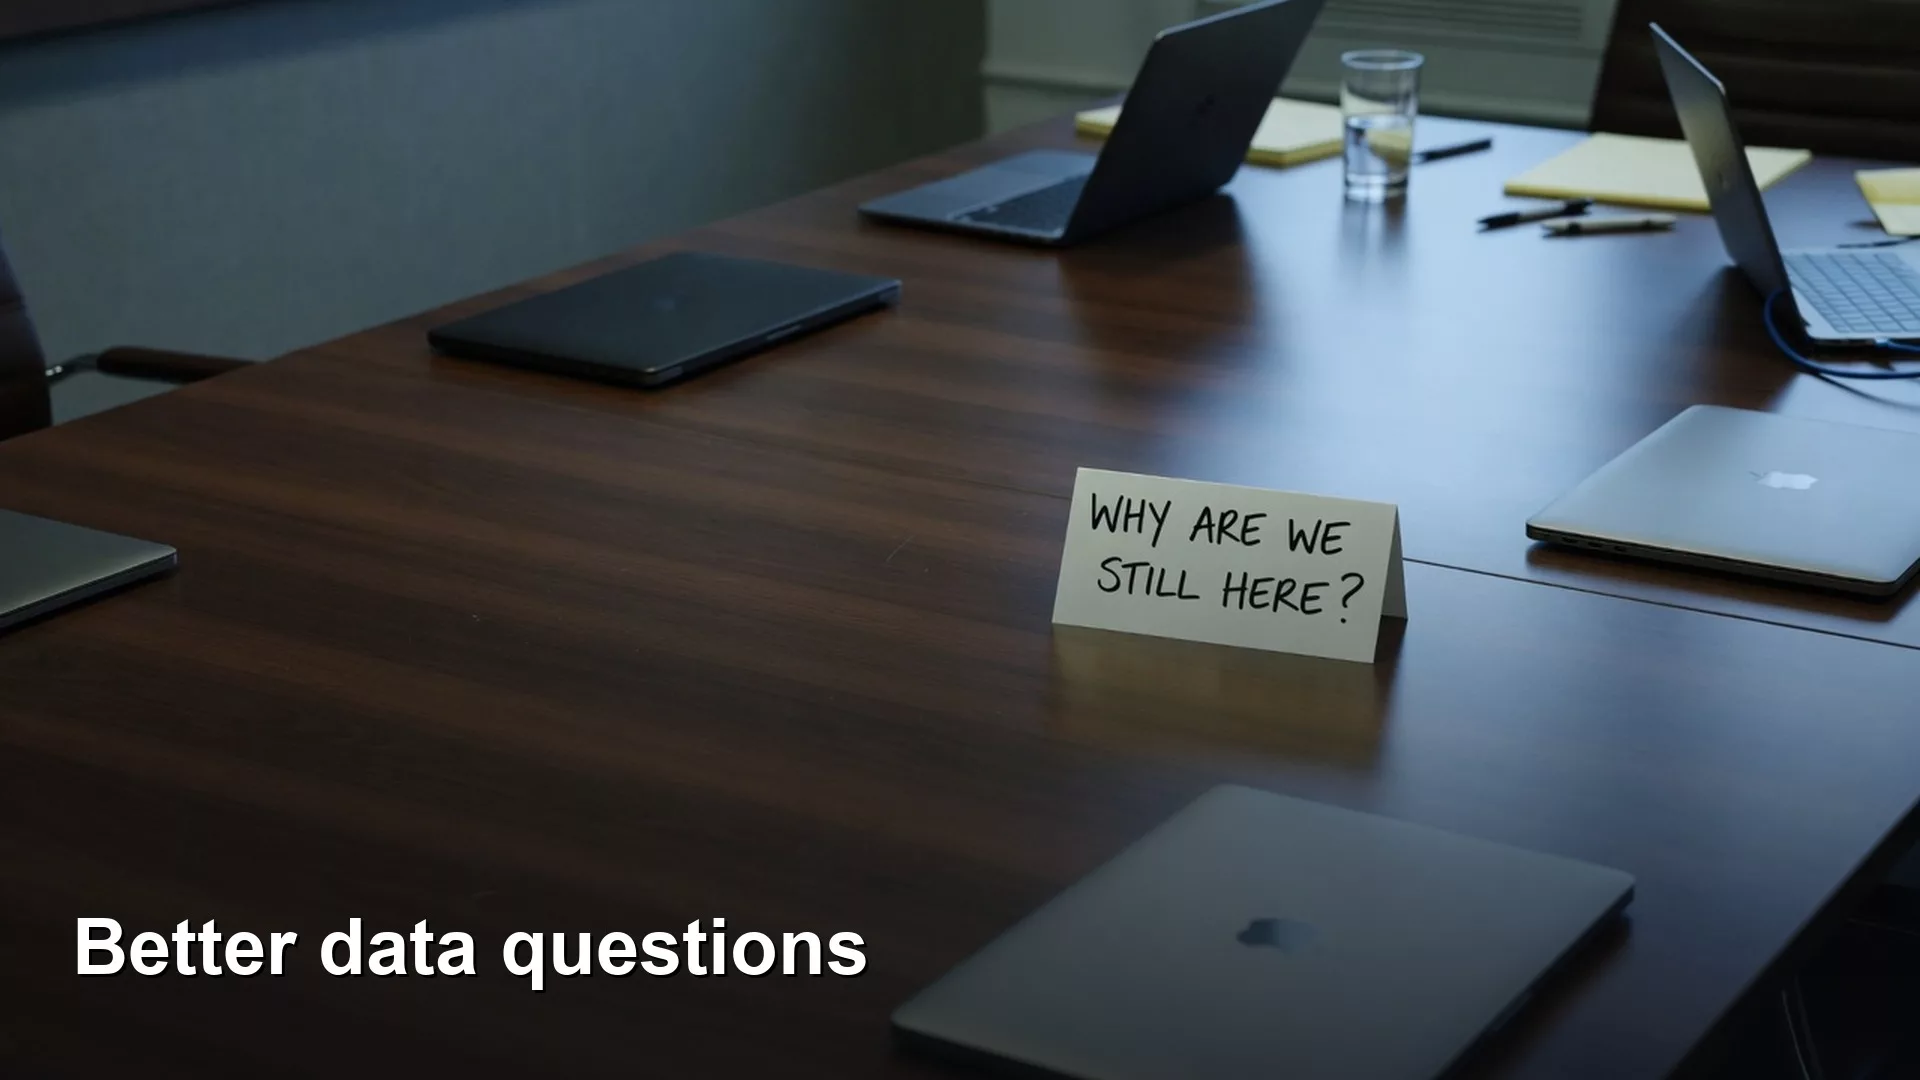
How to ask better data questions in meetings
Ask data questions that name the decision, window, segment, and success criteria. Use a question ladder so meetings end with an answerable next action.
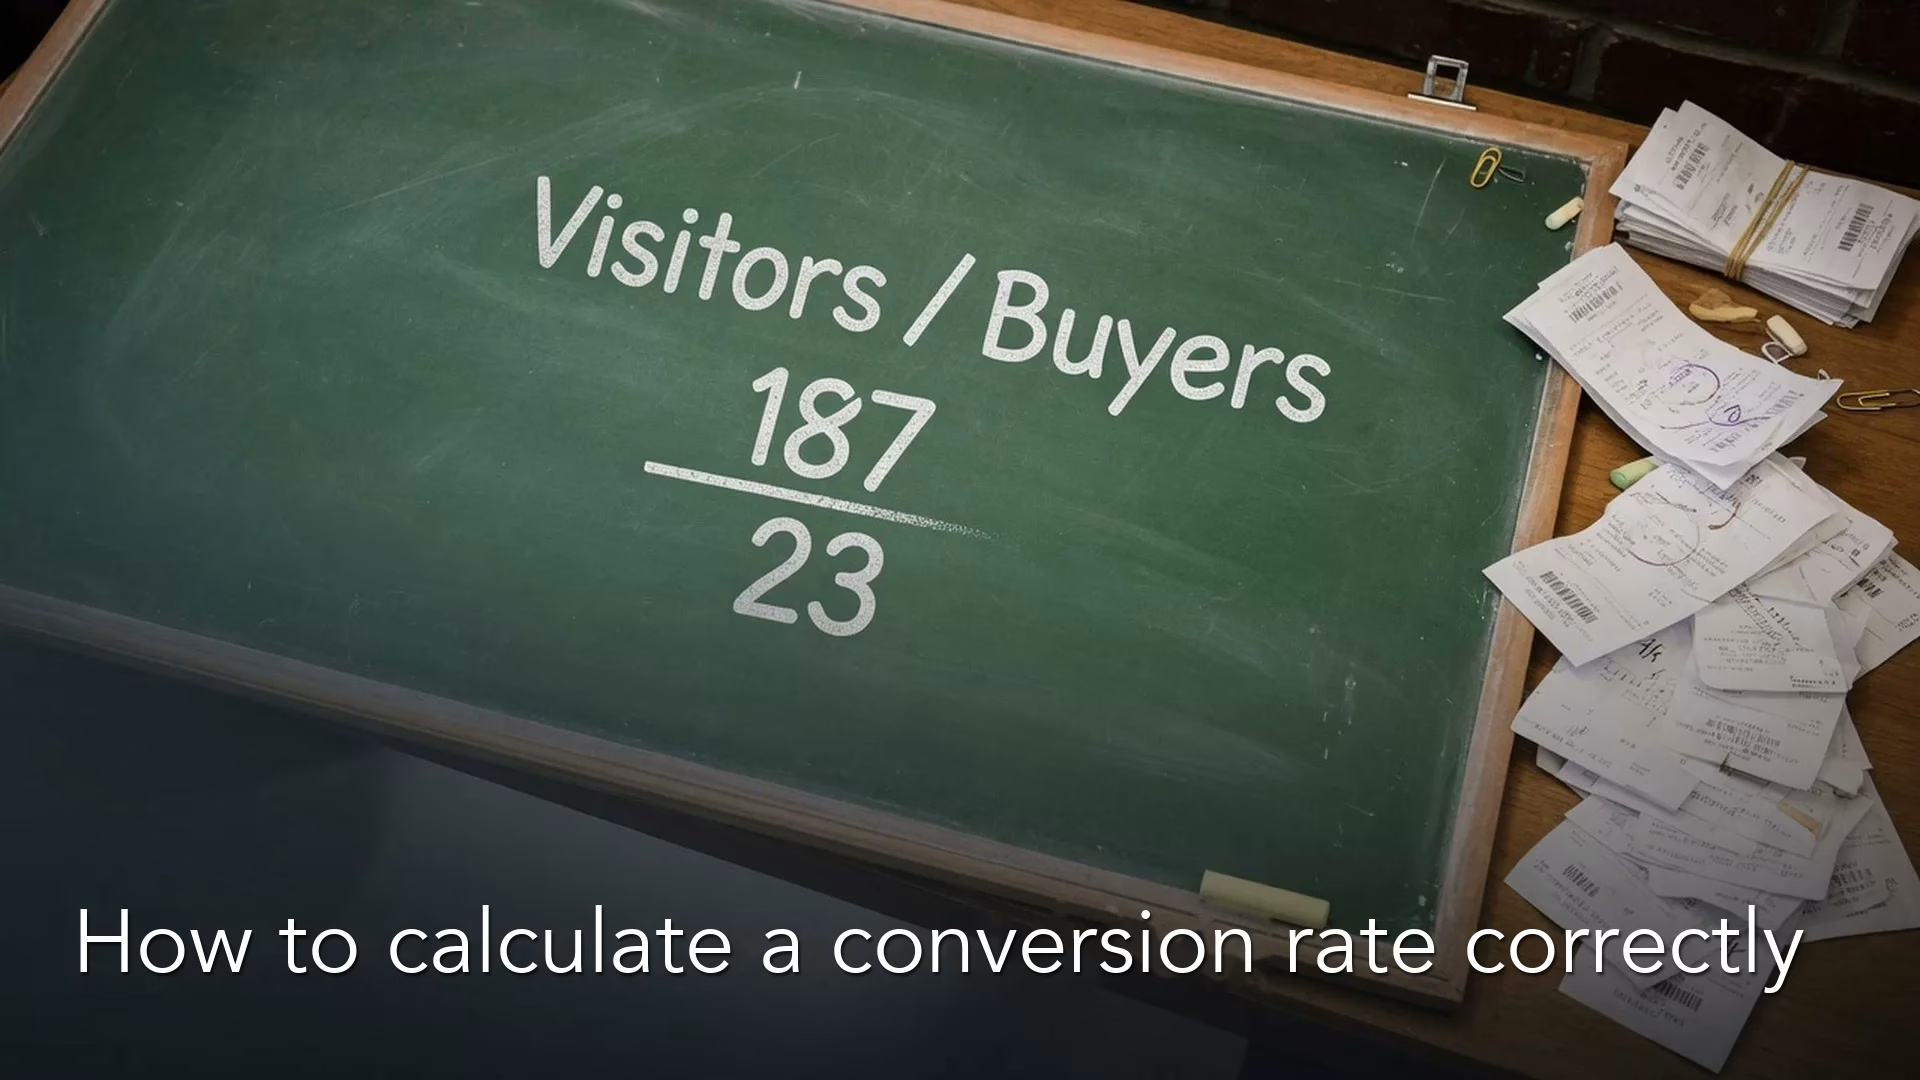
How to calculate a conversion rate correctly
Write conversion as success over eligible with a clear window. Definition cards beat dashboard magic when the same funnel stage means three rates.
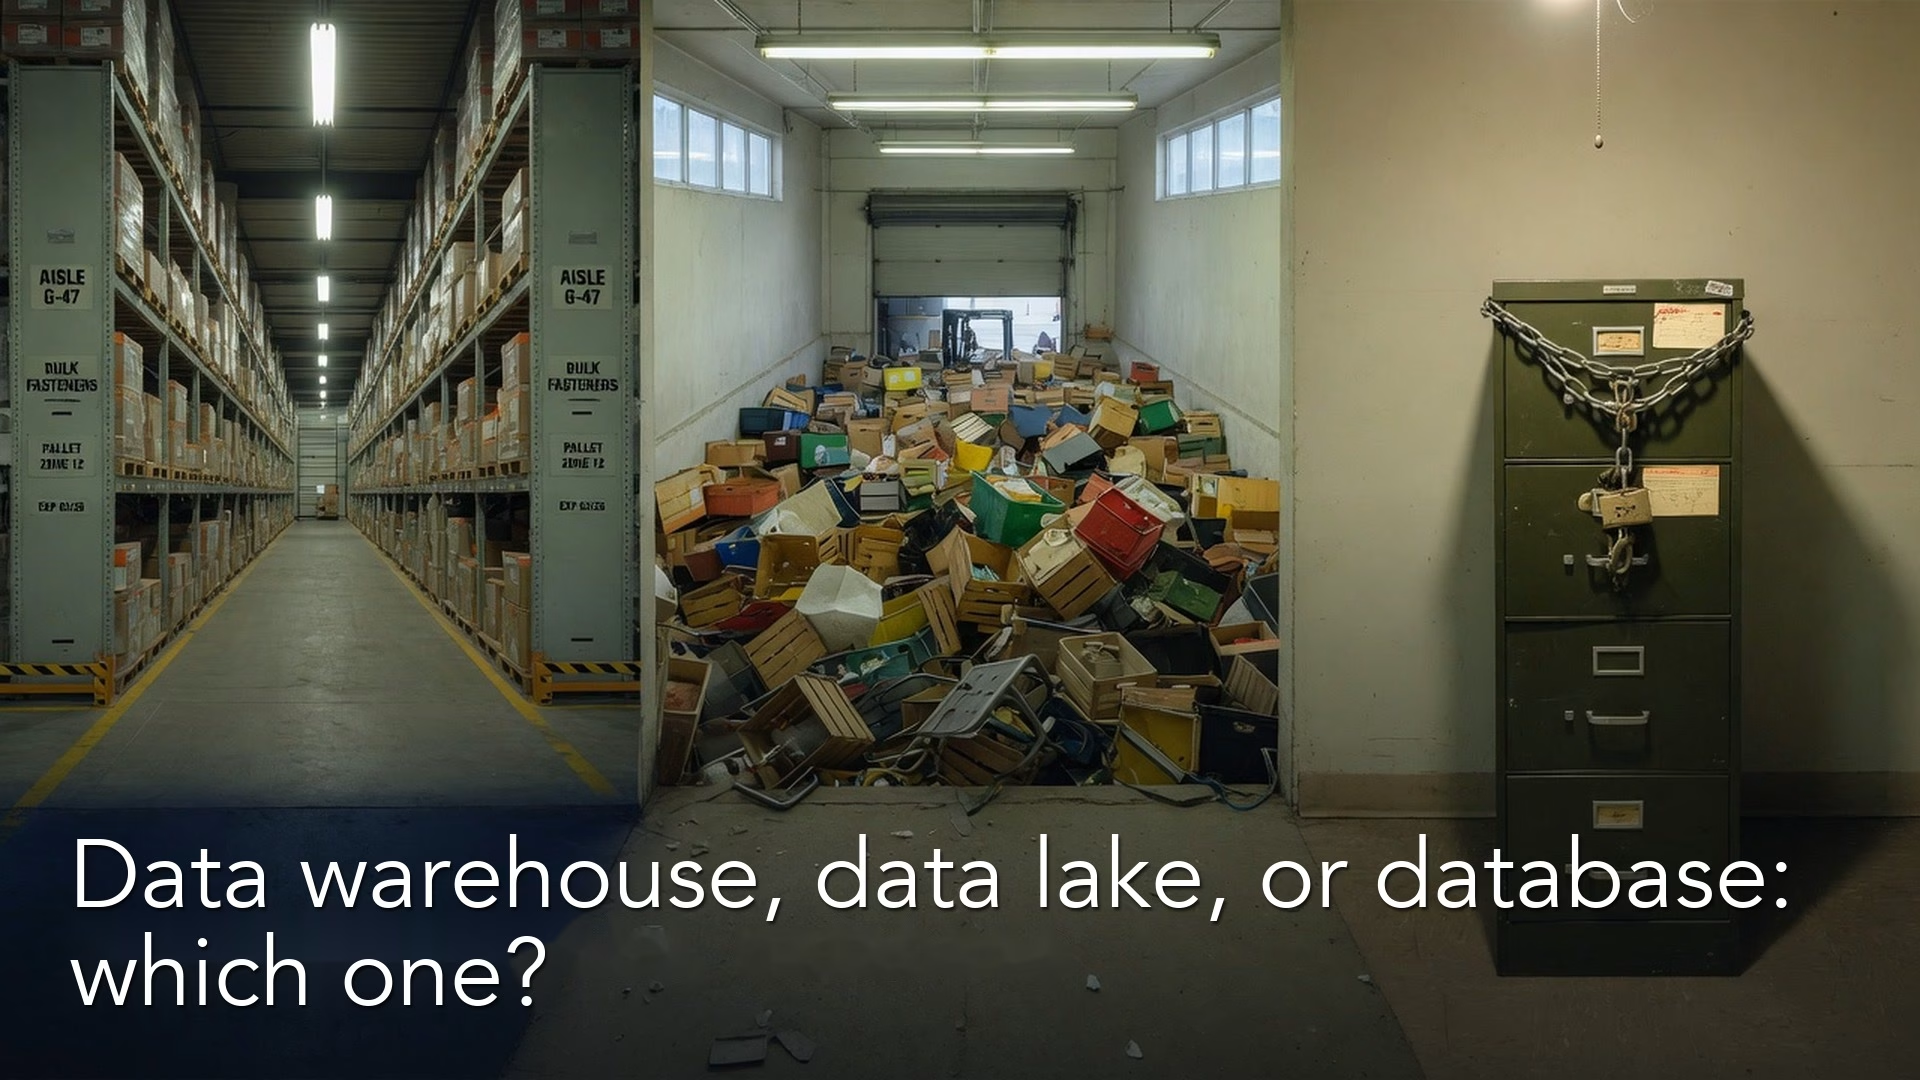
Data warehouse, data lake, or plain database: which one does your data need?
App database, warehouse, or lake? Walk a plain decision tree for where data should live so product traffic, cheap history, and certified analytics stop fighting over one system.