Category: Analytics
This shelf is the job, not a tool manual. You are here if someone expects a number, a chart, or a “what should we do,” and the spreadsheet is starting to argue with itself. The articles cover the question before the query, a metric with a written definition, a chart that answers something, data that is fit to ship, and the messy middle of pipelines and stewardship.
It is not the SQL category. SQL is how you ask a table. Analytics is what you are trying to decide, and whether the number is even the right one. It is not the AI category either. A model can draft the email about the metric. It does not pick the metric.
Where to start: Analytics foundations if you do not yet have a clear question. Metrics if the team is arguing about a definition. Charts if the picture is pretty and the decision is still fuzzy. The SQL series when you are ready to ask the table yourself. Learn groups these as a track so you do not have to guess an order from a flat list.
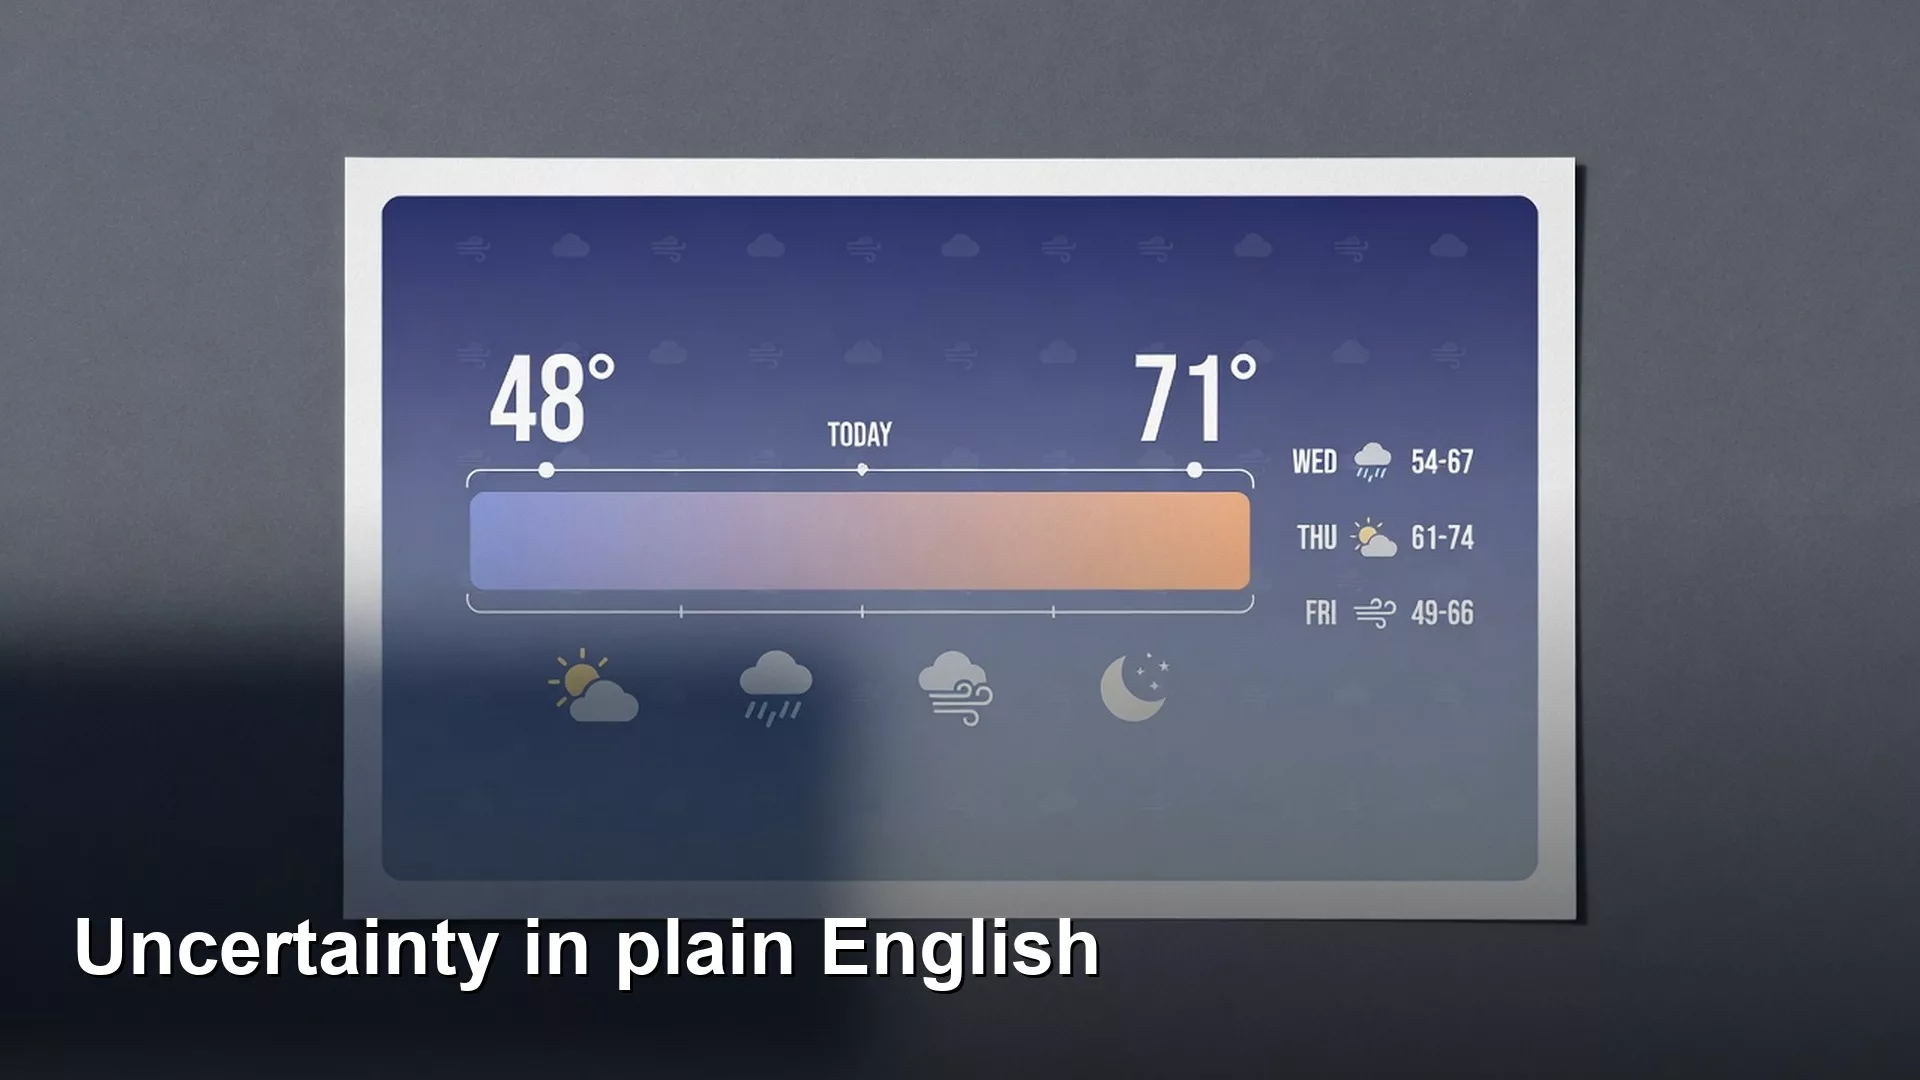
Uncertainty and confidence intervals explained in plain English
Read point estimates with intervals. Confidence intervals show a range of plausible values under a model. Statistical significance is not business importance.
Building a portfolio that gets interviews
Build a small portfolio around clear questions, real method, and a decision-ready takeaway. Fewer strong projects beat many stock dashboards with no problem statement.

What is dbt? How it turns raw warehouse data into clean tables
dbt turns SQL transforms into versioned models with tests and docs. Learn staging, intermediate, and marts so you can read a change even if you do not own…
Inclusive metrics: how to spot the people your numbers leave out
A metric can look clean and still leave people out. Ask who is in, who is out, and what action follows before a KPI becomes policy. Inclusive metrics…
How to use one company-wide goal metric alongside team scorecards
A North Star focuses the company; team scorecards run the work. Build a simple stack of crown metric, input metrics, and team cards so one slide cannot pretend…