Write a one-page definition for every number people argue about: who owns it, what is being counted, the formula, the filters, and the caveats. Then two people can rebuild the same number on Monday without a fight in the team chat. A metric without a written definition is a rumor with a chart.
Say you and a coworker are both asked for “active customers” and both open the same warehouse (the central database where company data is stored). You count anyone who logged in during the last 30 days. Your coworker counts paid seats with a successful API call, meaning a request from another program, in the last 7 days, excluding internal test accounts. Both numbers are defensible, and both will be wrong for the meeting the other person prepared. The argument that follows will sound like a data quality problem, but it is often just a missing metric specification.
A metric without a spec is a rumor with a chart
Example:
| spec_field | bad | good |
|---|---|---|
| Name | Active users | WAA |
| Formula | Users who… something accounts with ≥1 core action in calendar n | |
| Grain | user? | account-week |
Example:
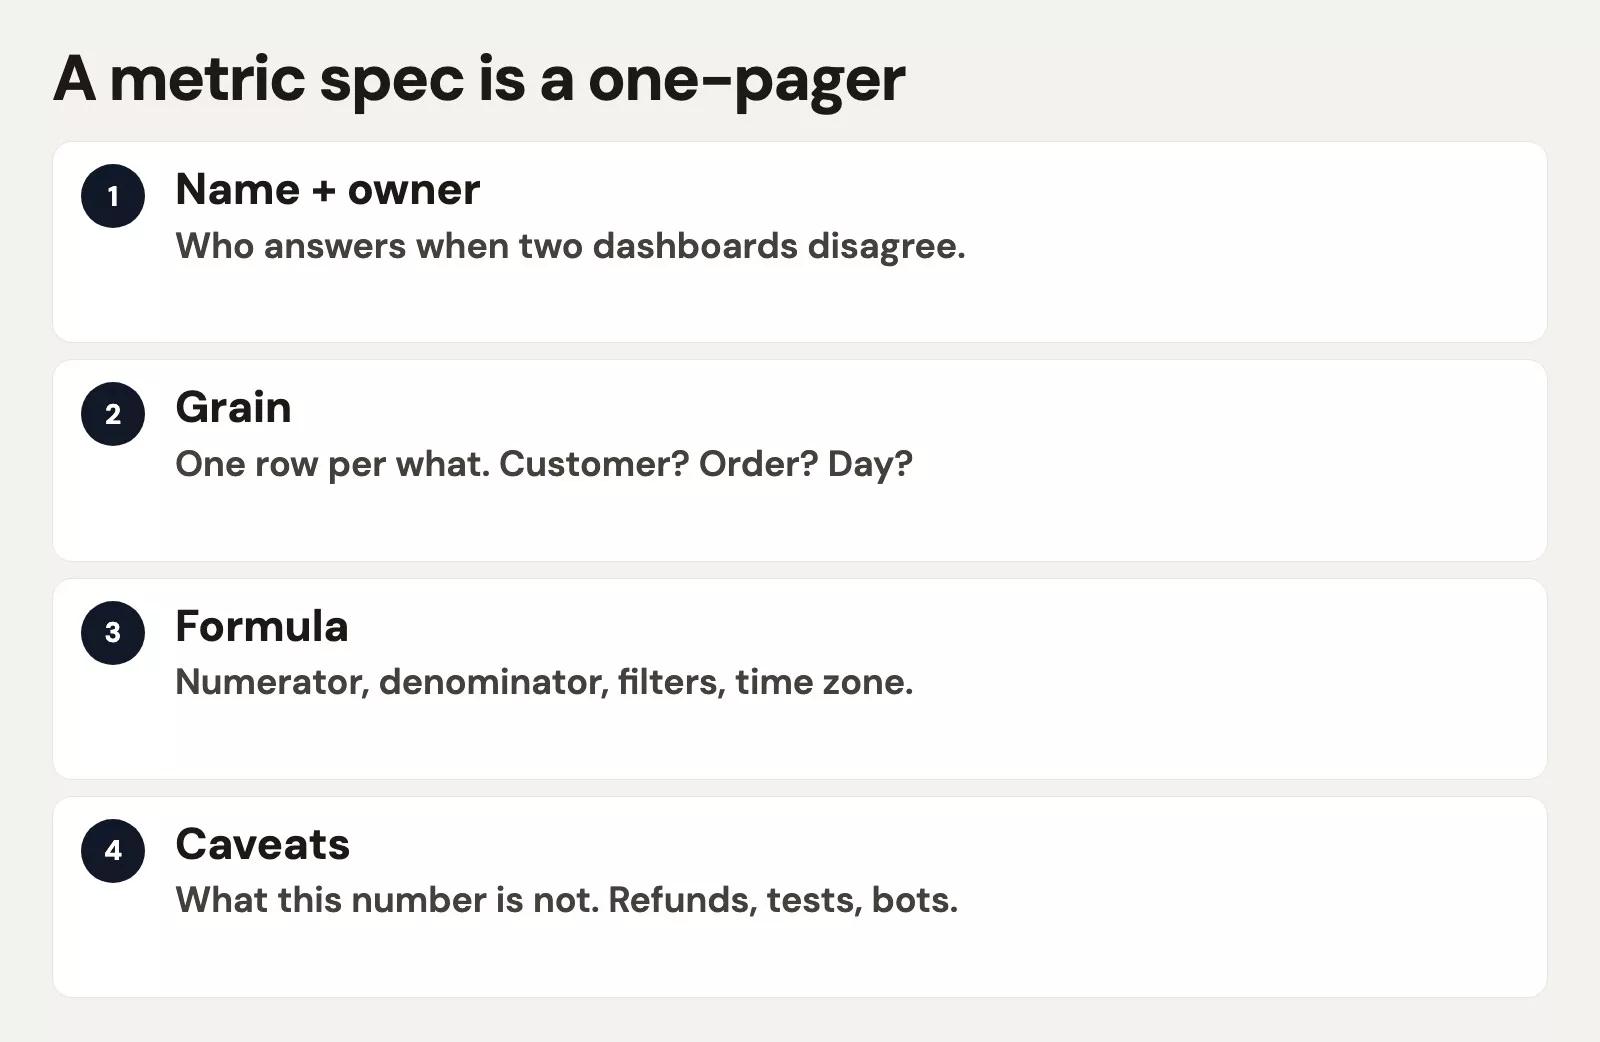
Teams often “agree” in a meeting. Someone says “active means weekly engagement,” everyone nods, and three months later finance, product, and marketing have each put a different active metric into different slide decks. Nobody was trying to sabotage anyone. The vague wording simply spread as the company grew.
A metric specification is a short contract, and it is not a 40-page governance binder. One page, or one ticket with clear sections, is enough for most everyday numbers. The goal is that a competent colleague can rebuild the number from the source data using only the written definition, which is what people mean when they say a metric is reproducible.
That standard matches how good quality work thinks. In the data quality series, the question “is this number fit for use?” depends on the use. A metric spec names the use, the group being counted, and the known cracks. Without it, you are asking charts to carry a meaning they were never given.
Rule of thumb: If the definition only lives in chat messages, the number will drift the first time someone is out sick.
The one-page metric spec (template)
Copy this structure into a document, wiki, or ticket, and keep each section short. Long prose is where a definition hides a disagreement.
METRIC SPEC (one page)
======================
Name (business):
Name (technical / field):
Version + last reviewed:
Status: draft | active | deprecated

1. WHY THIS EXISTS
   Objective link (from goal chain):
   Decision it supports:
   Leading or lagging (or guardrail):

2. OWNERSHIP
   Business owner (can change process):
   Analytics owner (can change calculation):
   Escalation path when numbers disagree:

3. GRAIN
   One row / one unit means:
   Time grain (day, week, month, rolling window):
   Entity (user, account, order, ticket, ...):

4. FORMULA
   Plain-English formula:
   Formal expression (SQL sketch or math):
   Numerator:
   Denominator (if rate):
   Units:

5. POPULATION AND FILTERS
   Include:
   Exclude:
   Source systems of record:
   Join keys / identity rules:

6. TIME AND CADENCE
   Event timestamp used:
   Time zone / fiscal calendar:
   Refresh schedule:
   Late-arriving data policy:

7. TARGETS AND THRESHOLDS
   Target / bands:
   Comparison baseline (prior period, plan, cohort):
   Assumptions:

8. KNOWN CAVEATS AND SIDE EFFECTS
   Data quality risks:
   Gaming risks (light note):
   What this metric is NOT:

9. CHANGE LOG
   Date | change | reason | approver
You do not need perfect formality on day one. You only need enough structure that “active customers” cannot quietly mean three different things.
Why each field earns its space
Owner: who can change the process vs the calculation
Split the ownership in two. The business owner owns the behavior being measured and the goal it serves. The analytics owner owns the calculation, where the data came from, and how the number is published. When those roles collapse into “the data person owns the KPI (key performance indicator, a number tracked to judge progress),” you get beautiful dashboards that nobody can fix in practice, or process owners who quietly redefine success in a spreadsheet.
Also name the escalation path. If Finance and Marketing disagree by 4%, someone needs to call the meeting, decide what evidence counts, and set a deadline for the decision. Without that, disagreements turn into endless digging through old chat threads.
Grain: what one unit means
Grain means the size of one thing you count, and it is the silent killer of metric debates. Are you counting users or accounts? Orders or order lines? Tickets or every message inside a ticket? Daily snapshots or rolling 28-day windows? If you cannot finish the sentence “one unit of this metric means ___,” stop building charts.
Grain also decides how you combine tables. If you join account-level activation carelessly to user-level events, you create double counts that look like growth. It is the same grain discipline you need in tidy data and quality work, which is to name the unit before you add anything up.
Formula: numerator, denominator, units
Write the formula in plain English first, then in a sketch that someone else could implement. A rate needs both a top number (the numerator) and a bottom number (the denominator), and “conversion” without a denominator is only a vibe. Units prevent comedy too. Is revenue in contracted US dollars, US dollars actually collected, or local currency converted with a stale exchange rate table?
A SQL sketch (SQL is the language used to ask databases questions) is allowed and useful, even if the final calculation lives in a business intelligence tool. The sketch is documentation and not production code. If you later rebuild the metric in pandas from the Python for analytics series, the same formula text should still hold. Tools change, and the meaning should not.
Filters: include, exclude, and the source you trust
Filters are where ethics and accuracy meet. Excluding internal test accounts is normal, while excluding a region because it looks bad is not. Write inclusions and exclusions as lists, and name the one system you treat as the official record for each fact. If your customer-tracking tool is the source for deal stage and the warehouse is the source for revenue, say how the two are reconciled.
Identity rules belong here too, meaning how you treat merged accounts, duplicates, and guest checkouts. If the quality work has not finished removing duplicates (see the quality series), the spec should say “known duplicate risk in this table” under caveats instead of pretending to be precise.
Caveats: honesty that protects trust
Caveats are not a weakness, and they are what a professional writes down. Late-arriving events, partial tracking, changes in definition, and known ways people game the number should all be visible next to the figure. The charts series will tell you to annotate your charts, and the metric spec is where those annotations start as policy instead of last-minute slide footnotes.
Also write what the metric is not. “Weekly active accounts is not a revenue forecast.” “First response time is not customer effort.” Boundaries like these stop people from over-claiming in meetings.
Worked example: weekly active accounts
We will specify one metric from start to finish. Imagine a business-to-business product team that wants an early health signal for product engagement, tied to the goal “customers get ongoing value, not only a successful onboarding.” The earlier posts in this series covered how to choose that kind of metric and how to pair early signals with later results.
Filled one-pager (narrative form)
Name: Weekly Active Accounts (WAA, accounts that used the product that week), stored as metrics.waa_weekly, which is version 1.2, reviewed 2026-07-01, and currently active.
Why: This is an early indicator of product engagement for paid accounts. It supports the decision “do we invest in activation and core workflow quality this sprint, or is engagement healthy enough to focus elsewhere?” (A workflow here means the main steps customers follow in the product.) On its own it is not a board-level result metric.
Owners: The business owner is the Head of Product Operations, and the analytics owner is the Product Analytics lead. For escalation, if WAA and finance’s count of paid customers disagree by more than 3% for two weeks, Product Operations calls a 30-minute definition review with Analytics and Finance.
Grain: One row per account per ISO (International Organization for Standardization) week, the standard calendar week running Monday through Sunday, using the America/New_York time zone. The entity is account_id in the billing system, mapped to the product’s tenant_id through the identity table.
Formula (plain English): Count the distinct paid accounts that had at least one qualifying product event during the week.
Qualifying event: any one of a report export, a dashboard (a screen of charts that tracks key numbers) share, or an API write call. Page views alone do not count.
Filters: Include paid accounts in good standing as of week end. Exclude internal, test, partner sandbox, and churned accounts whose cancel date is on or before the week’s start. Also exclude events from staff impersonation sessions, where support staff act as a customer.
Cadence: Rebuild the number daily for the current week, which is only partial, and finalize it two days after the week ends so late events can arrive. The timestamp used is the event’s occurred_at value in UTC (Coordinated Universal Time, the world reference time zone), converted to America/New_York to assign the week.
Target: Hold WAA at or above 72% of paid accounts, and investigate if it drops by more than 4 points week over week without a known outage.
Caveats: Mobile app events were under-tracked before March, so do not compare earlier WAA to current values without a break note. API write calls can be scripted, so watch accounts with extreme API-only activity. WAA is not revenue and is not seat utilization.
SQL sketch (documentation, not production gospel)
SELECT
  date_trunc('week', e.occurred_at AT TIME ZONE 'America/New_York')::date
    AS week_start_ny,
  COUNT(DISTINCT a.account_id) AS waa
FROM billing.accounts AS a
JOIN map.account_to_tenant AS m
  ON m.account_id = a.account_id
JOIN product.events AS e
  ON e.tenant_id = m.tenant_id
WHERE a.status = 'paid'
  AND a.is_internal = FALSE
  AND a.is_test = FALSE
  AND e.event_name IN ('report_export', 'dashboard_share', 'api_write')
  AND e.is_staff_impersonation = FALSE
  AND e.occurred_at >= DATE '2026-03-01'  -- post instrumentation fix
GROUP BY 1
ORDER BY 1;
Real production may use dbt models, incremental tables, or a semantic layer, which is a shared place where metric definitions live. The sketch still earns its place because it forces the event names, joins, and exclusions into the open.
Weak vs strong definition side by side
| Spec field | Weak (causes fights) | Strong (rebuildable) |
|---|---|---|
| Name | Active users | Weekly Active Accounts (WAA) version 1.2 |
| Owner | Data team | Product Operations (business) plus Product Analytics (calculation) |
| Grain | Weekly activity | Distinct paid account per calendar week (Monday through Sunday, New York time) |
| Formula | People who use the product | Distinct paid accounts with an export, share, or API write |
| Filters | Ignore tests if possible | Exclude internal, test, sandbox, churned, and staff impersonation |
| Time | Last 7 days, roughly | Calendar week, finalized two days later for late events |
| Caveats | (none) | Earlier mobile tracking gap; API scripting risk; not revenue |
How to introduce specs without bureaucracy theater
You do not need a metric council for every tile on a personal exploration dashboard. Start where a disagreement is expensive, which usually means one of these four places:
- Anything on an executive scorecard
- Anything tied to compensation or vendor bonuses
- Anything used in public claims to customers, press, or the board
- Anything two teams have already argued about twice
Store specs where work already happens, such as the wiki next to the dashboard, the dbt docs, the description field in your business intelligence tool, or a shared “metric catalog” page. Link the dashboard tile to the spec, and if the tile cannot link, put the version number in its subtitle. That is small friction for a large gain in clarity.
When a definition changes, version it instead of silently editing history. A change-log line protects trust better than a perfect first draft.
Specs, quality, and charts are one system
A clean chart of a vague metric is still vague. An honest axis (from the charts series) cannot fix a group of customers nobody has named, and a quality scorecard cannot decide whether page views count as active. The metric spec is the contract that lets quality engineers, analysts, and managers share one language.
The foundations still apply. If the objective is mush, even a perfect WAA will not save you, so go back to the chain from goal to metric in the first post of this series. If you only look at result metrics such as revenue, the pairing advice from the second post still applies. Specs make either type of metric safer to run.
For paths across metrics, quality, Python, SQL, and charts, start from Learn. For the friendly prequel on what a KPI is, stay with All About KPIs.
Common mistakes
- Definition by demo. Someone clicks filters live and calls that the standard.
- One owner for everything. Analytics cannot own process change, and process owners cannot silently own the SQL.
- Grain left implied. Users versus accounts versus seats will ambush you.
- A rate without a denominator. If “conversion is up,” up from what base?
- Hidden exclusions. If you drop a segment, write it down and say why.
- No late-data policy. Monday’s partial week gets treated like a final verdict.
- Silent redefinition to hit a target. That is fiction, so version the change and restate the history.
- Forty-page specs nobody reads. One page that gets used beats a binder that does not.
- Specs only for result metrics like finance. Early-signal metrics need definitions even more, because they are easier to game.
Quick recap
- Verbal metric definitions drift, while written specs keep a number rebuildable.
- One page is enough: why, owners, grain, formula, filters, time, targets, caveats, and a change log.
- Split business ownership from analytics ownership.
- Grain and filters prevent most “why don’t our numbers match?” fights.
- Caveats and versioning protect trust when the world or the tracking changes.
- Specs make quality work and chart work point at the same meaning.
How to practice this week
- Pick one metric that already causes questions in meetings.
- Fill in the one-page template without looking at the dashboard first, using only what you can state from memory. The blanks are your risk map.
- Ask a colleague to rebuild the number from your page alone, and note every question they ask. Those questions are fields your spec was missing.
- Add a version number and a review date, and put a link on the dashboard or in the slide footer.
- List two caveats you have been saying out loud but never wrote down, and write them.
- If the implementation turns out to be wrong, fix the spec first and then the query (a written request for data). Do not just patch the SQL without updating the meaning.
The next post in the series compares single North Star metrics with team scorecards, and covers when one number is too few and when a dozen is too many. You will reuse this spec format there so each scorecard line is still rebuildable.
Series notes
This is Part 3 of Metrics that matter. The previous post covered early versus late indicators, and the next one covers Goodhart’s law and gaming.
Sources
- What Matters, OKRs explained (measurable results need clear definitions): https://www.whatmatters.com/okrs-explained
- Amplitude, leading vs lagging (context for which metrics need tight specs): https://amplitude.com/blog/leading-lagging-indicators
- Analytics Made Simple, All About KPIs: https://analyticsmadesimple.com/analytics/all-about-kpis/
- Analytics Made Simple, Data quality series: https://analyticsmadesimple.com/series/data-quality/
- Analytics Made Simple, Charts that make sense: https://analyticsmadesimple.com/series/data-viz/
- Analytics Made Simple, Python for analytics: https://analyticsmadesimple.com/series/python/
- Analytics Made Simple, Analytics foundations: https://analyticsmadesimple.com/series/analytics-foundations/
- Analytics Made Simple, Learn hub: https://analyticsmadesimple.com/learn/
Keep going
Same lessons in your feed
Short diagrams, hooks, and weekly tutorials on Substack, Instagram, X, and Facebook.