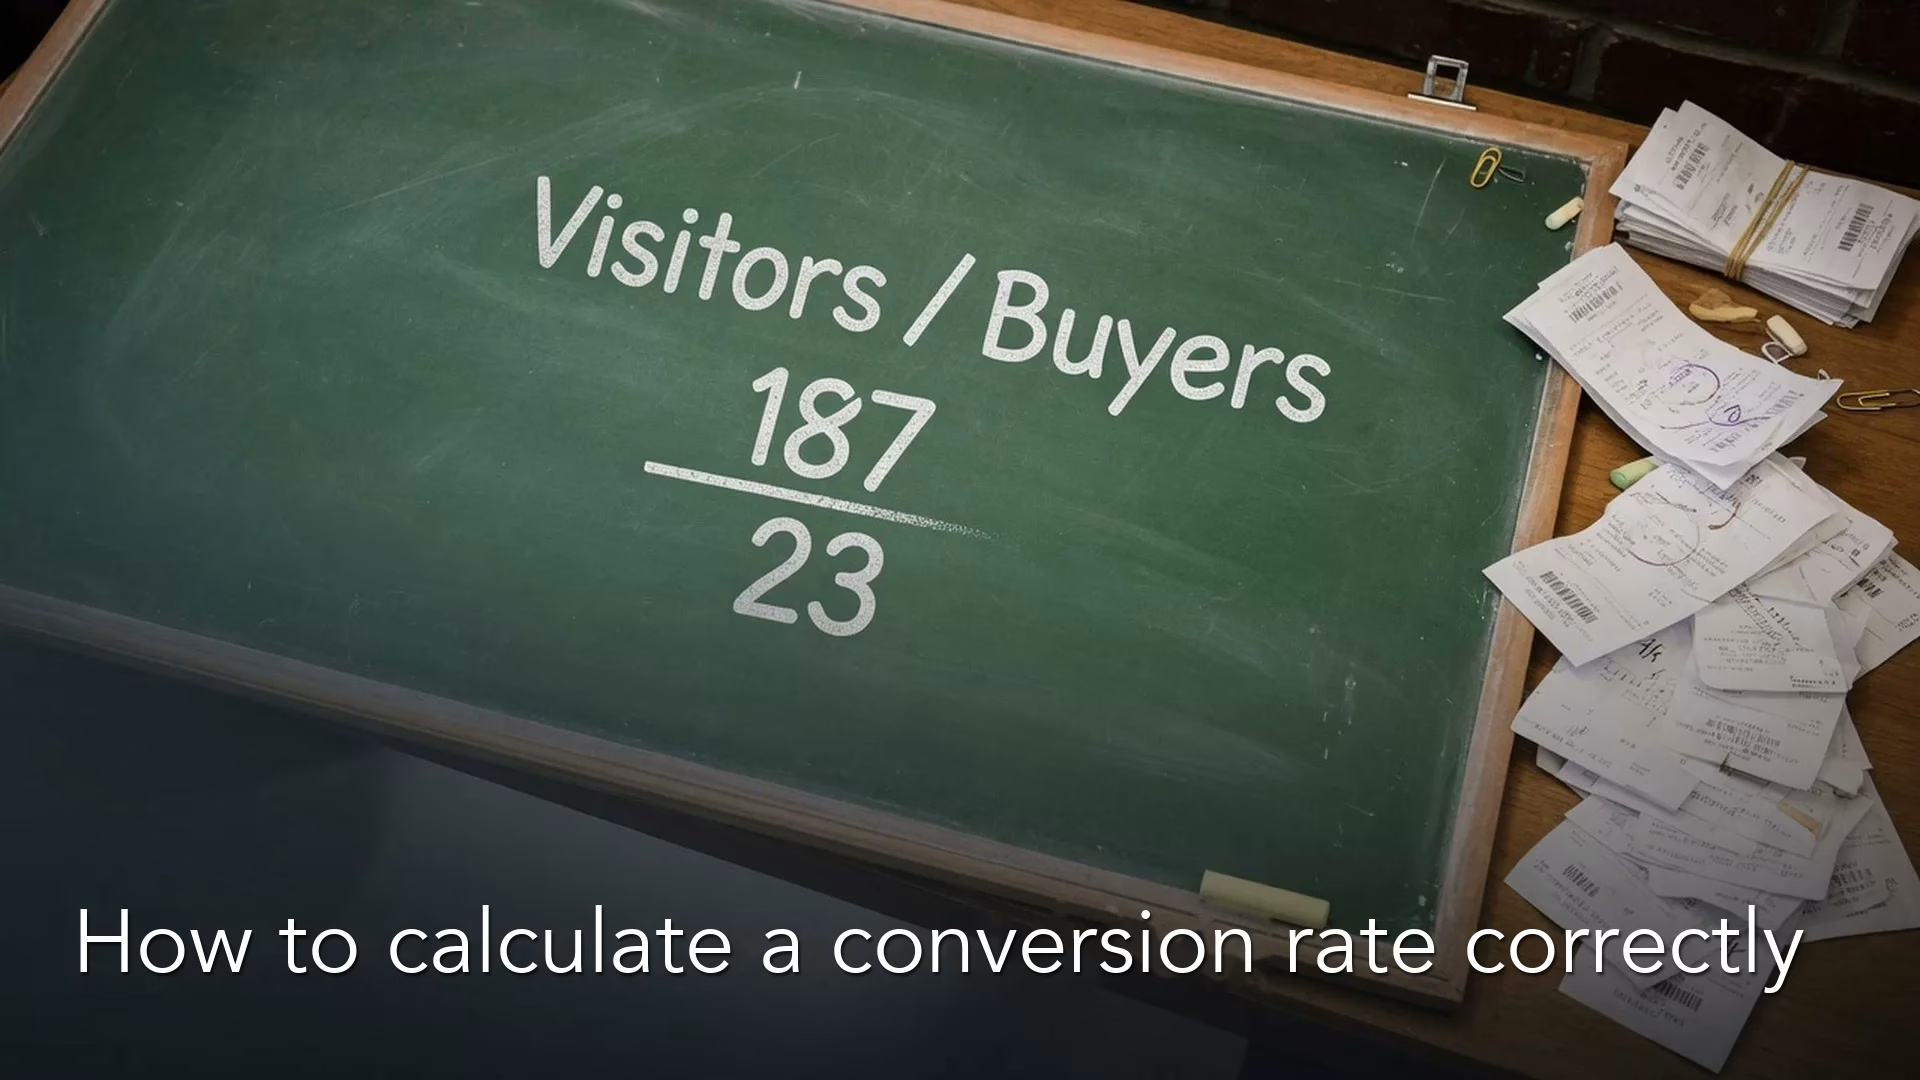
A conversion rate is the number of people who did the thing you wanted, divided by the number of people who could have done it. The trouble starts when nobody writes down who counts as “could have,” what counts as “did it,” and how long you are willing to wait. Change any one of those and a 4.2% turns into a crisis or a triumph. The product did not change at all.
Conversion rate is the most popular fraction in business, and it is also one of the easiest to get wrong by accident. Stretch the time window, count the wrong kind of success, or mix brand-new visitors with returning ones in the same denominator (the bottom number of the fraction), and the slide still looks decisive. Say you are handed a chart that says “signup conversion is 4.2%.” Before you react, find the three decisions behind that number.
Conversion math in one card
Every conversion metric is three decisions dressed up as one percentage:
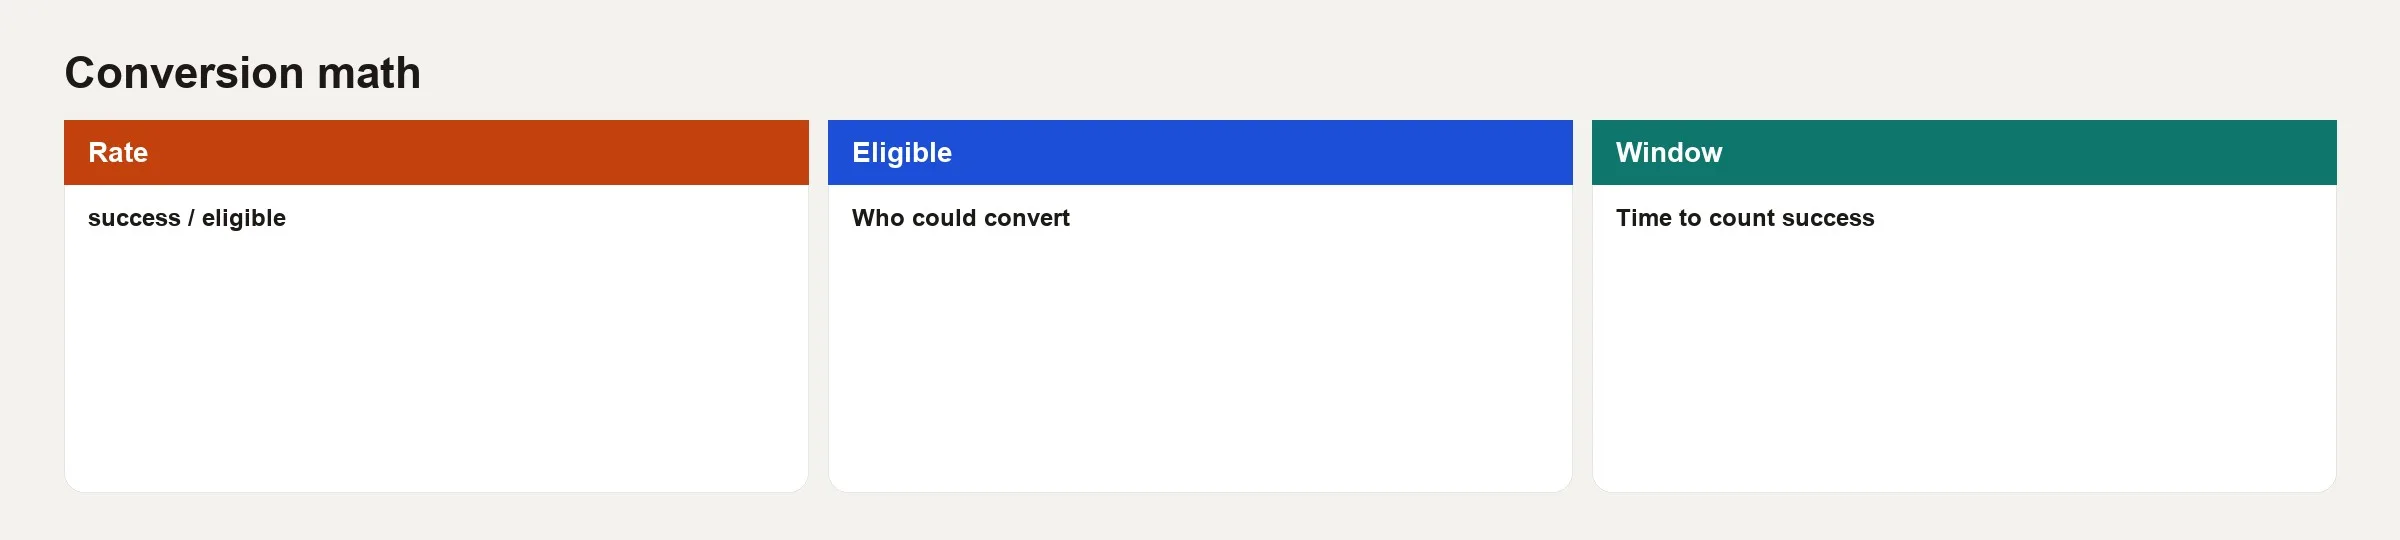
- Rate: the count of successes divided by the count of people who were eligible.
- Eligible: who could have succeeded under your definition. This is the bottom of the fraction, and it needs discipline.
- Window: how long after someone becomes eligible you still count a success.
Write all three down every time. “Signup conversion is 4.2%” is incomplete. “Of users with session_start in week W (eligible), 4.2% had account_created within 1 day (window)” is a real metric, because anyone can now check it.
Eligible: the quiet half of the fraction
Most arguments about conversion are really arguments about the denominator. These questions come up most often:
- Do you include bots, employees, and QA (test) accounts?
- Do users who are already logged in count as entering a “signup” funnel?
- For paid conversion, is the base all activated users, all signups, or only users who saw pricing?
- For an email button, is “eligible” everyone the email was delivered to, everyone who opened it, or everyone who clicked an earlier link?
A good rule is that the eligible group should be the people who could reasonably take the success action under your product rules. If someone never saw the paywall, counting them as a non-converting “pay eligible” user invents a failure that is really a reach problem. Sometimes you want both rates, one “among all signups” and one “among pricing-page viewers.” That is two metrics, not one metric with two moods, so give them different names.
Success: one event, one grain
Success should be one clear event or state at a stated grain, which means the unit you count: a user, an account, a session, or an order. Mixing grains hurts you. For example, “conversion rate of sessions to paying users” never says how a user with several sessions gets counted.
Prefer one of these three:
- User-level: the share of eligible users who succeed in the window.
- Session-level: the share of eligible sessions that succeed. This is good for testing one step of the experience, but a poor stand-in for revenue if users visit many times.
- Account-level: the reality for business customers, where the people who use the product and the people who buy it differ.
If finance cares about paid accounts while the product team tracks users, connect the two with an explicit rollup. Do not quietly average across mismatched grains. The result will mean nothing to either team.
Windows: where honest rates go to die
A 1-day signup window and a 30-day signup window describe different products. Longer windows raise the rate but delay the report, while shorter windows are faster for the operations team but miss people who take their time.
These are practical patterns to start from:
- Same day or 24 hours: good for friction in the first-use experience.
- 7 days: a common activation window for consumer apps.
- 14 or 30 days: business trials, sales-assisted deals, and other higher-consideration purchases.
- Unbounded: almost never right for an operating metric, because the group of customers you are measuring never finishes maturing.
When you report a rate for last week’s eligible users, say whether the window has fully matured. A “7-day activation” number on day 2 is only a partial answer. Label it as such, or you will celebrate a rate whose denominator is still filling in.
Step rate versus overall rate
Step conversion is success at stage N among those who reached stage N-1, within a step window. Overall conversion is success at a late stage among everyone who entered an early stage, for example from visit to payment.
Overall rates roughly multiply the step rates together, when the definitions nest neatly. A team can improve the visit-to-signup step while payment stays flat, if the step from activation to payment collapses at the same time. When you are diagnosing a problem, always show the full chain of step rates. The overall rate alone is a summary, not a diagnosis.
A toy conversion you can recompute
Imagine 1,000 eligible users last week, meaning people who signed up and were not employees or bots. Success is a first paid plan within 14 days, and so far 42 of them have succeeded with the full window matured.
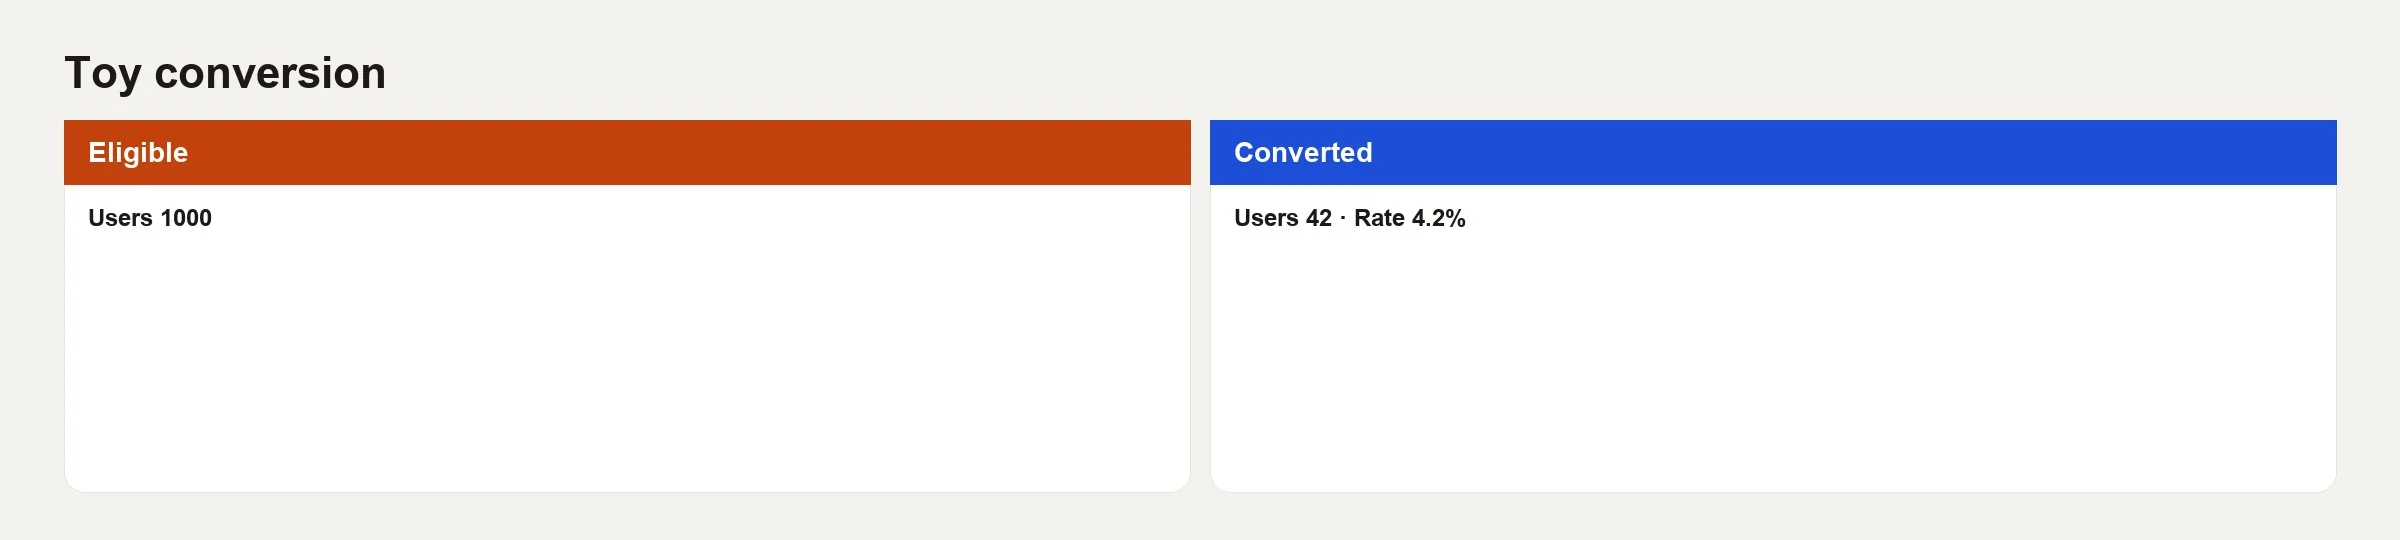
The rate is 42 / 1000 = 4.2%. That is the whole trick, and the arguments hide in the definitions behind 42 and 1000.
Here are three ways to fake a better number without doing any product work:
- Drop 200 “low intent” signups from the eligible group after seeing the results, so the denominator falls to 800 and the rate jumps to 5.25%.
- Extend the window to 45 days and count late payers without telling anyone.
- Count trial starts as “converted” while finance only counts payments after the trial.
And here are three ways the number can look worse by accident:
- Include incomplete windows, such as eligible users from yesterday in a 14-day metric.
- Double-count a user who pays, gets a refund, and pays again, counting them as two successes in one report and zero in another.
- Join billing on email while the product uses
user_id, which drops the matches that use two different emails.
Here is a SQL (the standard language for asking a database for data) sketch for the honest 4.2%:
-- Eligible: signups in cohort week, quality filters applied upstream
-- Success: first paid subscription within 14 days of signup
-- Report only when cohort_week_end + 14 days <= current_date

WITH eligible AS (
  SELECT user_id, signup_at
  FROM analytics.user_signups
  WHERE cohort_week = DATE '2026-09-29'
    AND is_employee = FALSE
    AND is_bot = FALSE
),
success AS (
  SELECT e.user_id
  FROM eligible e
  JOIN analytics.subscriptions s
    ON s.user_id = e.user_id
   AND s.first_paid_at >= e.signup_at
   AND s.first_paid_at < e.signup_at + INTERVAL '14' DAY
   AND s.counts_as_paid = TRUE
  GROUP BY 1
)
SELECT
  (SELECT COUNT(*) FROM eligible) AS eligible_users,
  (SELECT COUNT(*) FROM success) AS converted_users,
  1.0 * (SELECT COUNT(*) FROM success)
    / NULLIF((SELECT COUNT(*) FROM eligible), 0) AS conversion_rate;
This query finds the eligible signups for one week, leaving out employees and bots, then counts how many of them paid within 14 days and divides by the eligible count. The comment lines at the top state the rule, so a reviewer can check the query against it line by line.
If a model or an AI assistant wrote that query (a written request for data), re-check the interval bounds, the paid flag, and the employee filter. The tutorial on checking AI-written SQL is written for exactly this kind of failure, where the query looks right but the join is wrong.
Comparing conversion across channels and experiments
A comparison across channels needs the same eligible group and the same window for every channel. Paid search users may convert faster than organic ones, but that does not justify a 1-day window for paid and a 14-day window for organic on the same slide. If the lag differs, show both a short operating window and a mature window, each clearly labeled.
In an experiment, conversion is still a metric you have to protect. The earlier post on experimentation culture covered the habits: no peeking at results until the test ends, side metrics on revenue quality such as refunds, and a stopping rule written in advance. A lift in conversion that comes with a jump in refunds is not a win.
Micro conversions and vanity steps
Teams love in-between conversions, like a button click or a started checkout. They move more often. Use them as diagnostics, not as the only success measure for a revenue idea. Optimizing pop-up opens can even lower paid conversion if you train users to dismiss noise. Tie each small metric to the chain of stages from the earlier post on funnels so it has a job to do.
Uncertainty without a stats lecture
With 42 successes out of 1,000 eligible users, the rate is roughly 4.2%, but random noise is never zero. When the group is small, a one-point swing from week to week may be nothing but noise. For a board deck, prefer large, mature groups. Add confidence intervals, which show the range the true rate probably sits in, or at least put “N =” on the chart. You do not need a PhD. You just need to stop declaring war over 41 versus 42 successes.
A rule many teams use is to skip worrying about the third decimal place when N is small, and to worry about definitions drifting when N is large.
Definition card template
metric_name: signup_to_paid_14d
rate: converted_users / eligible_users
eligible: >
  users with account_created in cohort period,
  not employee, not bot, not purged
success: >
  first subscription with counts_as_paid
  and first_paid_at within 14 days of account_created
window: 14 days from eligibility timestamp
grain: user
mature_when: cohort_end + 14 days <= report_date
owner: growth_analytics
finance_aligned: yes (counts_as_paid flag shared)
version: 3
effective_from: 2026-07-01
This card defines the metric in one place: who counts as eligible, what counts as a success, the 14-day window, what one row means, when a group of signups is complete enough to report, and who owns it. Writing it this way stops two reports from quietly using two different definitions.
Common mistakes
- Denominator shopping after you have seen the results.
- Immature windows reported as final.
- Session rates labeled as user rates.
- Trial starts called “revenue conversion.”
- Mixed time zones, so “same day” means different things in the app and in the warehouse.
- Success events that fire twice, such as a double thank-you page, which inflate the top of the fraction.
- No version field when definitions change, so trends lie.
How to practice this week
- Pick one conversion metric on your dashboard (a screen of charts that tracks key numbers). Write down its rate, its eligible group, and its window in three bullets without looking at code.
- Open the SQL or the dashboard definition and compare it with your bullets. Note every mismatch.
- Recompute the most recent group of signups that has had its full waiting period, either by hand or with a small query, and see whether you match the dashboard within rounding.
- If you cannot match it, file a data quality issue before the next executive review.
- Add “N eligible” and “window mature?” notes to the chart subtitle, so readers know whether a gap is real or still filling in.
Quick recap
Conversion is success divided by eligible, inside a window. The percentage is the easy part. The real craft is in who is eligible, what unit you count, whether the window has matured, and whether you kept a version history. Toy numbers help here, because 42 / 1000 = 4.2% only means something when the 42 and the 1000 are well defined.
The next post in this series covers cohorts, so you can stop averaging brand-new users with veterans and calling the result “retention.”
Series notes
This is Part 2 of Customer analytics basics. The previous post covered funnel stages, and the next covers cohorts.
Sources
- Croll and Yoskovitz, Lean Analytics (input vs output metrics; conversion in context): https://leananalyticsbook.com/
- Kohavi et al. on metrics for online experiments (guardrails and definition care): https://www.cambridge.org/core/books/trustworthy-online-controlled-experiments/D97B26382EB0EB2DC2019A7ECBD9E84D
- Amplitude Docs on conversion and funnels: https://help.amplitude.com/hc/en-us/articles/230403928-Funnel-Analysis
- Mixpanel Docs on conversion windows and attribution settings: https://docs.mixpanel.com/docs/reports/funnels
- Google Analytics help on conversion paths and counting methods (platform-specific, still useful conceptually): https://support.google.com/analytics/answer/5963952
Keep going
Same lessons in your feed
Short diagrams, hooks, and weekly tutorials on Substack, Instagram, X, and Facebook.