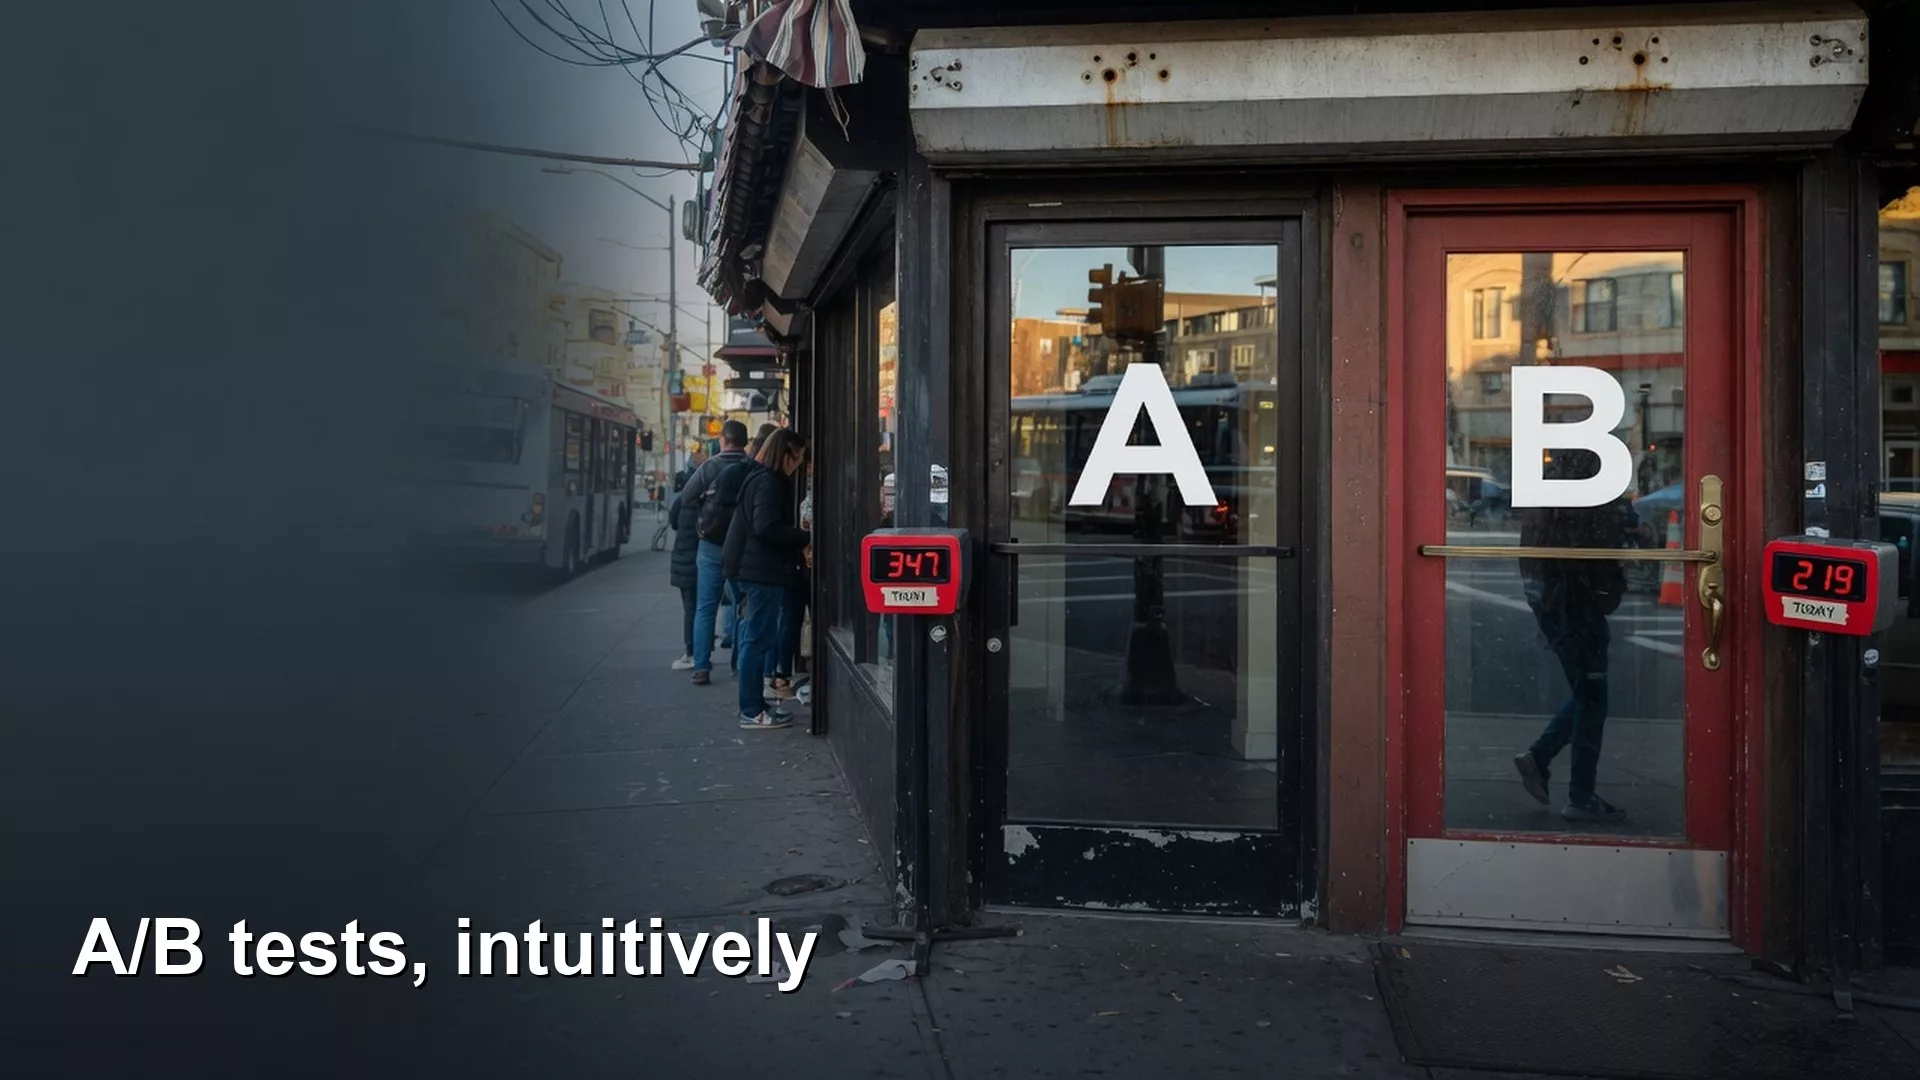
Before you trust a test that says your change worked, check three things: who was randomly assigned to each version, which single number the test was judged on, and whether anyone peeked at the results and stopped early. A green checkmark from your testing tool is not enough on its own.
Say your experiment tool shows a green checkmark, the lift (the improvement over the old version) reads +3.2%, and the p-value (a number that says how surprising the result would be if nothing had really changed) is 0.03. You are about to type “ship” in the team channel, and nobody has asked how the test was run.
A/B tests, which are also called online controlled experiments, are the cleanest way many product teams get causal evidence, meaning proof that a change caused a result. You randomly assign comparable units (people, accounts, or pages) to version A or version B, measure what happens, and estimate the effect of the change you made. That makes them powerful, and it also makes them easy to misuse when the team wants certainty faster than the sample can provide it.
The experiment in one paragraph
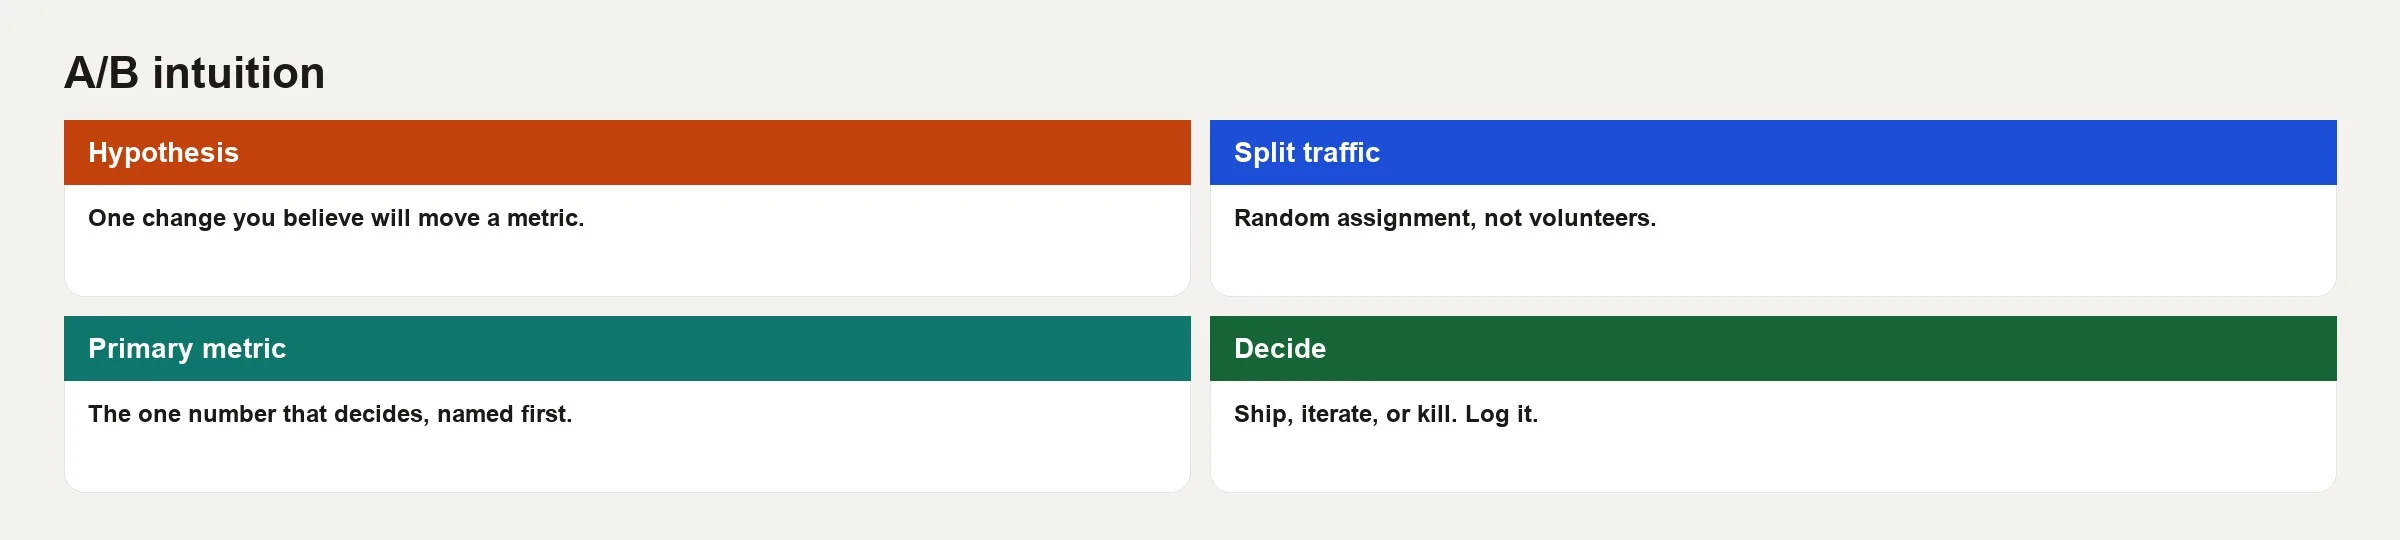
You pick a population that is eligible for a change. You randomly assign units (users, accounts, pages, or search queries) to a control group that sees the old version or a treatment group that sees the new one. You run the test long enough to collect a sample you planned in advance, or you use a special design that is built to be checked early. Then you compare outcomes on one main metric and check a few safety metrics for harm. Finally you decide whether to ship, try again, or drop the idea, based on how big the effect is and how uncertain it is.
Random assignment is the star of the show. On average, it spreads out both the differences you measured and the ones you did not (analysts call these confounders, meaning hidden causes that could fake an effect) evenly across the two versions. That is why a well-run A/B test can support cause-and-effect language that a dashboard (a screen of charts that tracks key numbers) segment cannot. Randomization still leaves problems behind, though. It cannot fix a main metric that does not match the business decision, a sample made only of power users, or early peeking without a plan.
Rule of thumb: Randomization evens out who lands in each group. It does not repair bad metric choices, broken logging, or a stopping rule you wrote after you liked the chart.
The unit of randomization is the choice that haunts you later
The unit is the thing you flip a coin for. If you randomize by page view but the same visitor sees both versions across visits, the experience becomes inconsistent and the comparison is spoiled. If you randomize by user but the decision is about account-level billing, two people at the same company may get different treatments, and the support team will hear about it. These are the common choices:
- User, cookie, or device: common in consumer product tests, though you need to watch for people who use several devices.
- Account or organization: common when you sell to businesses, because you get fewer units and slower tests but cleaner revenue metrics.
- Session: sometimes used, but risky if a shopping cart or what a person has learned carries over from one session to the next.
- Geographic or time-based switches: these are closer to a quasi-experiment than a classic A/B test, and they rest on different assumptions.
Your analysis has to respect the unit. If you randomized users but treat every click as an independent event, you will understate how uncertain the result is, as the earlier post on uncertainty explained. Try to make the randomization unit, the analysis unit, and the unit the decision is about the same thing.
Metrics: primary, secondary, guardrails
Pick one primary metric that would justify the change if it moved enough. Good examples are the checkout completion rate, activated accounts per signup, or weekly retained users. Write its definition the way the metrics series teaches: what you count on top, what you divide by, the time window, and what you leave out.
Secondary metrics explain how the primary metric moved, such as the steps in a funnel or the time to finish a task. They exist for learning, and they are not a license to keep searching until something looks like a victory.
Safety metrics (often called guardrails) catch harm. Examples are error rates, page load time, refund rate, unsubscribe rate, support tickets, and revenue per user if you optimized a stand-in for revenue. A win on the primary metric that trips one of these alarms is not a clean ship, because it means you now need a meeting about the tradeoff.
| Role | Job | Example |
|---|---|---|
| Primary | Decision metric | Purchase conversion among eligible users |
| Secondary | Mechanism / diagnosis | Add-to-cart rate, payment step completion |
| Guardrail | Do-no-harm | Checkout errors, refund rate, p95 latency |
Test size, and why the calendar should not decide it
Before you start, decide the smallest improvement that would actually change your mind. Testing experts call that the minimum detectable effect (MDE). To turn it into a plan, you also pick a power. That is the chance the test will catch a real lift of that size, often 80%. You also pick a false positive rate, which is how often you accept being fooled by luck, often 5%. If your business only cares about lifts of 5% relative or more, designing for a 0.5% lift wastes time. If you need to detect a 1% relative lift on a noisy metric, you need more units or a longer run than a two-week sprint calendar wants to give you.
Saying “we will run it for two weeks” without checking your traffic and your baseline rate is a method built on hope. What matters is how many units you collect, and the calendar is only a rough stand-in for that. A low-traffic business page may need months, while a change at the top of a busy consumer funnel may need only days. Do the sample size math or use your platform’s calculator before launch, and write the planned end condition down.
You can also plan to shrink the noise in your data when the method is available and appropriate. Options include CUPED (a technique that uses each person’s behavior before the test to sharpen the comparison), grouping similar users before randomizing, or choosing a sharper metric. These are advanced tools that come with their own assumptions. The first win for a beginner is simpler: do not stop early because Wednesday happened to look good.
Ways teams invent wins by accident
Peeking
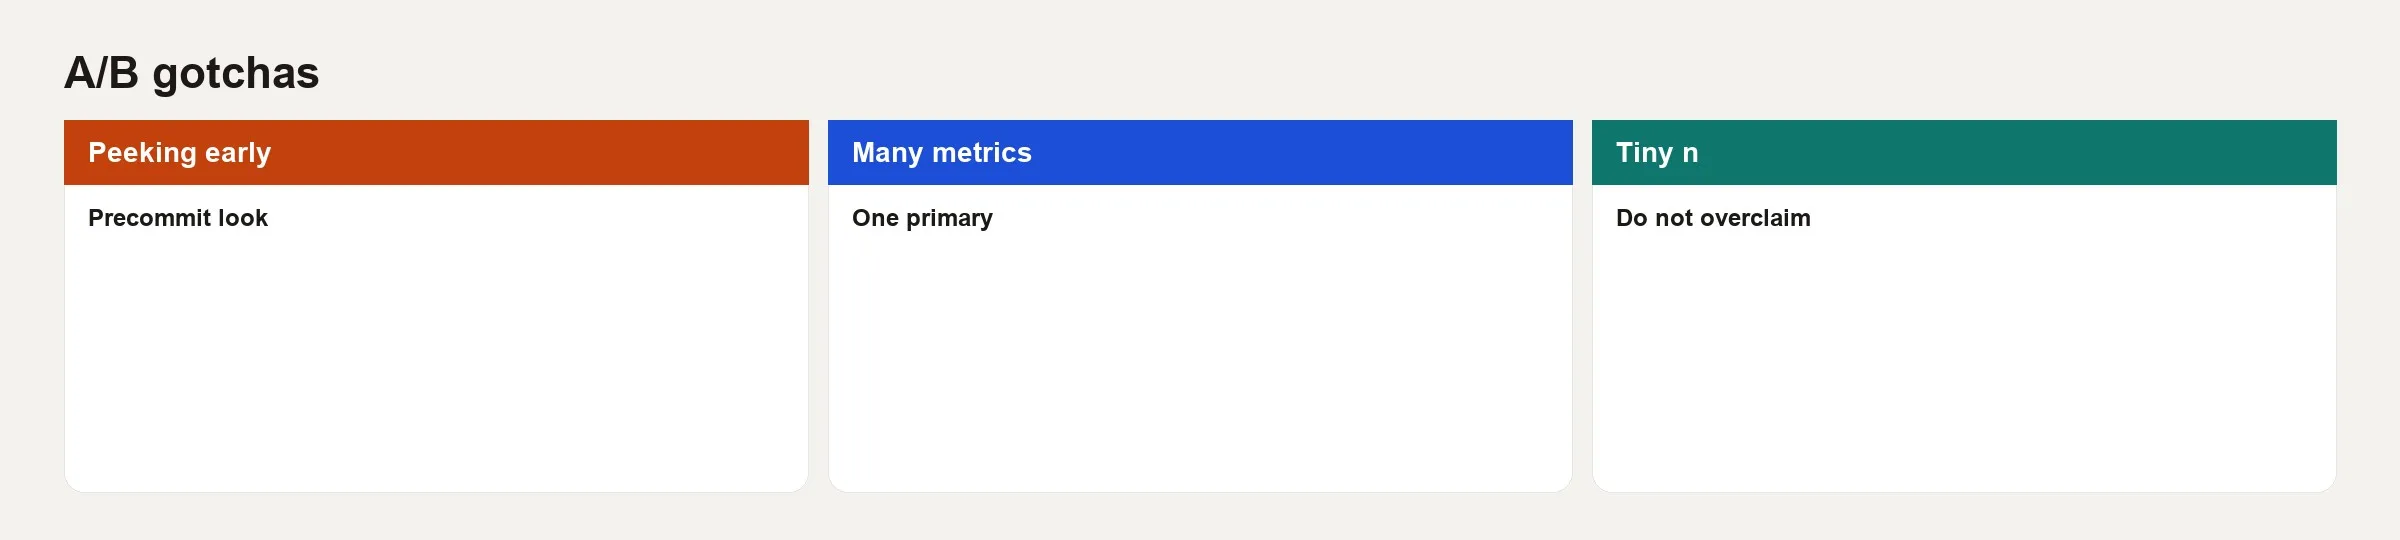
If you check the p-value every hour and stop the first time it drops below 0.05, you will get far more false positives than the 5% you signed up for. Special designs called sequential tests exist for people who want to monitor a test continuously. “We will look daily and stop whenever it is green” is not one of them, unless your platform’s method says it is. Prefer a test length you planned in advance, or use proper sequential stopping rules.
Many metrics and many slices
Twenty secondary metrics and fifteen country cuts will produce a few stars by pure chance. So name the primary metric before the test starts. Treat every slice as a hint to explore unless you planned for it in advance. Planning means you set aside part of your false positive budget, or you used a method built for many comparisons. If an exploratory slice looks huge, run a follow-up experiment aimed at that specific idea.
SRM and interaction bugs
A sample ratio mismatch (SRM) means the groups are not the size you planned. Suppose you expected a 50/50 split and got 47/53 across a very large sample. That is a quality alarm and not a curiosity, because bugs in how people are assigned, bot filters, and redirect errors can all cause strange results. Stop and debug before you start telling a story about the numbers.
Novelty and primacy
People may click a shiny new change just once, or they may resist a layout change for a week and then adapt. When the behavior is a habit, your test should run longer than a single day of novelty. For some changes, a long-run holdout, meaning a small group that keeps the old version for months, is the extra supervision your launch needs.
A worked example: testing checkout wording
Suppose you believe that clearer shipping cost wording on the payment step will raise the share of people who buy, without raising refunds. You write the plan down before launch. The population is logged-in users in the US and Canada who reach the payment step, and the unit is the user. The primary metric is a purchase within 24 hours of first seeing the payment step in the experiment. The safety metrics are the payment error rate and the refund rate within 7 days. The planned test length is whatever gives 80% power to detect a 2.0 point lift from a 10% baseline, a minimum effect you agreed on with stakeholders. Here is a toy readout at the planned end:
| Metric | Control | Treatment | Difference | Notes |
|---|---|---|---|---|
| Users | 18,400 | 18,220 | SRM check pass | Assignment near 50/50 |
| Purchase rate | 10.1% | 11.8% | +1.7 pts | Primary; interval excludes 0 in platform readout |
| Payment errors | 2.4% | 2.5% | +0.1 pts | Guardrail OK |
| 7-day refund rate | 1.1% | 1.0% | -0.1 pts | Guardrail OK |
| Mobile purchase rate | 8.0% | 8.2% | +0.2 pts | Exploratory slice; weak alone |
| Desktop purchase rate | 12.0% | 14.9% | +2.9 pts | Exploratory; drives most of lift |
Now comes the decision conversation. The main metric looks positive and the safety metrics are healthy, and most of the lift shows up on desktop in an exploratory cut. You have three sensible options. You can ship to everyone if the overall effect clears the business bar and mobile is not harmed. You can ship to desktop only if engineering can target it. Or you can run a short follow-up focused on mobile wording. What you should not do is declare that mobile users love it too based on a noisy +0.2 point slice, or restart the same test and stop at the first green hour.
A minimal analysis query
SELECT
  variant,
  COUNT(DISTINCT user_id) AS users,
  COUNT(DISTINCT CASE WHEN purchased = 1 THEN user_id END) AS buyers,
  ROUND(
    100.0 * COUNT(DISTINCT CASE WHEN purchased = 1 THEN user_id END)
      / COUNT(DISTINCT user_id),
    2
  ) AS purchase_rate_pct
FROM exp_checkout_copy_exposure e
LEFT JOIN exp_checkout_copy_outcomes o
  USING (user_id, variant)
WHERE e.first_exposed_at >= TIMESTAMP '2026-09-01'
  AND e.first_exposed_at <  TIMESTAMP '2026-09-22'
GROUP BY variant
ORDER BY variant;
This query counts, for each version of the test, how many people saw the page, how many of them bought, and the share who bought, as a percentage. It only counts people who first saw the page during the three test weeks, so late arrivals do not skew either version.
Pair this query (a written request for data) with SRM checks, safety metric queries, and your platform’s statistics engine. SQL alone is not a full sequential testing framework, but it is a good way to verify that the inputs are what you think they are.
When not to A/B test
Not every change deserves a test. Legal and safety fixes may simply need to ship, and brand-new pages may not have enough traffic. Some changes are so large that a control group stops being a meaningful version of the product. In those cases, a qualitative study or a staged rollout with monitoring may serve you better. An experiment costs engineering time, delays the benefit, and adds mental load for the team, so match the method to the risk, as the earlier post on sampling said about high-stakes decisions.
Common mistakes
- Stopping at the first green p-value without a plan for when to stop.
- Choosing the primary metric after seeing the results.
- Ignoring SRM and bugs in who actually saw the change.
- Randomizing one kind of unit and analyzing another without care.
- Declaring a universal truth from a narrow group of eligible users.
- Optimizing a vanity metric that conflicts with revenue or retention safety metrics.
- Running a test that is too small and then calling “no significant difference” proof that the two versions are equal.
How to practice
- Write a one-page plan for a made-up test: the population, the unit, the primary metric, the safety metrics, the smallest effect you care about, and the rule for when to stop. Practicing on a made-up test makes the real plan faster to write.
- Audit one past test. Was the primary metric chosen in advance? Did anyone peek? Was there a sample ratio mismatch?
- Use your platform’s calculator to estimate the sample size for a metric you care about, so you know how long a test must run before you start one.
- Add a decision table template to your team wiki, with three outcomes: ship, iterate, or kill, so the decision rule exists before anyone sees the results.
- Read the opening chapter of a trustworthy experimentation guide (see the sources below) and match its vocabulary to the labels in your own testing tool, so the words in your tool mean what the textbook means.
That wraps up the short statistics series for analysts. The next series is Experimentation culture, which starts with experiment design beyond the p-value, where process, ethics, and the quality of decisions take center stage. For more learning paths, visit Learn, and for related habits on defining numbers well, see the metrics series.
Quick recap
- A/B tests use random assignment, which lets you make cause-and-effect claims about the eligible population.
- Keep the randomization unit, the analysis unit, and the decision unit the same.
- Choose the primary metric, the safety metrics, and the stopping rule before the test starts, so nobody can steer the result after seeing the data.
- Size each test to a minimum effect that matches business value, and do not size it to fit a calendar.
- Peeking and slice fishing create fake wins, while a sample ratio mismatch points to broken plumbing.
- Decisions need the effect size and the risk, and a green p-value alone is not enough.
Your next step
Before your next experiment, write the randomization unit, the primary metric, the safety metrics, the minimum effect worth detecting, and the stopping rule, all on one page. Share it before the test starts. Committing to the plan first is what keeps the result honest when the numbers come in.
Series notes
This is Part 4 of Statistics for analysts. It closes the short arc that began with sampling, fair comparisons, and uncertainty.
Sources
- Kohavi, Tang, and Xu. Trustworthy Online Controlled Experiments: A Practical Guide to A/B Testing. https://experimentguide.com/.
- Microsoft exp-platform papers and guides on trustworthy experimentation (SRM, metrics, culture). Starting point: https://www.microsoft.com/en-us/research/group/experimentation-platform-exp/.
- Google “Overlapping experiment infrastructure” and related essays on large-scale experiments (historical context). Search via Google Research publications hub: https://research.google/pubs/.
- American Statistical Association statement on p-values (limits of significance language). https://www.amstat.org/asa/files/pdfs/p-valuestatement.pdf.
- OpenIntro Statistics. Hypothesis testing chapters for baseline vocabulary. https://www.openintro.org/book/os/.
Keep going
Same lessons in your feed
Short diagrams, hooks, and weekly tutorials on Substack, Instagram, X, and Facebook.