
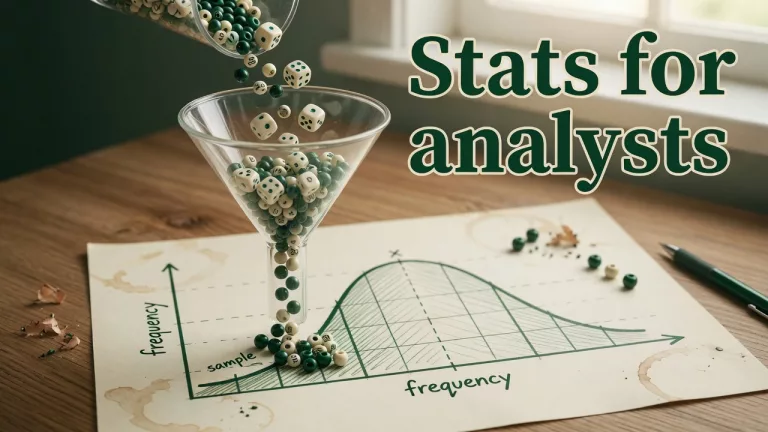
This path is for you if a stakeholder wants confidence and you do not want a math degree first. Parts cover sampling and bias, comparing groups without fooling yourself, uncertainty in plain English, and the intuition of an A/B test. Start with the first part on this page.
- 1 Sampling and bias for analysts Your sample is not “the data.” It is a story about who showed up, who got filtered out, and what bias you baked into the chart. Part 1 of Statistics for analysts shows how sampling choices quietly decide your conclusions.
- 2 How to compare customer groups without fooling yourself Compare groups with an apples-to-apples checklist: mix, baseline, and window. Mix shifts fool more roadmaps than bad SQL.
- 3 Uncertainty and confidence intervals explained in plain English Read point estimates with intervals. Confidence intervals show a range of plausible values under a model. Statistical significance is not business importance.
- 4 A/B tests intuition for analysts A/B tests need a clear unit, a primary metric, and honest peeking rules. A green checkmark with +3.2% lift can still be calendar-driven science if you stop early.