A metrics review meeting exists to make decisions about the things you can change and the results you care about, and it should never turn into a hunt for the right slide deck. Meet weekly to look at the levers, monthly to look at the outcomes, and give the meeting clear roles, a short pre-read, and a written decision log that lasts longer than the video call.
Say you join your team’s usual metrics meeting. It starts twelve minutes late because nobody can find the latest slides. The dashboard (a screen of charts that tracks key numbers) is down, so someone screenshots last week’s numbers instead. Forty minutes later, you cannot name a single decision the meeting made.
What the meeting is for
A good metrics review answers a small set of questions. It asks what changed that we care about, and whether we understand why well enough to act. It asks what we will do, stop, or continue, and what is blocked on data, people, or decisions outside the room.
The meeting is not the place for several other things. That includes live SQL (the standard language for asking a database for data) debugging as the main event, and a full status report from every team even when they have no stake in the metric. It also covers re-arguing definitions every week, which belongs in a separate working session. Public shaming of red numbers does not belong either, and neither do surprise new KPIs (key performance indicators, the numbers a team is judged on) dropped into the room without a written spec.
Think of the review as a decision factory that takes in a fixed set of inputs: a short scorecard, notes on what changed, proposed actions, and open issues. If no decision is possible because the data is wrong, the decision becomes “fix the data path by a set date.” It does not become forty-five minutes of talking about feelings.
Rule of thumb: If the meeting could have been a pre-read plus three Slack threads, it should have been. Use the room for trade-offs and commitments.
Cadence: weekly for levers, monthly for outcomes
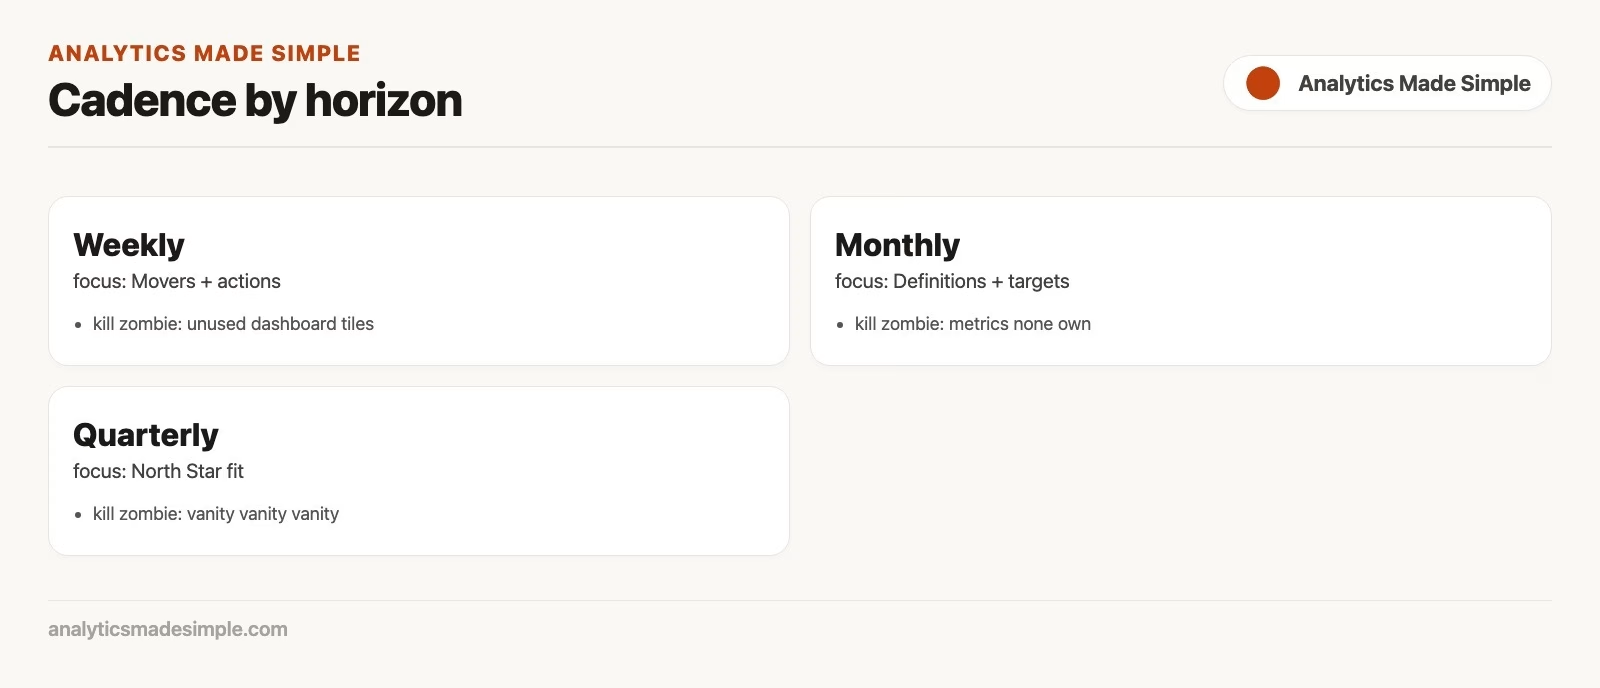
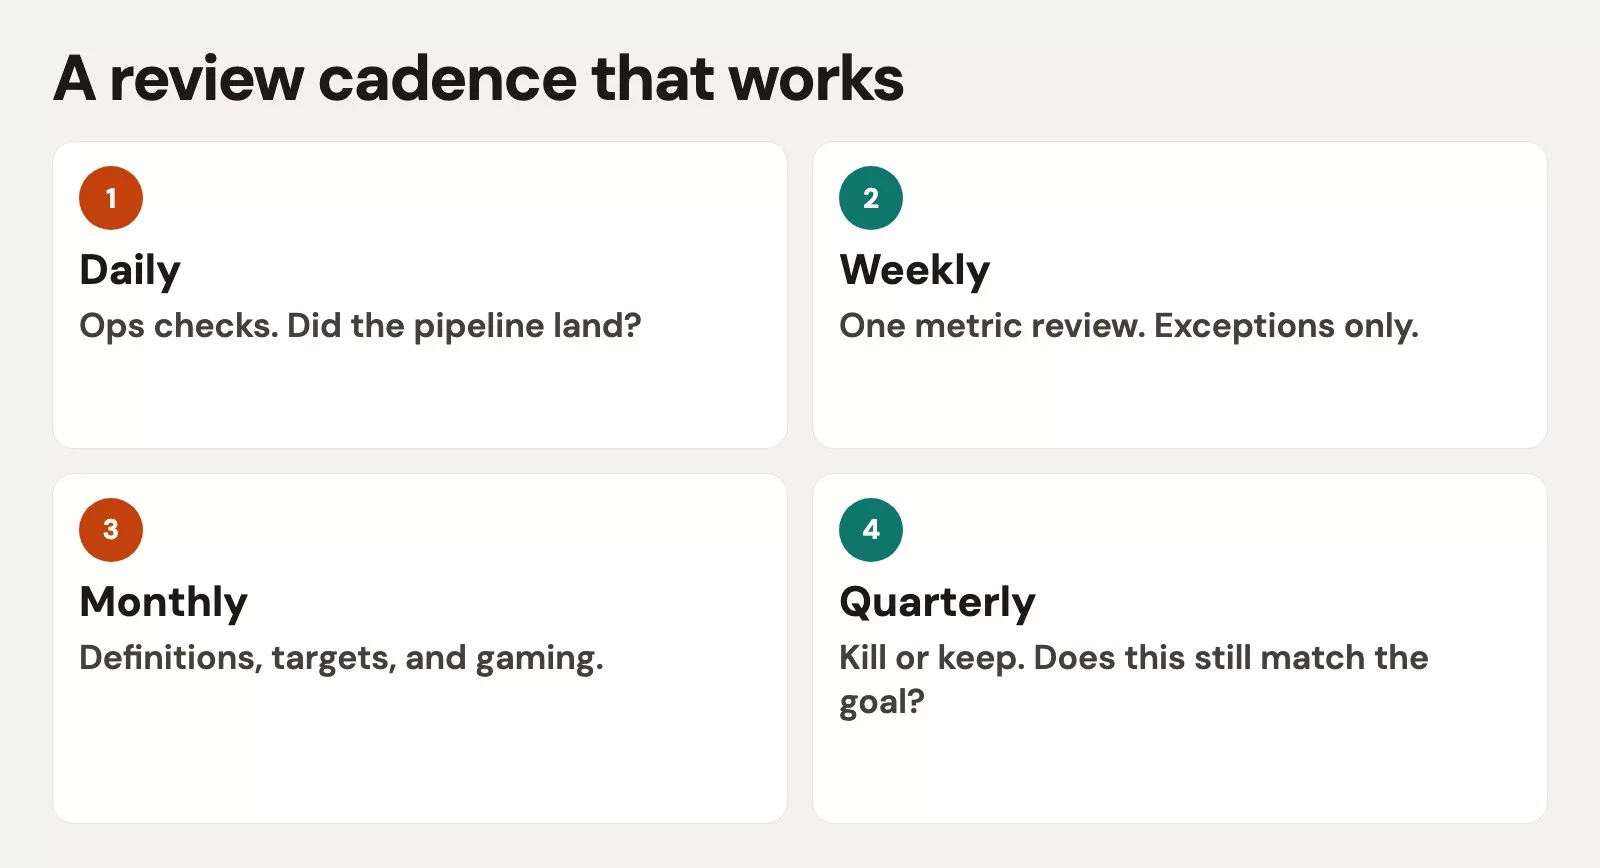
The earlier post on leading and lagging indicators split your metrics into the ones that predict results and the ones that report them. Your calendar should respect that split, so the meeting rhythm follows how quickly each kind of number can change. The diagram below shows a simple rhythm that many teams can adapt.
Weekly or biweekly operations review
| agenda_item | owner | artifact |
|---|---|---|
| 5m scoreboard | Facilitator | WAA + 3 inputs |
| 10m movers | Metric owners | Top up/down |
| 15m decisions | Team | Decision log |
| 5m actions | Facilitator | Owners + dates |
A weekly review should run 30 to 45 minutes if people read a pre-read first. Sixty minutes is only reasonable for a large, disciplined organization. The focus is on input metrics, safety limits, and active experiments. You ask what moved this week and what you will do next week, and you skip the long origin stories by pointing at the chart note and the owner.
The people in the room are the team that can change the levers this week, plus an analyst partner. Executives can attend as silent guests, unless a decision needs them.
Monthly business review
A monthly review runs 60 to 90 minutes with a hard stop. It covers the single top-line metric your company steers by (often called the North Star), the lagging outcomes, trade-offs across teams, and resource calls. This is where Sales, Product, Customer Success, and Finance share one scorecard stack, as described in the earlier post on team scorecards, instead of giving six separate monologues. Attendees are the leaders who own trade-offs, with analysts acting as navigators and not entertainers.
Quarterly reset
Once a quarter, freeze or update the metric specs and review incentives for a problem called Goodhart’s law, which says that once a number becomes a target, people start bending it. You also retire dead KPIs and check whether the North Star still matches your strategy. Do not invent a new star every quarter for fun. Change it when the product or market changes, and write down the reason.
Many organizations also run daily standups. Those are for coordinating work and are not a stage for the whole KPI scorecard, so bring the scorecard in only when a safety limit is on fire.
The meeting kit: roles, pre-read, and agenda
Roles
Five roles keep the hour honest. The facilitator owns the time, the agenda order, and the call to park a topic for later. That is often a chief of staff, an operations lead, or a rotating product manager, and it is not always the highest-paid person.
Metric owners speak to their own numbers, using the definitions from the earlier post on metric specs. They arrive with a story and a proposed action, and not a shrug. The analyst navigator makes sure the numbers match the published spec, flags quality issues early, and pulls extra detail only when someone asks.
The decision owner is the person who can approve a trade-off, and if they are absent, some agenda items should not be scheduled. Finally, the scribe writes decisions and owners in a log that people can see after the meeting, because memory is not a reliable record.
Pre-read, sent 24 hours ahead
A pre-read that works is short enough that busy people actually open it. It has five parts.
- A scorecard snapshot with the North Star, inputs, and safety limits, showing change from the last week (WoW) or the last month (MoM).
- Three bullets on what improved, what got worse, and what is unclear.
- Proposed decisions with options.
- Links to the specs and the live dashboard, and not a mystery export.
- Known data caveats in plain language.
If leaders will not read it, shrink it further. A meeting full of first-time chart discovery will always run long. Good chart habits help here: one idea per view, titles that state the claim, and notes on launches and outages.
An agenda that respects people’s attention
A reliable weekly skeleton runs about 40 minutes.
- From minute 0 to 5, confirm the scorecard loaded and flag any data quality holds.
- From minute 5 to 20, cover exceptions only, meaning metrics outside their normal band or surprise moves, along with owner stories and questions.
- From minute 20 to 35, make decisions and discuss trade-offs.
- From minute 35 to 40, recap the actions, owners, and dates.
- Optionally, use the last 5 minutes for one learning or experiment update, and not a second status meeting.
Green metrics that are on plan get silence or a one-line “on track,” and that is a feature. Celebrate in the monthly review or in team channels. Do not spend the weekly hour applauding every green tile while the red ones starve for time.
Decisions, not vibes: the log
Every review should leave a written trail. Here is a minimal decision log entry you can copy.
date: 2026-07-15
forum: weekly_ops
metric: activated_workspaces_14d
observation: -12% WoW; concentrated in self-serve SMB
decision: ship empty-state checklist; CS pilot for mid-tier (n=30)
owner: product_growth + cs_ops
due: 2026-07-29
success_signal: activation back to >=110/week OR learn doc if not
data_caveat: none (spec v3.2)
links: dashboard#activation, spec#activated_workspaces
The next meeting starts by glancing at the open items that are due, and that one habit turns metrics from commentary into operations. It also surfaces Goodhart problems early. If every “success” turns out to be a change of definition, you have a design problem and not a performance miracle.
Worked example: a two-tier rhythm at a software company
Say a company called Northwind Analytics Suite runs this kit for a quarter, using the team scorecards and anti-gaming rules from the earlier posts. The weekly operations review is 40 minutes on Tuesdays, and the monthly business review is 75 minutes on the first Thursday. The table shows how the same scorecard stack appears at each level.
| Element | Weekly ops | Monthly business review |
|---|---|---|
| North Star (active decision workspaces) | Glance only if off band | Primary outcome chart with context |
| Inputs (activation, completion, trusted data) | Main agenda if exception | Trend and driver story |
| Guardrails (churn, Sev-1, discount) | Hard stop if red | Trade-off discussion with GTM and Finance |
| Work metrics (cycle time, backlog) | Team-local; not default exec view | Only if blocking a strategic bet |
| Diagnostics | Opened live only for the exception under discussion | Appendix links; deep dives offline |
| Decisions | Ship, pause, staff a fix, escalate data bug | Budget, roadmap priority, incentive tweaks |
| Pre-read length | 1 page + scorecard | 3 to 5 pages max + scorecard |
| Success of the meeting | Clear owners for next 7 days | Clear owners for next 30 days + one trade-off resolved |
Here is a sample weekly pre-read paragraph that the team uses, because tone matters as much as structure.
“Activation missed target (96 vs 110). Completion and trusted data are fine, and there is no top-severity incident. We recommend shipping the empty-state checklist this week and starting the customer success pilot Friday. Open question for the room: do we pause the secondary experiment that competes for the same two engineers? Data quality note: none. Spec links are in the header.”
That pre-read invites a decision. A pre-read that only says “activation is down, see charts” invites a meandering autopsy instead.
Habits that keep the hour honest
Freeze definitions during the week
If someone discovers a bug, fix the pipeline (the automatic steps that load data), and do not silently change the formula mid-meeting so the story looks better. Log the version, recompute the number, and compare it with the old one. Trust is slower to rebuild than a dashboard tile.
Separate definition disputes
When two leaders disagree about filters, schedule a 30-minute working session with the analyst and the metric owner, and do not burn the full review on it. Bring the decision back to the next meeting as a one-slide change note.
Put quality on the agenda when it bites
If freshness, completeness, or a broken join threatens the scorecard, say so at minute one. A false green is worse than a delayed review. Link the problem to the data quality practices you already teach, such as knowing what one row means, validating your data, and never shipping a number you cannot rebuild.
Watch for Goodhart in the room
Listen for phrases like “we can make the number if we exclude…” or “just for this month.” Sometimes the exclusion is correct, such as a true outage. Other times it is gaming with a polite accent, so a good facilitator asks whether the exclusion matches the published spec and the customer’s reality.
End on commitments
A meeting with no commitments is just a podcast. Read back the owners and dates before people leave, and send the log within an hour while memory is still warm.
Tools: less theater, more system
You do not need a fancy operations platform on day one. You need four plain things.
- One living scorecard link, whether it is a business intelligence (BI) tool, a notebook (a document that mixes code and its results) with a refresh routine, or a well-owned Sheet with a documented source.
- Published metric specs, in a wiki, in dbt docs, or in Notion, wherever people will actually open them.
- A decision log, in the same wiki, a ticket system, or a shared document.
- Calendar holds that protect pre-read time.
If you build the scorecard in Python or SQL, keep the pipeline boring and tested. The Python for analytics series is useful when your meeting deck is really a fragile notebook. Prefer a scheduled job and a stable view over heroics the morning of the meeting.
Remote and hybrid teams can make cameras optional, but should not make muting optional. A shared cursor on one scorecard beats six people scrolling private tabs. Record the meeting only if it does not chill honest talk about red metrics.
Common mistakes
- Skipping the pre-read, which guarantees live discovery and overtime.
- Touring every tile, when an exceptions-only agenda is faster and kinder.
- Meeting at the wrong altitude, such as discussing annual net revenue retention (NRR) in a tactical standup or button clicks in a board prep, which wastes trust.
- Treating definition fights as sport, when you should park them, spec them, and version them.
- Having leaders who only appear when numbers are bad, which teaches people to hide variance.
- Leaving actions without owners or dates, which feels productive and changes nothing.
- Punishing red numbers without curiosity, which speeds up the gaming problems described in the earlier post on incentives.
- Skipping the earlier groundwork, since a meeting cannot fix a missing North Star, fuzzy specs, or a scorecard made only of lagging KPIs. Design comes first and ritual second.
Series recap: Metrics that matter
This series was built for managers and analysts who want KPIs that drive action without drowning the organization in noise. Here is the arc in one place.
From goal to metric: the chain
Every good metric follows a chain from objective to behavior to measure to target. Skip a link, and you get vanity numbers or targets nobody can influence. Always start with the decision and the human behavior you hope to change.
Leading and lagging indicators
Lagging metrics tell you whether you won, and leading metrics tell you whether you are about to. You need both, with clear time horizons, so your weekly work is not only a funeral for last quarter’s revenue.
Definitions and metric specs
A metric spec lists the owner, what one row means, the formula, the filters, and the caveats. A one-page template beats a tribal argument, because if two warehouses disagree, you do not have a metric. You have a rumor with a chart.
North Star versus team scorecards
One crown metric focuses attention, while team cards contribute to inputs, protect safety limits, and keep work metrics local. One number is too few when trade-offs and risk matter, and forty numbers are too many when nobody can recite the list.
Gaming, Goodhart, and unintended incentives
When a measure becomes a target, it stops being a neutral mirror. Pair your metrics, write down the loopholes, audit them, and treat incentives as co-authors of behavior. Campbell’s warning still applies: high-stakes indicators invite distortion.
Review cadence (this post)
Meet weekly for levers, monthly for outcomes, and quarterly for definition and incentive checks. Pre-reads, exceptions, decision logs, and roles turn the stack into an operating system. The meeting is not the metric. The meeting is how the organization learns and commits.
If you only remember four habits from the whole series, make them these.
- Chain every KPI to a goal and a behavior.
- Spec what you measure before you argue about the line.
- Stack the crown metric, inputs, safety limits, and local cards, and do not mirror one number everywhere.
- Review on a cadence that produces decisions, with incentives that do not reward empty optimization.
Where to go next on Analytics Made Simple: deepen problem framing in Analytics foundations, harden the pipelines behind the scorecard with Data quality, present the review without chart crime in Charts that make sense, and automate honest tables with Python for analytics. The Learn hub maps the rest.
Quick recap
- Metric meetings exist to notice change, understand it enough to act, and commit.
- Match the cadence to the altitude: weekly inputs, monthly outcomes, quarterly design checks.
- Use roles, pre-reads, exceptions-only agendas, and a decision log, so meeting time goes to decisions instead of reading numbers aloud.
- Protect definitions, surface data quality early, and watch for gaming language in the room.
- The series closes with a full stack: the chain, leading and lagging indicators, specs, a North Star system, anti-gaming design, and a rhythm that makes it real.
Ship one cleaner review this week, using the same metrics with a better operating system. That is how numbers earn trust over time.
How to practice this week
- Pick one recurring metrics meeting you already have, so the change fits into a habit that already exists.
- Write a one-page purpose statement that lists the questions it answers and the questions it will not.
- Introduce a pre-read deadline and an exceptions-only agenda for the next two sessions.
- Create a lightweight decision log and close the meeting by reading it aloud.
- After two cycles, cut 15 minutes from the invite if you are finishing early with clear actions, since a shorter meeting is a success measure for the ritual itself.
- If you are starting from zero, run a 30-minute weekly meeting with only three metrics from your team scorecard stack, and expand only when the habit is clean.
Series notes
This is Part 6 of Metrics that matter, and the close of the series.
Sources
Research and further reading used for this article:
- Atlassian Team Playbook, Page-Led Meetings: https://www.atlassian.com/team-playbook/plays/page-led-meeting.
- Atlassian Team Playbook, Inclusive Meetings: https://www.atlassian.com/team-playbook/plays/inclusive-meetings.
- Harvard Business Review, Stop the Meeting Madness: https://hbr.org/2017/07/stop-the-meeting-madness.
- Amplitude, About the North Star Framework (for tying product metrics into reviews): https://amplitude.com/books/north-star/about-north-star-framework.
- Wikipedia, Goodhart’s law (incentive awareness in reviews): https://en.wikipedia.org/wiki/Goodhart%27s_law.
- Stephen Few, Perceptual Edge library (dashboard and monitoring design for reviews): https://www.perceptualedge.com/library.php.
- Analytics Made Simple, Learn hub: https://analyticsmadesimple.com/learn/.
- Analytics Made Simple, Analytics foundations: https://analyticsmadesimple.com/series/analytics-foundations/.
- Analytics Made Simple, Data quality for people who ship numbers: https://analyticsmadesimple.com/series/data-quality/.
- Analytics Made Simple, Charts that make sense: https://analyticsmadesimple.com/series/data-viz/.
- Analytics Made Simple, Python for analytics: https://analyticsmadesimple.com/series/python/.
Keep going
Same lessons in your feed
Short diagrams, hooks, and weekly tutorials on Substack, Instagram, X, and Facebook.