Category: Analytics
This shelf is the job, not a tool manual. You are here if someone expects a number, a chart, or a “what should we do,” and the spreadsheet is starting to argue with itself. The articles cover the question before the query, a metric with a written definition, a chart that answers something, data that is fit to ship, and the messy middle of pipelines and stewardship.
It is not the SQL category. SQL is how you ask a table. Analytics is what you are trying to decide, and whether the number is even the right one. It is not the AI category either. A model can draft the email about the metric. It does not pick the metric.
Where to start: Analytics foundations if you do not yet have a clear question. Metrics if the team is arguing about a definition. Charts if the picture is pretty and the decision is still fuzzy. The SQL series when you are ready to ask the table yourself. Learn groups these as a track so you do not have to guess an order from a flat list.
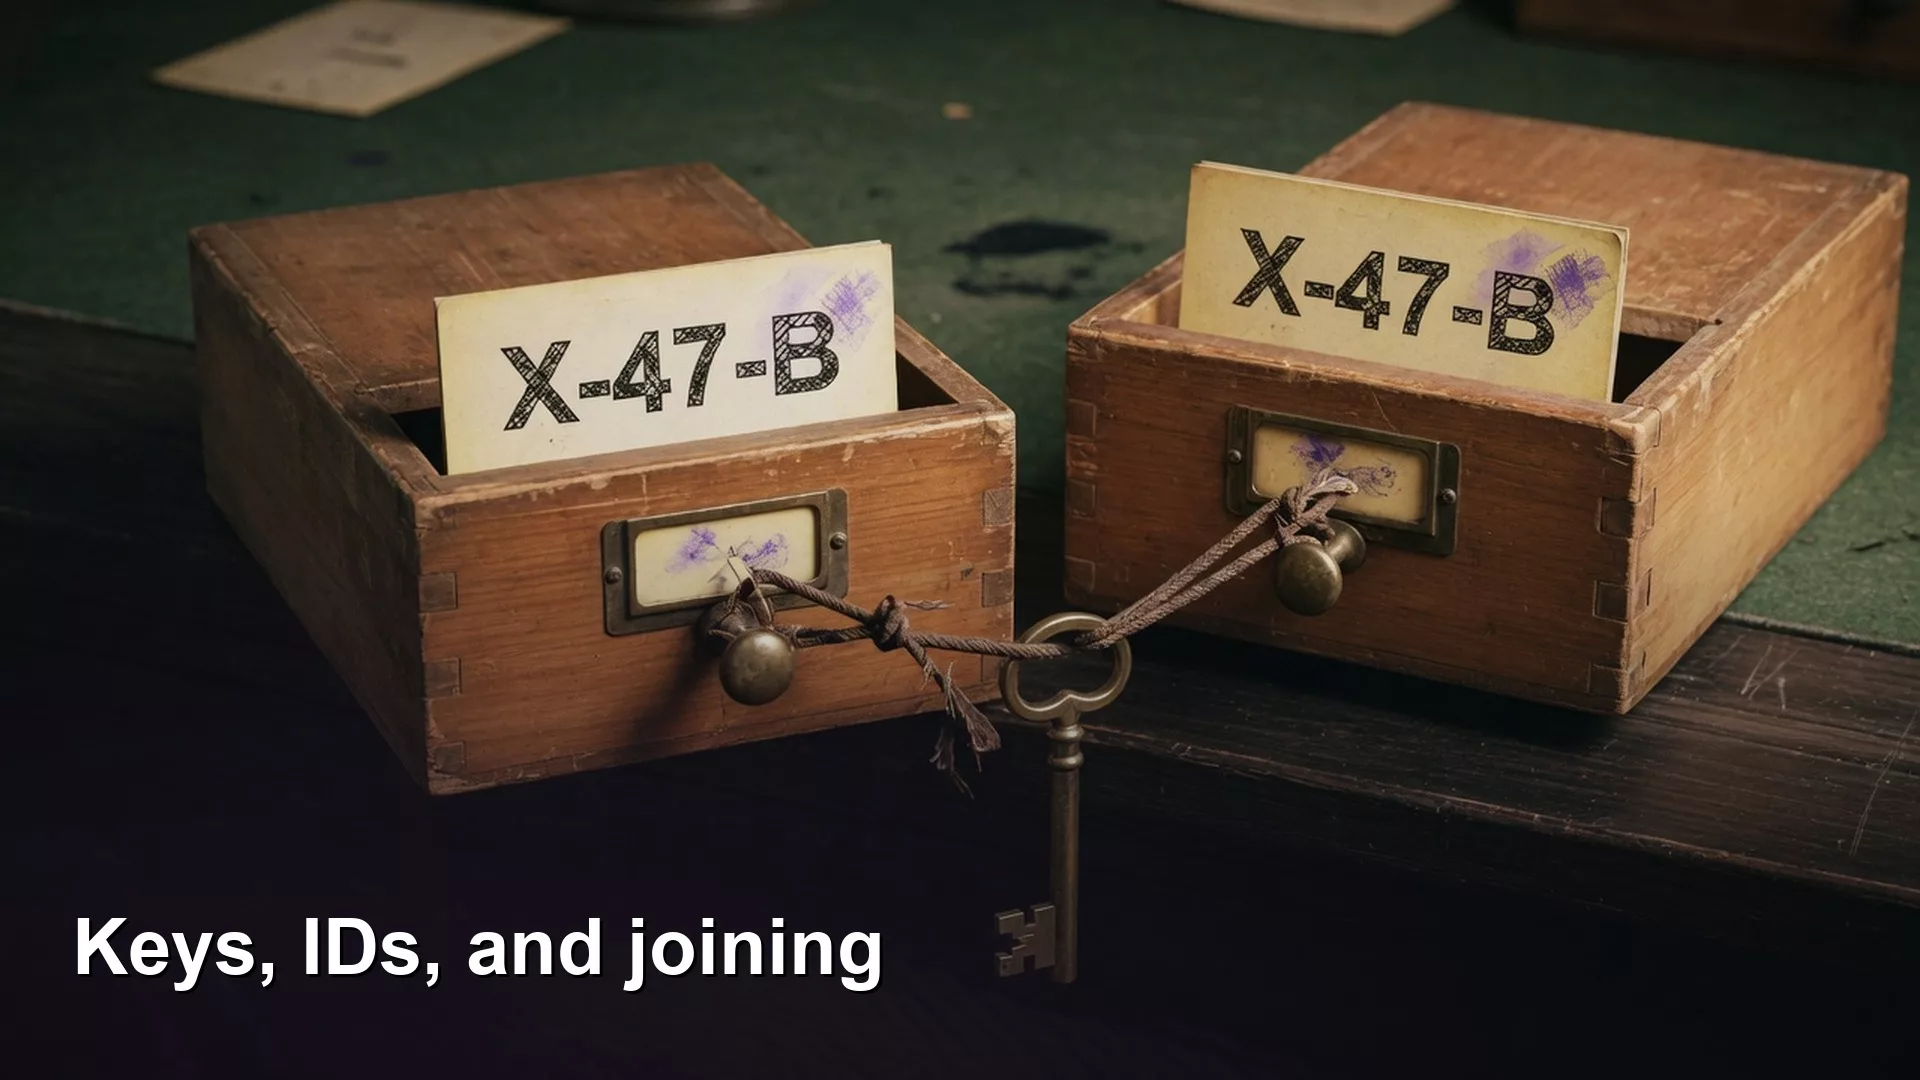
Keys, IDs, and joining in plain English
Why customer_id beats matching on names. Primary keys, foreign keys, one-to-many joins, and sheet habits that keep IDs stable.
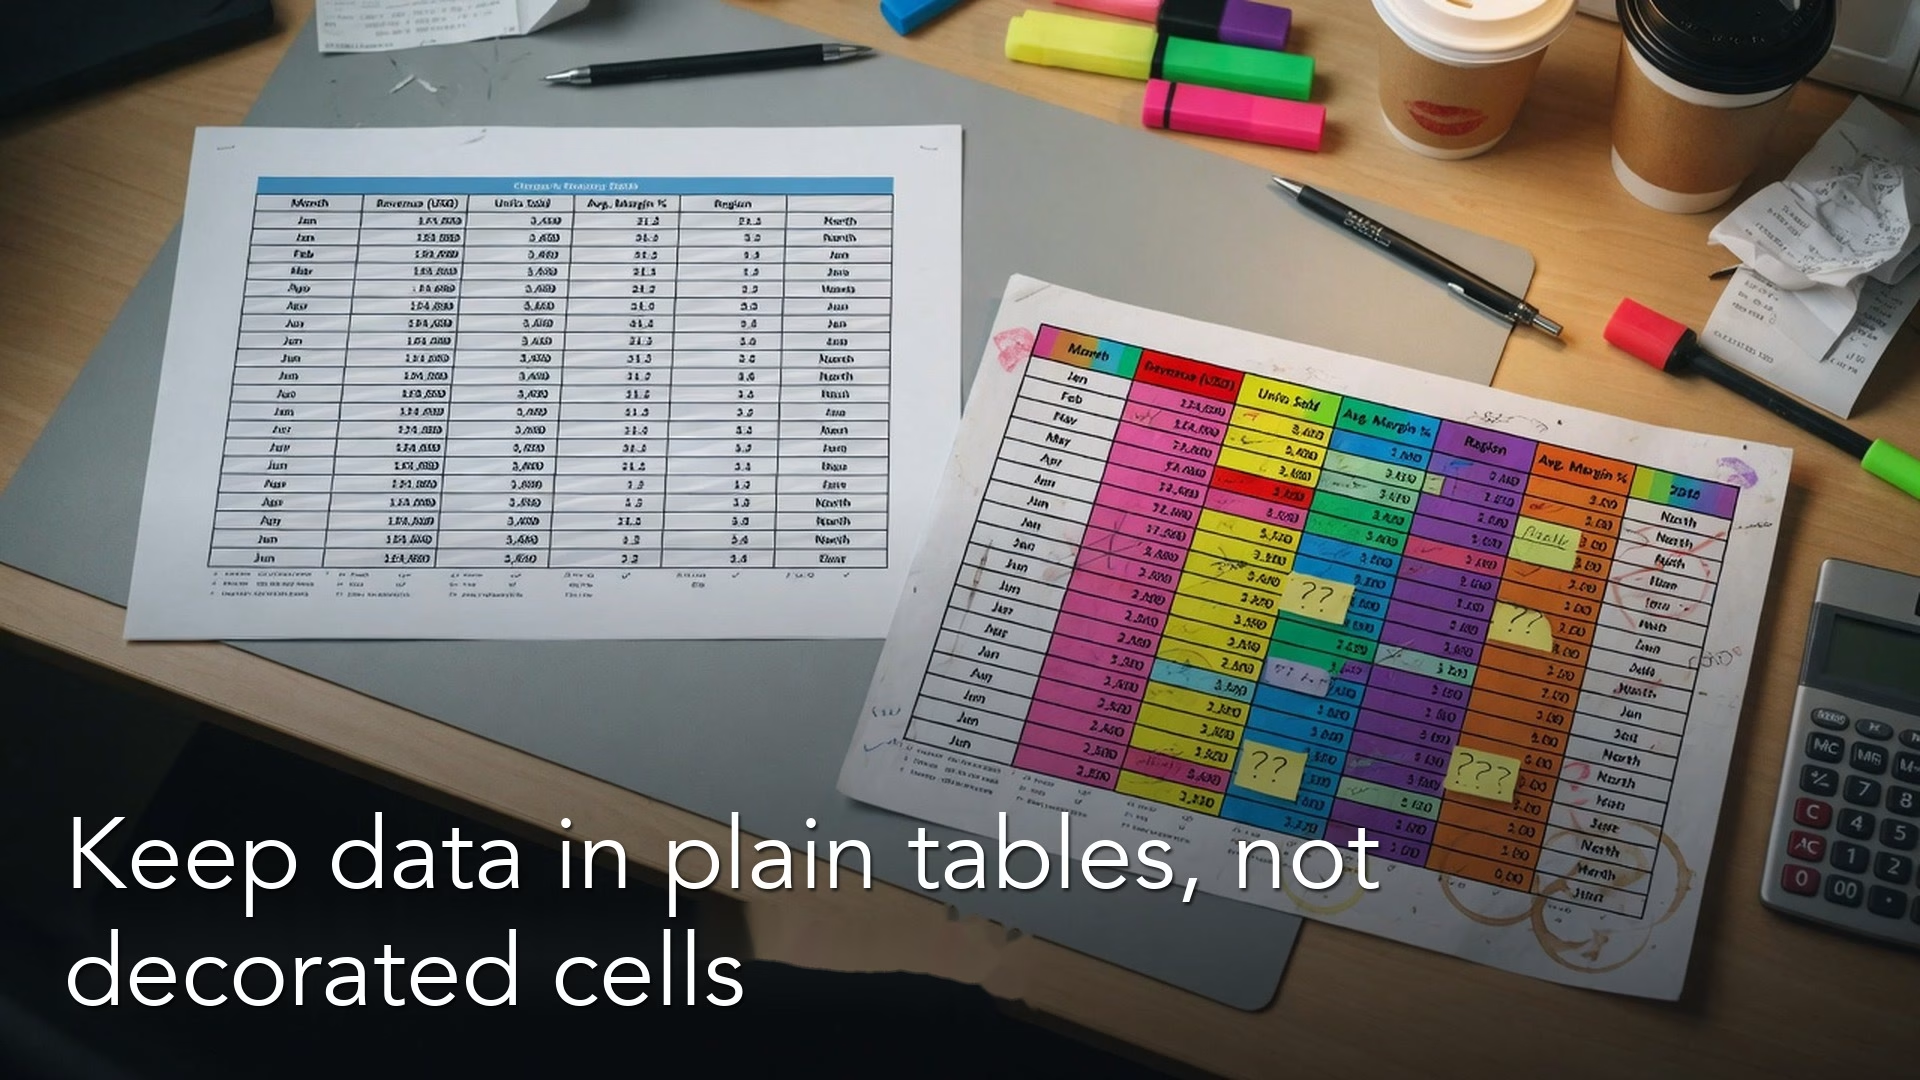
Keep spreadsheet data in plain tables, not decorated cells
Headers once, one value per cell, tidy vs wide. Turn pretty spreadsheet layouts into analysis tables that filter, join, and export without drama.
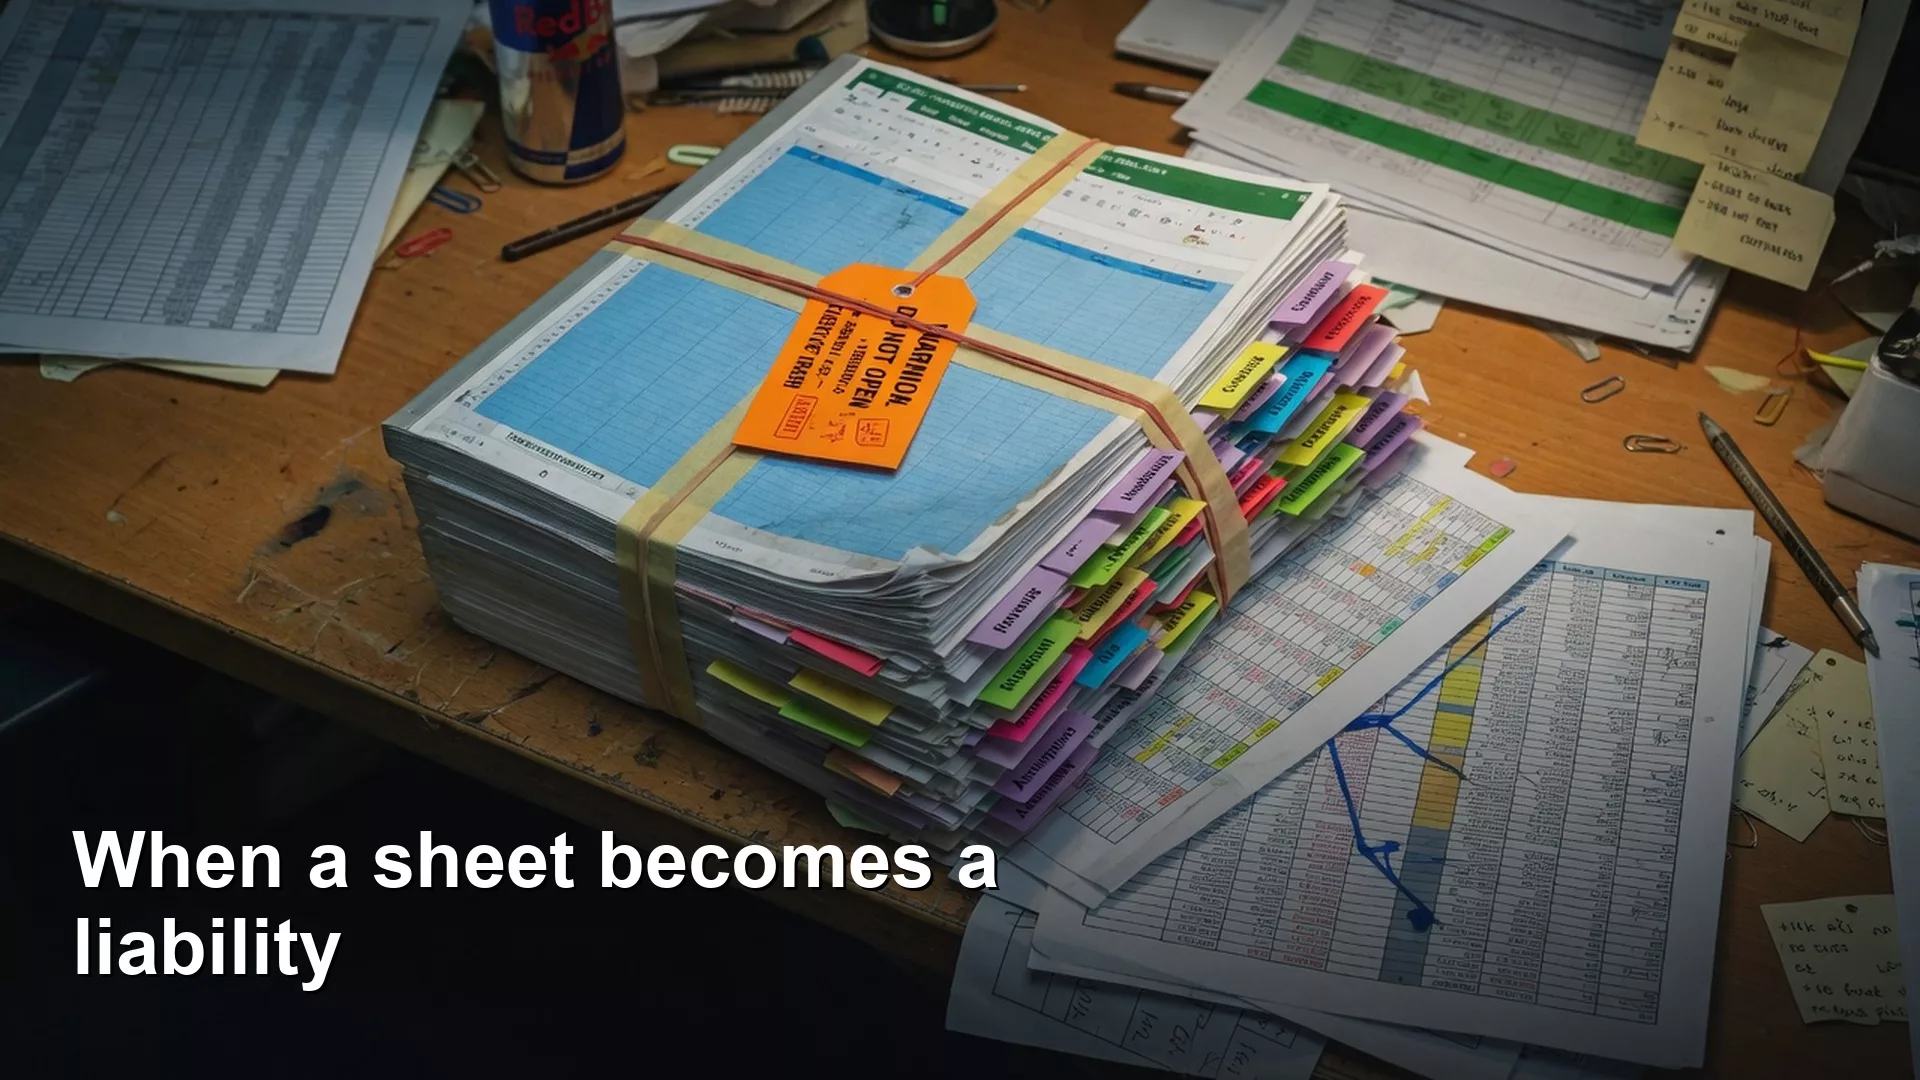
When a spreadsheet becomes a risk to your business
Spreadsheets start handy and can end as multiplayer systems of record with no owner. Learn the liability ladder, red flags, and Monday fixes before you trust a file…
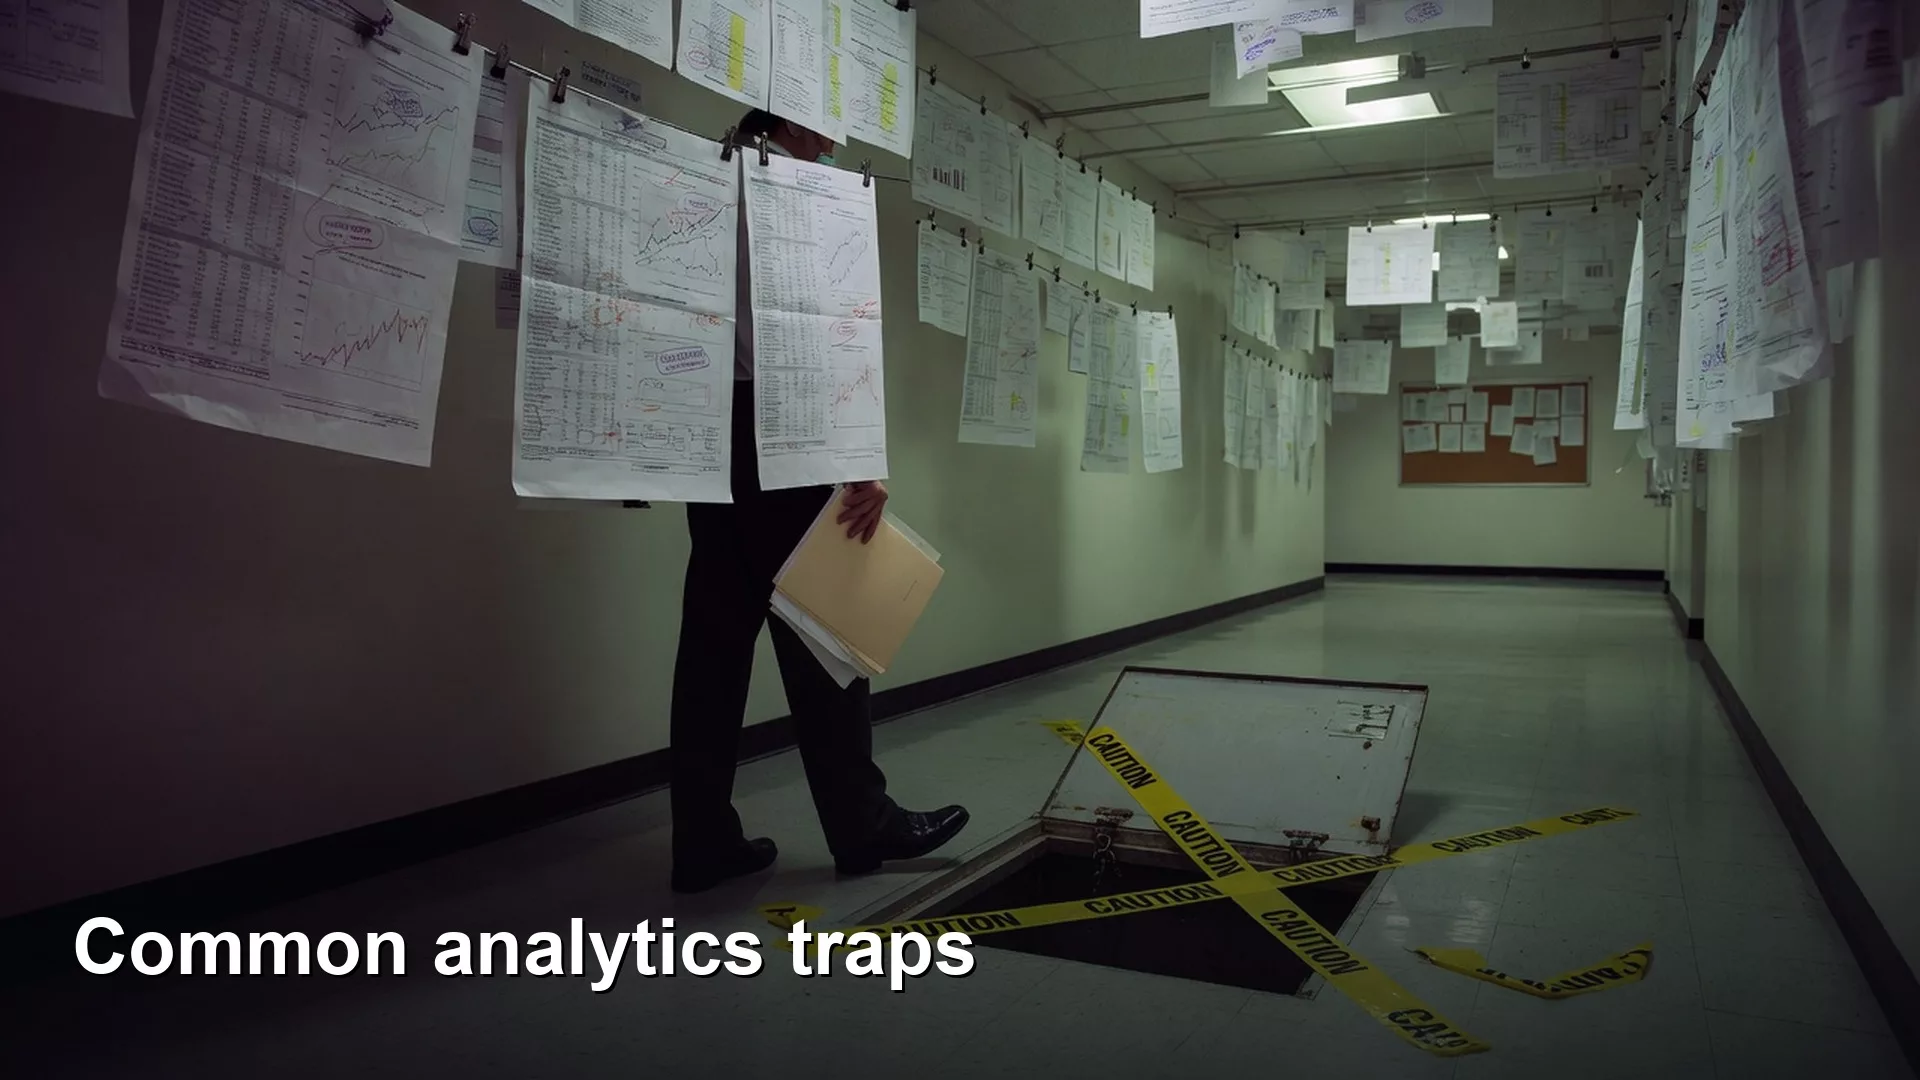
Common analytics traps
Survivorship, cherry-picking, averages of averages, wrong grain, and lonely numbers. Spot the traps that make clean charts support bad decisions.
How to write a one-page analytics brief
Stop starting with the warehouse. Use an eight-field one-page analytics brief to turn vague stakeholder asks into decision-ready work before you write a single query.