Before you pull any numbers, write a one-page brief that names the decision, the deadline, the exact question, and what a useful answer looks like. Say a coworker pings you: “Can you pull the numbers on churn for the board deck?” You open three systems, make up a definition under pressure, and ship a chart that answers a question nobody agreed on. The meeting argues about the number instead of the decision, and by evening another message asks for a different cut of the same thing.
This post is a practical companion to What problem are we actually solving? in Analytics foundations. You will leave with a one-page analytics brief you can paste into a ticket, a doc, or a sticky note, plus the scripts to get stakeholders to fill it without a fight.
Why a one-pager beats a kickoff meeting
| brief_line | example |
|---|---|
| Decision | Fund West? |
| Metric | Coverage x |
| Caveat | excludes holds |
Meetings feel responsible, and one-pagers feel bureaucratic, but in practice the opposite is true. A short written brief forces the hard parts into the open: who decides, by when, what “good” looks like, and what you will ignore. If you cannot finish the page, you do not have an analytics problem yet. You have a feeling that something should be measured.
The brief is not paperwork for its own sake. It is an agreement about what “clearer” means before anyone opens a query tool (a program for asking a database for data), because your job is to make a decision clearer, cheaper, or safer, and both sides need to agree on that target before you burn two days pulling data.
The one-page template
Copy this into Notion, Google Docs, Jira, or a paper notebook, and keep it to one screen. If it grows past one page, you are designing a research program, not a request.
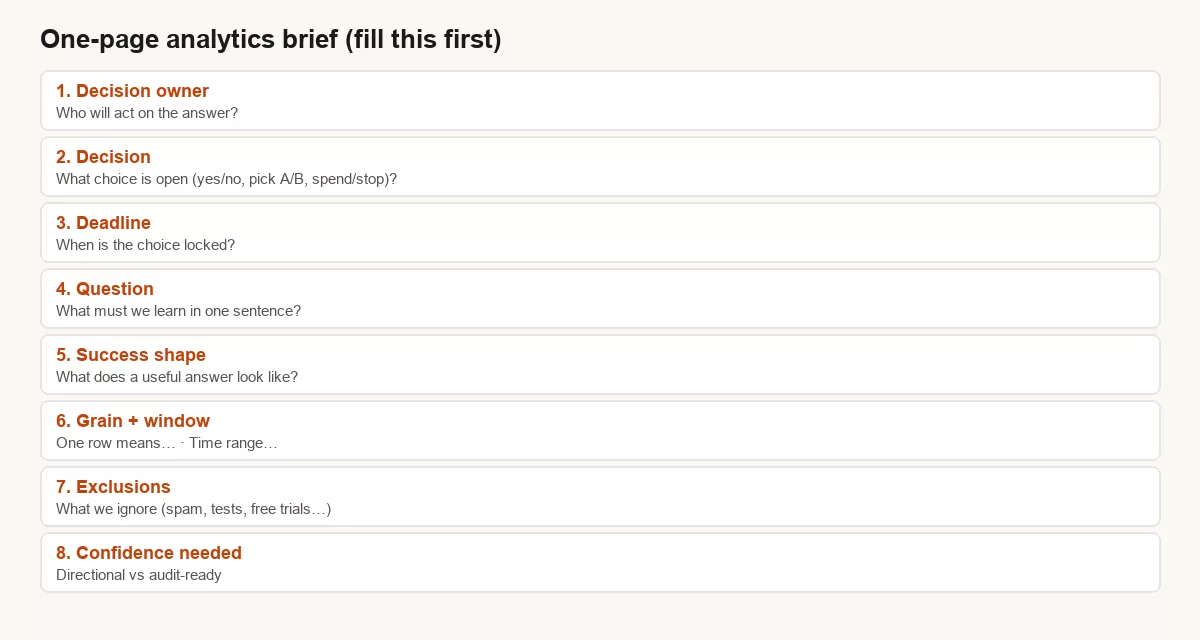
| Field | Prompt | Bad answer | Good enough answer |
|---|---|---|---|
| Decision owner | Who will act? | “Leadership” | “Head of Support” |
| Decision | What choice is open? | “Need visibility” | “Add night-shift coverage: yes/no” |
| Deadline | When is it locked? | “ASAP” | “Staffing meeting Tuesday morning” |
| Question | What must we learn? | “How are tickets?” | “Is after-hours ticket share rising faster than daytime?” |
| Success shape | What does useful look like? | “A dashboard” | “12-week trend + top 3 categories after 8 p.m.” |
| Grain + window | One row? Which dates? | “All data” | “One ticket · last 12 complete weeks” |
| Exclusions | What to ignore? | (blank) | “Spam, internal tests, auto-closed bots” |
| Confidence | How solid? | “100% accurate” | “Directional OK for Tuesday; hard numbers next month” |
Field by field, in plain English
1. Decision owner
Name a human, not a committee. If three people must agree, list the final caller and the people they will consult separately, because analysis without a named owner becomes decoration nobody acts on.
2. Decision
Write the choice as options: “Fund redesign / don’t,” “Prioritize segment A vs B,” “Fix the data loading steps this sprint / next.” If there is no real choice on the table, you may be doing curiosity work, which is fine, but label it that way and put a time limit on it.
3. Deadline
Two clocks matter here: the decision clock and the analysis clock. Always anchor to the decision, because “need a first look by Monday so we can decide Thursday” is healthier than “need everything by Monday” with no plan for what happens after.
4. Question
Write one sentence, and prefer a question you could in theory prove wrong. “Is after-hours share up more than 2 points versus last quarter?” beats “Tell me about tickets,” because the second one has no way to fail.
5. Success shape
Describe the deliverable shape, not the tool: a ranked list, a before/after with caveats, a forecast versus a target, or a single metric with a range. “A Tableau” is not a success shape. “A ranking of territories by cancel rate with revenue at risk” is.
6. Grain and window
Grain means what one row represents: one order, one customer-day, one ticket. Get the grain wrong and you create fake trends without meaning to. Window means which dates count, which time zone, and how much lag to expect. If you cannot finish these two lines, stop, because this is where most “the numbers don’t match” fights begin.
7. Exclusions
Write the boring filters: test accounts, refunds, free trials, internal employees, bot traffic. Leave them unwritten and two honest analysts will quietly build two honest, different answers.
8. Confidence needed
Borrow language from Good enough vs perfect data: directional, good enough with caveats, or high trust. Match the confidence level to how reversible the decision is, because a test you can undo next week does not need the same rigor as a number that goes in front of the board.
The five-minute intake (when they are in a hurry)
You will not always get a filled form, so run this out loud and type as you go:
- “What will you do differently if the answer is A vs B?”
- “When is that choice locked?”
- “Who else must trust this number?”
- “What does a good enough answer look like if perfect data is impossible this week?”
- “What should we deliberately ignore?”
If they cannot answer question one, you are not late on analysis. You are early on product management, so offer to help name the decision first, then schedule the data work once that is settled.
Worked example: three briefs from one vague ask
| section | one_line |
|---|---|
| Decision | Hire 2 support in West? |
| Question | Is coverage below plan? |
| Metric | Pipeline coverage (x) |
| Grain | open opps / quota by region |
| Caveats | excludes pending legal holds |
| Next step | West discovery blitz 3 weeks |
Take the vague ask “How are sales?” It can turn into three possible briefs from the same warehouse, and each one means completely different work.
| Brief focus | Decision | Success shape | Wrong path |
|---|---|---|---|
| Hit the quarter? | Pull forward a promotion: yes/no | Forecast vs target + assumptions | 5-year SKU archaeology |
| Which territory lags? | Where coaching time goes | Ranked territories, fair normalization | One company average |
| Did the site redesign help? | Keep new layout: yes/no | Before/after window + caveats | Live dashboard with no comparison |
Writing the brief is how you discover which of these three worlds you are in before you open a SQL (the standard language for asking a database for data) client and start pulling rows nobody asked for.
Copy-paste blank (text version)
ANALYTICS BRIEF (1 page)
Owner: _______________
Decision (options): _______________
Deadline: _______________
Question (1 sentence): _______________
Success shape: _______________
Grain (one row = ): _______________
Time window + lag: _______________
Exclusions: _______________
Confidence needed: directional / good enough / high trust
Risk if wrong: _______________
Out of scope (explicit): _______________
Next check-in: _______________
How the brief feeds the analytics loop
In The analytics loop, you move question to data to transform to answer to decision to measure again. The brief is the entrance ticket to that loop, and it also sets up better numbers reading later on: rates versus counts and baselines from Reading a number like an adult only matter once the question is sharp.
Common mistakes with briefs
- Filling the template alone and never confirming with the owner
- Writing “build a dashboard” as the decision, when a dashboard (a screen of charts that tracks key numbers) is a tool, not a choice
- Skipping grain because “we all know what an order is” (you do not)
- Demanding high trust for a reversible test
- Leaving exclusions blank, then arguing about them in the results meeting
When the stakeholder pushes back on process
You will hear “we do not have time for a form,” and it is worth translating that honestly. Sometimes they mean the decision is on fire. Sometimes they mean they have not thought about the decision yet and hope the data will invent one for them. Your job is not to be difficult. Your job is to protect both of you from redoing the work later.
Try this script: “I can start pulling in ten minutes. I just need four answers so I do not pull the wrong thing: who decides, what the options are, when it locks, and what a good enough answer looks like. If we skip that, we usually redo the work after the meeting.” Most stakeholders will fill four fields once they hear the alternative is redoing everything. You can draft and confirm the rest of the brief later.
If they still refuse, document the refusal in one line on the brief: “Owner declined to specify decision; treating as exploratory, two-hour cap.” That sentence is not passive-aggressive. It is scope control. Curiosity projects are allowed. Unbounded mystery work dressed up as a board deliverable is not.
From brief to first query without losing the plot
Once the page is full, your first technical moves should be boring on purpose. Confirm the table and grain exist, or note that they do not. Write the exclusion filters as comments in SQL or as a checklist in the notebook. Produce only the success shape you agreed on, whether that is a ranking, a trend, or a before/after, instead of twelve extra tabs nobody asked for. Attach the brief to the deliverable so the room cannot forget the decision it was supposed to support.
-- Brief: after-hours ticket share, last 12 complete weeks
-- Grain: one support ticket
-- Decision: night-shift coverage yes/no (owner: Head of Support)
-- Exclusions: spam, internal test accounts
SELECT
  DATE_TRUNC('week', created_at) AS week_start,
  COUNT(*) FILTER (WHERE EXTRACT(HOUR FROM created_at) >= 20) AS after_hours,
  COUNT(*) AS all_tickets,
  ROUND(
    100.0 * COUNT(*) FILTER (WHERE EXTRACT(HOUR FROM created_at) >= 20)
      / NULLIF(COUNT(*), 0),
    1
  ) AS after_hours_pct
FROM support.tickets
WHERE created_at >= CURRENT_DATE - INTERVAL '12 weeks'
  AND is_spam = false
  AND is_internal_test = false
GROUP BY 1
ORDER BY 1;
This query counts, for each week, the support tickets created at 8 p.m. or later, all tickets, and the after-hours share as a percentage. The comment lines on top repeat the brief, so anyone reading the query knows the question, the rules, and who decides.
Notice how much of the query is comments that came straight from the brief. That is the point: the brief becomes documentation that travels with the code, not a sticky note you lose the week after. Teams that insist on briefs tend to ship fewer charts and more decisions over a quarter, and that is the only scoreboard that matters for an analytics function that wants to keep its reputation.
Team habits that make the template stick
Put a blank brief link in your team wiki and in the analytics request form. Refuse priority labels without a decision deadline attached. Review one shipped analysis per month and ask two questions: did the decision change, and was the brief accurate? Celebrate shorter scopes. “We killed a vague ask in twelve minutes” is a win, not a failure to be helpful. The template only works if the social contract around it is real.
Quick recap
A one-page analytics brief turns fuzzy asks into decision-ready work. Name the owner, the choice, the deadline, the question, the success shape, the grain, the exclusions, and the confidence. If the page will not fill, do not open the warehouse yet. Talk first, then query.
Related: the foundations series, All About KPIs (key performance indicators, the numbers a team is judged on), and the traps companion post if you want a short list of ways clean numbers still mislead.
How to practice this week
- Take the last three analysis requests you got. Retroactively fill the brief and notice where the blanks are.
- Pick one upcoming ask, so the practice improves real work instead of a hypothetical. Fill the brief with the stakeholder in five minutes.
- Save a blank brief as a team template. Put the link in your Slack status if you are brave.
- After you deliver, write one line: “Did the decision change?” That is your quality score.
Sources
- Hubbard, Douglas W. How to Measure Anything (measurement as reducing uncertainty for decisions): https://www.howtomeasureanything.com/
- Analytics Made Simple, Analytics foundations (problem framing, loop, good enough data, reading numbers)
- DAMA-DMBOK concepts of data ownership and definition (why “who owns the metric” belongs on the brief): https://www.dama.org/cpages/body-of-knowledge
Keep going
Same lessons in your feed
Short diagrams, hooks, and weekly tutorials on Substack, Instagram, X, and Facebook.