Category: Analytics
This shelf is the job, not a tool manual. You are here if someone expects a number, a chart, or a “what should we do,” and the spreadsheet is starting to argue with itself. The articles cover the question before the query, a metric with a written definition, a chart that answers something, data that is fit to ship, and the messy middle of pipelines and stewardship.
It is not the SQL category. SQL is how you ask a table. Analytics is what you are trying to decide, and whether the number is even the right one. It is not the AI category either. A model can draft the email about the metric. It does not pick the metric.
Where to start: Analytics foundations if you do not yet have a clear question. Metrics if the team is arguing about a definition. Charts if the picture is pretty and the decision is still fuzzy. The SQL series when you are ready to ask the table yourself. Learn groups these as a track so you do not have to guess an order from a flat list.
- 9 min read
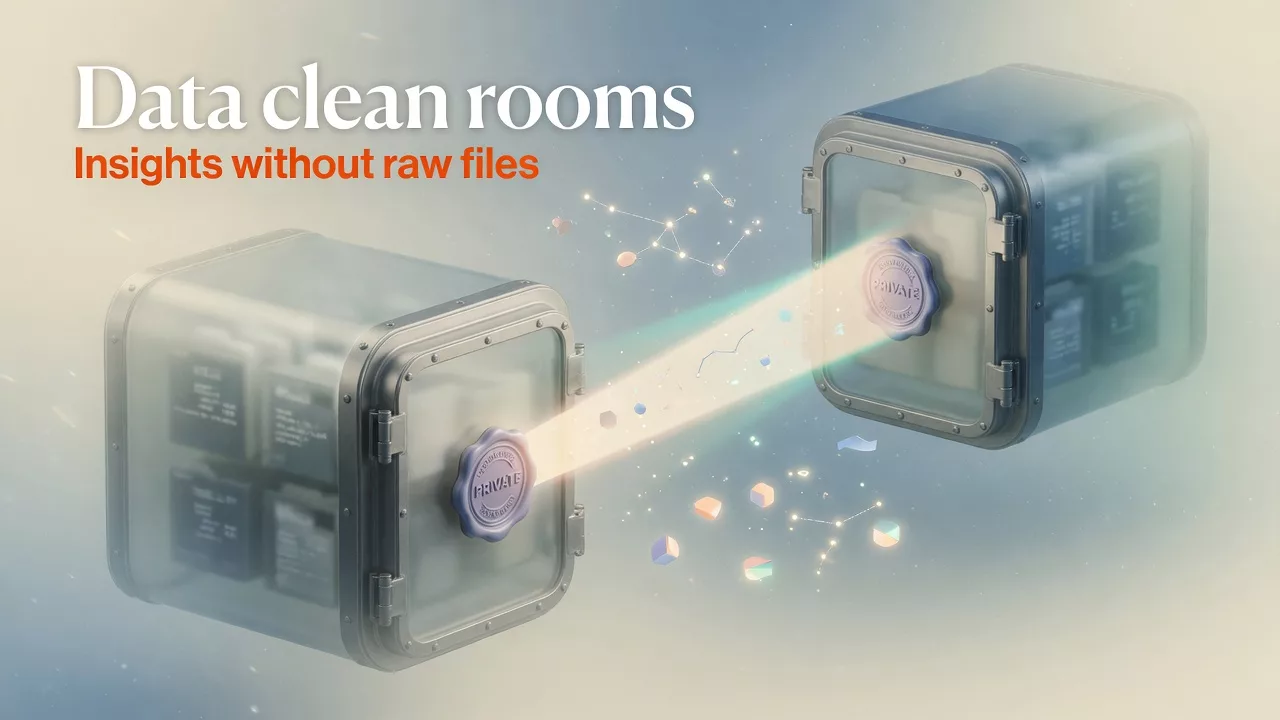
What is a data clean room? How companies share insights without sharing raw data
Partners want overlap metrics. Nobody should email a customer CSV “just this once.” Data clean rooms let parties compute under rules and return aggregates. Learn when they help,…
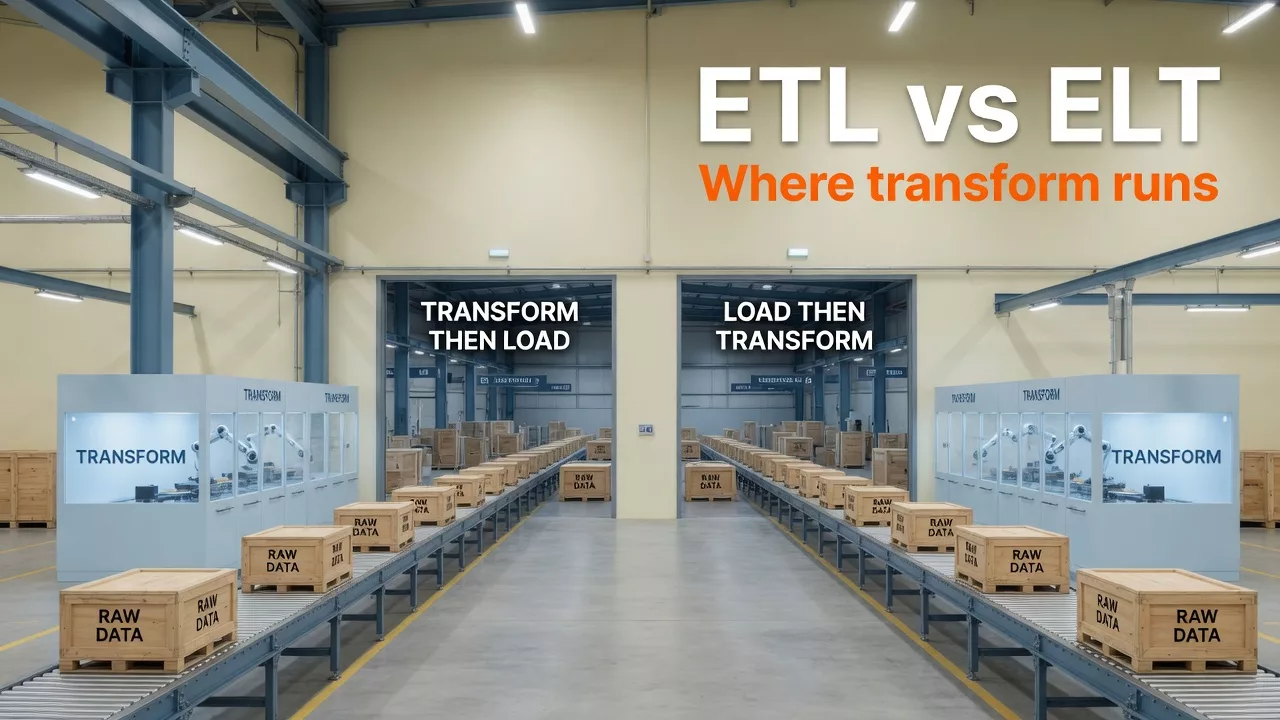
ETL vs ELT: the two ways to move and clean data, explained
ETL shapes data before load; ELT loads then transforms in the warehouse. Plain comparison, CDC and cousins, best practices, and a checklist for modern stacks.
- 6 min read
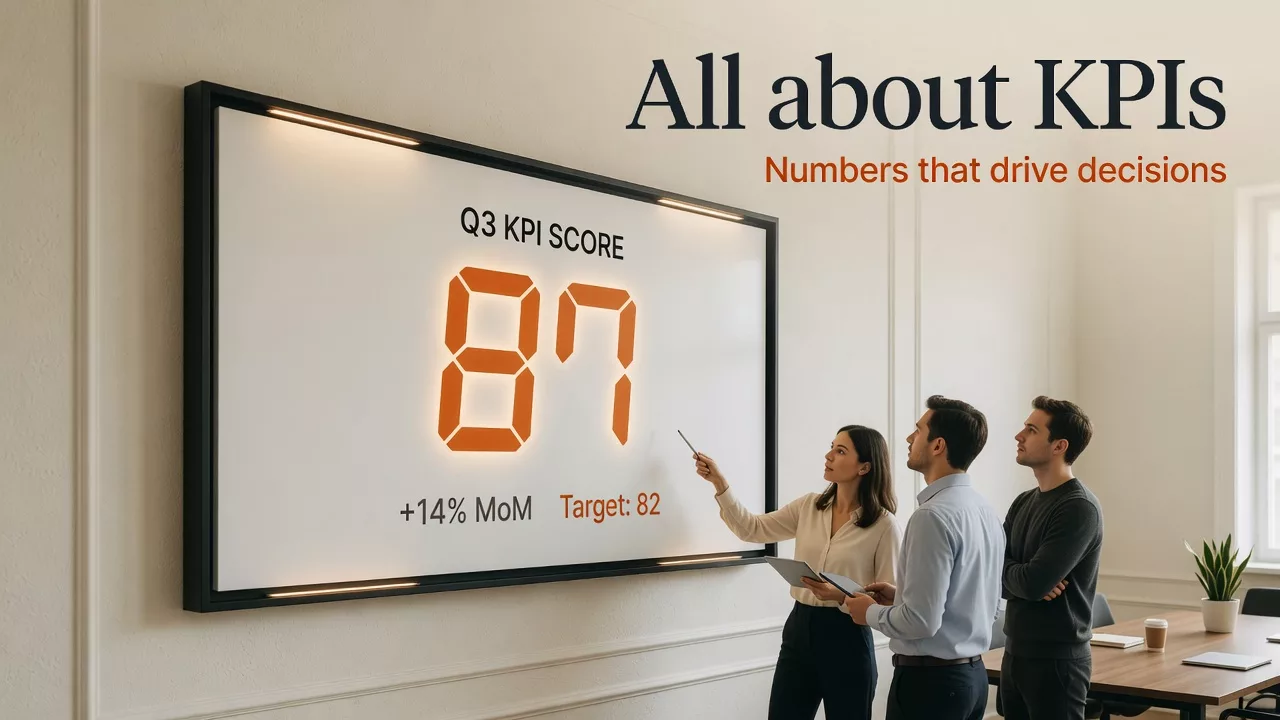
All about KPIs: numbers that drive a decision
Twenty-eight charts is not a strategy. KPIs are a short list of owned measures tied to decisions. Learn KPI vs metric, leading vs lagging, a practical ladder, and…
What are large language models (LLMs), and what are they good for at work?
Large language models draft text by predicting tokens at scale. Plain definitions, analytics use cases, grounding with retrieval, and a review habit so polished answers do not become…

What is Git? A straightforward introduction for analytics work
Git tracks versions so teams stop emailing final_final.sql. Repos, commits, branches, remotes, and a minimal daily loop for analysts and analytics engineers.