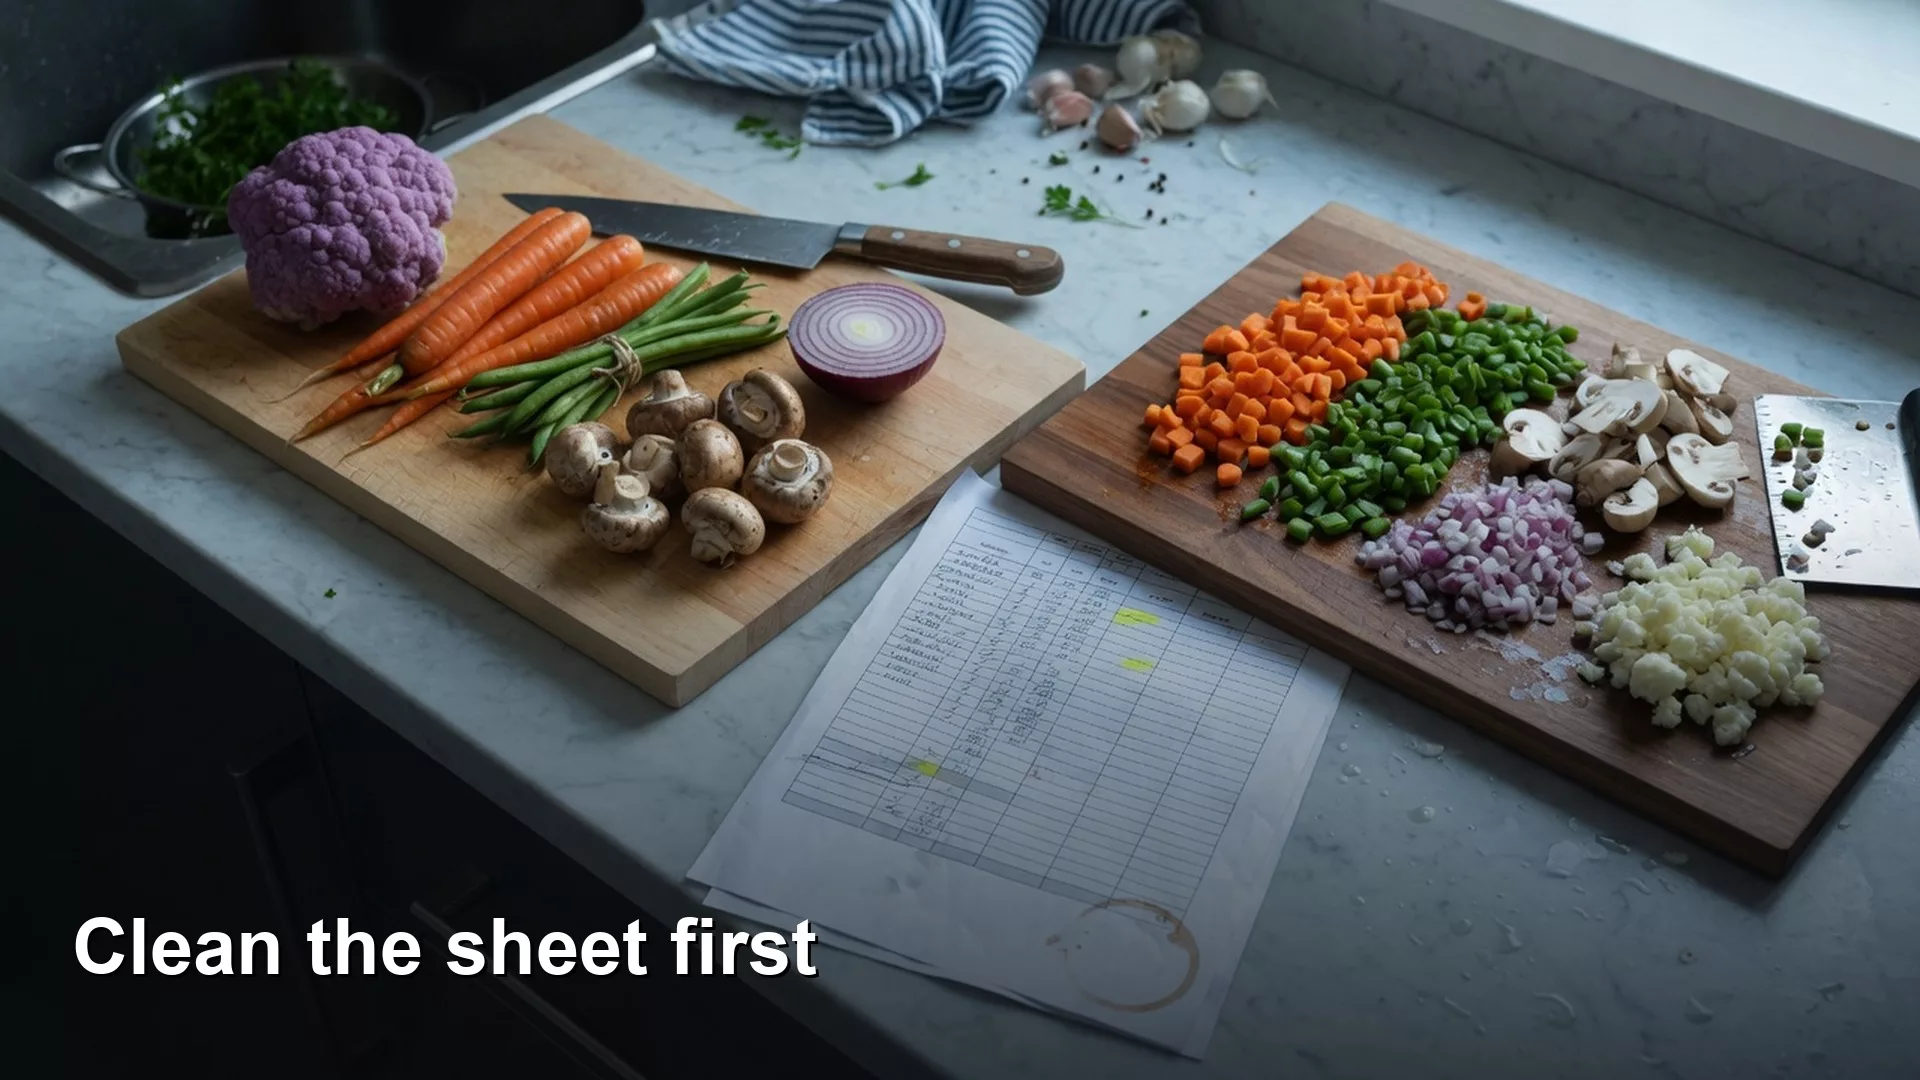
Category: Analytics
This shelf is the job, not a tool manual. You are here if someone expects a number, a chart, or a “what should we do,” and the spreadsheet is starting to argue with itself. The articles cover the question before the query, a metric with a written definition, a chart that answers something, data that is fit to ship, and the messy middle of pipelines and stewardship.
It is not the SQL category. SQL is how you ask a table. Analytics is what you are trying to decide, and whether the number is even the right one. It is not the AI category either. A model can draft the email about the metric. It does not pick the metric.
Where to start: Analytics foundations if you do not yet have a clear question. Metrics if the team is arguing about a definition. Charts if the picture is pretty and the decision is still fuzzy. The SQL series when you are ready to ask the table yourself. Learn groups these as a track so you do not have to guess an order from a flat list.
How to set up Python for data analysis without getting stuck
Set up Python for analytics without the folklore that scares people off. Create a virtual environment, install pandas with pip, and load a tiny CSV so your first…
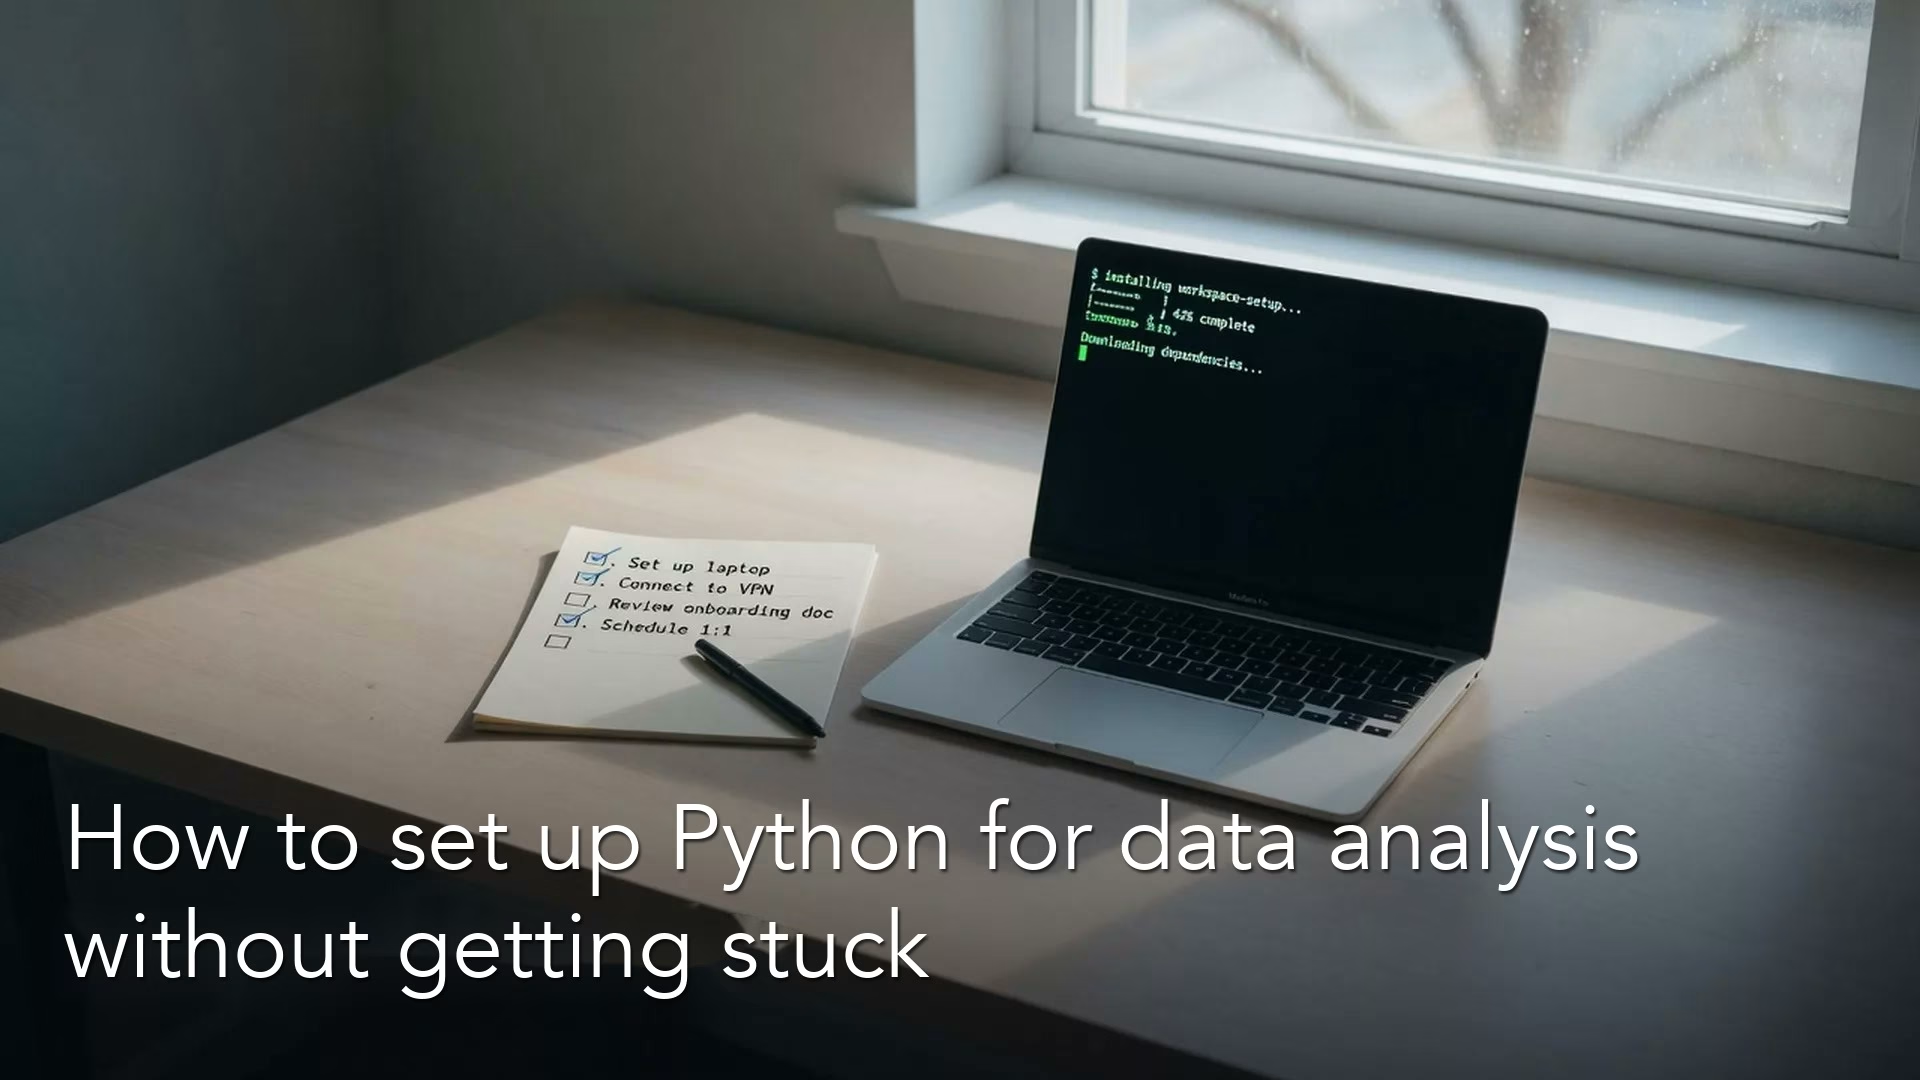
Why Python for analytics (and when to stay in SQL or Sheets)
Python is optional for many analytics jobs, and that is a feature, not a failure. Learn when Sheets or SQL still win, when a notebook saves real hours,…
What is a table contract? How to document what a data table means
One page that records grain, keys, ownership, columns, exclusions, and allowed use so multiplayer tables stay trustworthy.
How to export spreadsheet data cleanly into SQL or a data warehouse
UTF-8 CSVs, honest types, ISO dates, no totals rows, and a handoff note so pipelines and people load what you meant to ship.
How to clean data in Google Sheets before you analyze it
A practical Sheets cleaning pass: trim, dates, splits, nulls, and deduping only after grain is clear. Keep raw copies; log your steps.