A large language model (LLM) is the AI behind tools like ChatGPT: software trained on huge amounts of text to predict the next word, so well that it can draft, summarize, and explain. It is useful, and it is also confident when it is wrong, so check anything you will act on.
Imagine you paste a messy brief into a chat window and get back a tidy draft email and a summary in seconds. It reads well. One number in the summary, though, does not appear anywhere in your brief.
This post explains what these models are, how chat tools relate to them, where they help analytics teams, and what to check before you trust an answer. If you use it to write database queries in SQL (the standard language for asking a database questions), pair it with how to check AI-written SQL and vector databases.
What you’ll learn
- A plain definition of LLMs and generative AI.
- How chat products relate to the underlying models.
- Practical analytics use cases with guardrails.
- Why grounding and evaluation matter.
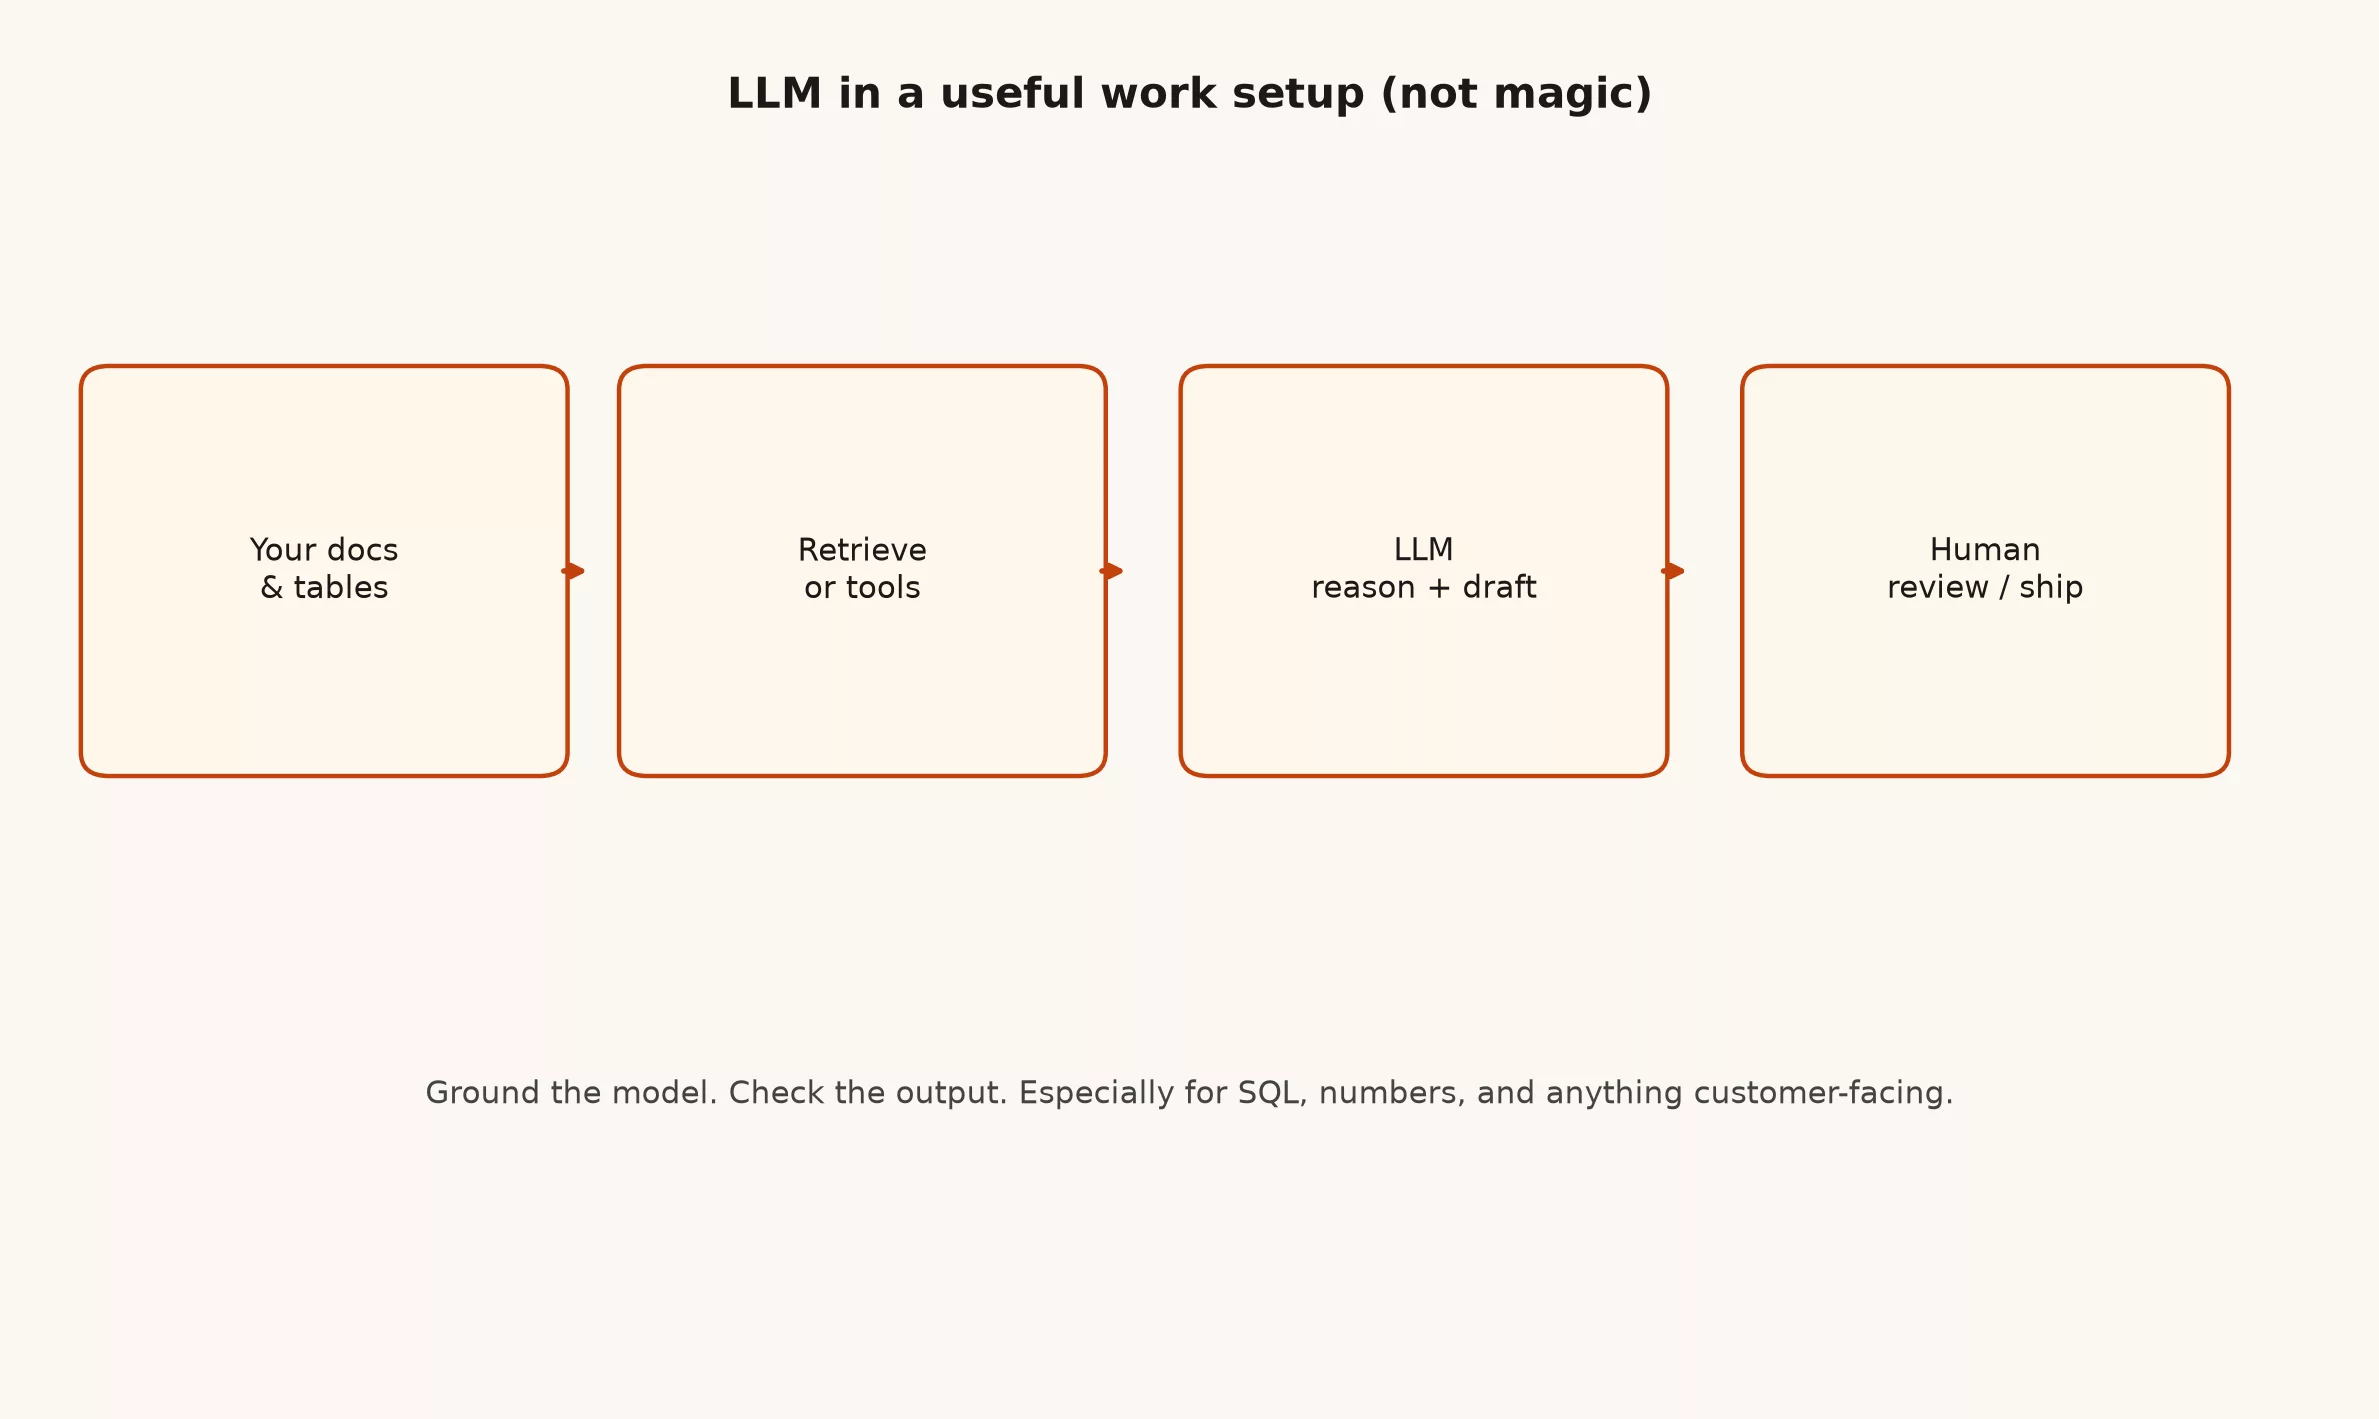
- A simple work pattern: retrieve, generate, review.
What an LLM is
An LLM is a neural network trained on huge text corpora to predict the next token (piece of text). With enough scale and training tricks, that simple objective produces systems that can draft, summarize, translate, write code, and answer questions in natural language.
Generative AI is the broader label for models that create content (text, images, audio). LLMs are the text-centered branch most teams mean when they say “we should use AI” in a knowledge-work meeting.
ChatGPT and friends
Chat products wrap models with interfaces, safety layers, tools, and memory features. The brand name is not the whole model zoo. Providers include OpenAI, Anthropic, Google, Meta’s openly downloadable models (open weights, meaning you can download the model’s learned numbers and run it yourself), and many hosted or self-hosted options via platforms like Hugging Face. Capabilities and policies change; design your process so you can swap models.
Why they got popular at work
They collapsed the cost of a first draft. That matters for support macros, internal docs, code stubs, and meeting summaries. They also fail in familiar ways: hallucinations, outdated knowledge, weak math without tools, and leakage risk if you paste secrets into the wrong box.
Analytics use cases that hold up
| Use case | Helpful pattern | Risk if careless |
|---|---|---|
| SQL drafting | Generate, then verify grain and joins | Wrong numbers with confident comments |
| Doc Q&A | Retrieve company docs, then answer | Invented policy citations |
| Ticket summarization | Condense with links to source ticket | Dropped severity details |
| Explain-a-chart drafts | Human edits narrative | Causal claims from correlation |
| Boilerplate code | Tests required | Silent edge-case bugs |
Grounding beats vibes
If the answer must be true about your business, give the model your text (retrieval) or structured tools (query a warehouse with permission). RAG (retrieval-augmented generation) is one pattern: fetch relevant chunks, then generate. You must still verify the outputs because retrieval can fetch the wrong chunk with perfect grammar.
A simple operating pattern
- State the task and the decision the output supports.
- Attach or retrieve the source material.
- Generate a draft.
- Check facts, numbers, and policy against sources, because AI drafts can state wrong details with full confidence.
- Ship only after a human owns the result.
Challenges and concerns
- Hallucinations and fabricated citations.
- Sensitive data pasted into external tools.
- Bias and uneven quality across topics.
- Cost and waiting time at high volume.
- Over-trust from non-experts because the prose sounds polished.
What good looks like on a team
Written rules for what may be pasted where. Evaluation sets for recurring tasks (for example 20 SQL questions with known answers). A habit of linking sources in final artifacts. No shame in saying the model was wrong. Shame in shipping without checking.
Quick recap
- LLMs predict text; usefulness comes from workflow (the series of steps you follow) design.
- Chat apps wrap models; keep models swappable.
- Ground outputs for business truth; always review.
- SQL and numbers need extra verification.
- Treat polished prose as a warning light, not a proof.
A good first step this week: take one answer an AI tool gave you that you planned to use, and check one fact in it against a source you trust. Note whether it held up before you rely on the rest.
Sources
- https://openai.com/
- https://www.anthropic.com/
- https://ai.meta.com/blog/large-language-model-llama-meta-ai/
- https://huggingface.co/
- https://blog.google/technology/ai/google-palm-2-ai-large-language-model/
Keep going
Same lessons in your feed
Short diagrams, hooks, and weekly tutorials on Substack, Instagram, X, and Facebook.