Category: Analytics
This shelf is the job, not a tool manual. You are here if someone expects a number, a chart, or a “what should we do,” and the spreadsheet is starting to argue with itself. The articles cover the question before the query, a metric with a written definition, a chart that answers something, data that is fit to ship, and the messy middle of pipelines and stewardship.
It is not the SQL category. SQL is how you ask a table. Analytics is what you are trying to decide, and whether the number is even the right one. It is not the AI category either. A model can draft the email about the metric. It does not pick the metric.
Where to start: Analytics foundations if you do not yet have a clear question. Metrics if the team is arguing about a definition. Charts if the picture is pretty and the decision is still fuzzy. The SQL series when you are ready to ask the table yourself. Learn groups these as a track so you do not have to guess an order from a flat list.
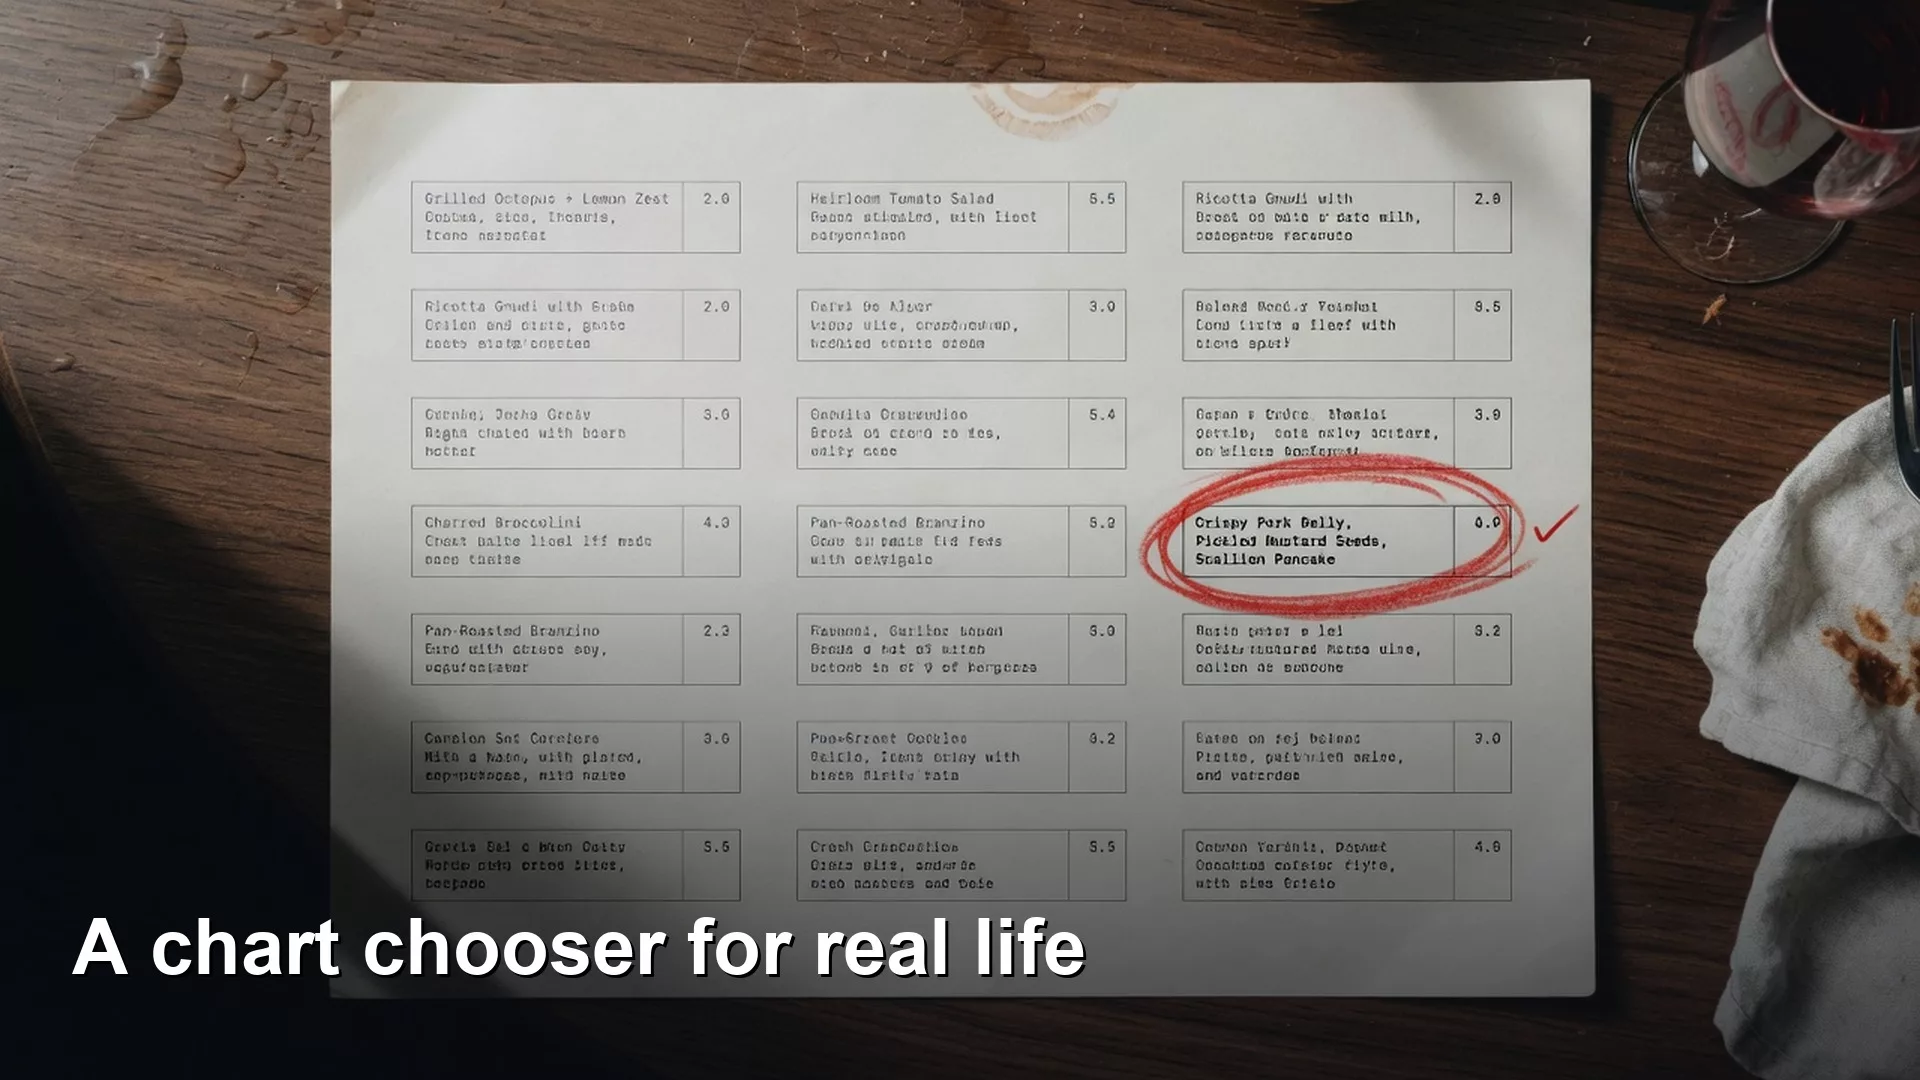
How to choose the right chart for your question
Pick the chart for the question, not the template gallery. Use comparison, trend, composition, and distribution on purpose, plus a short never-do-this list for pies, 3D effects, and…
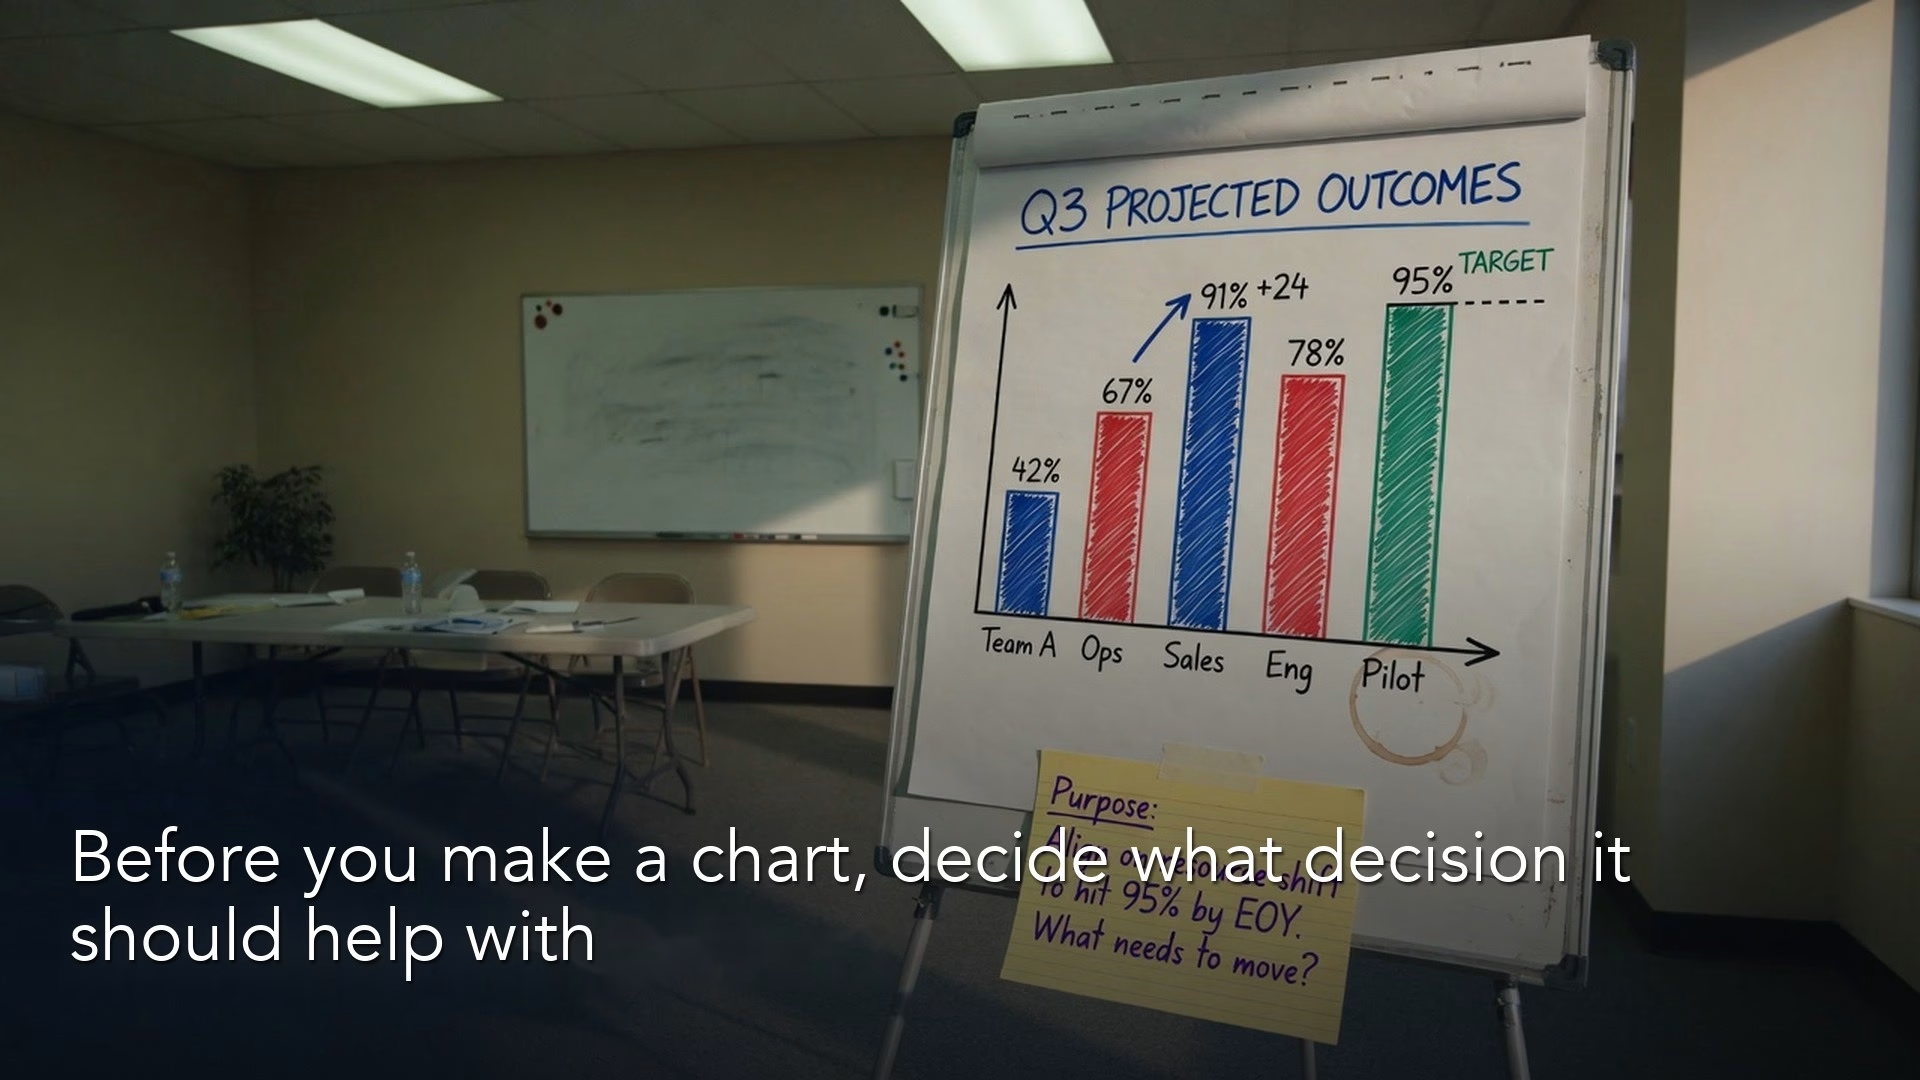
Before you make a data chart, decide what decision it should help someone make
A chart is a job, not decoration. Learn explore versus explain versus persuade so the next deck chart answers a real decision instead of filling a slide with…
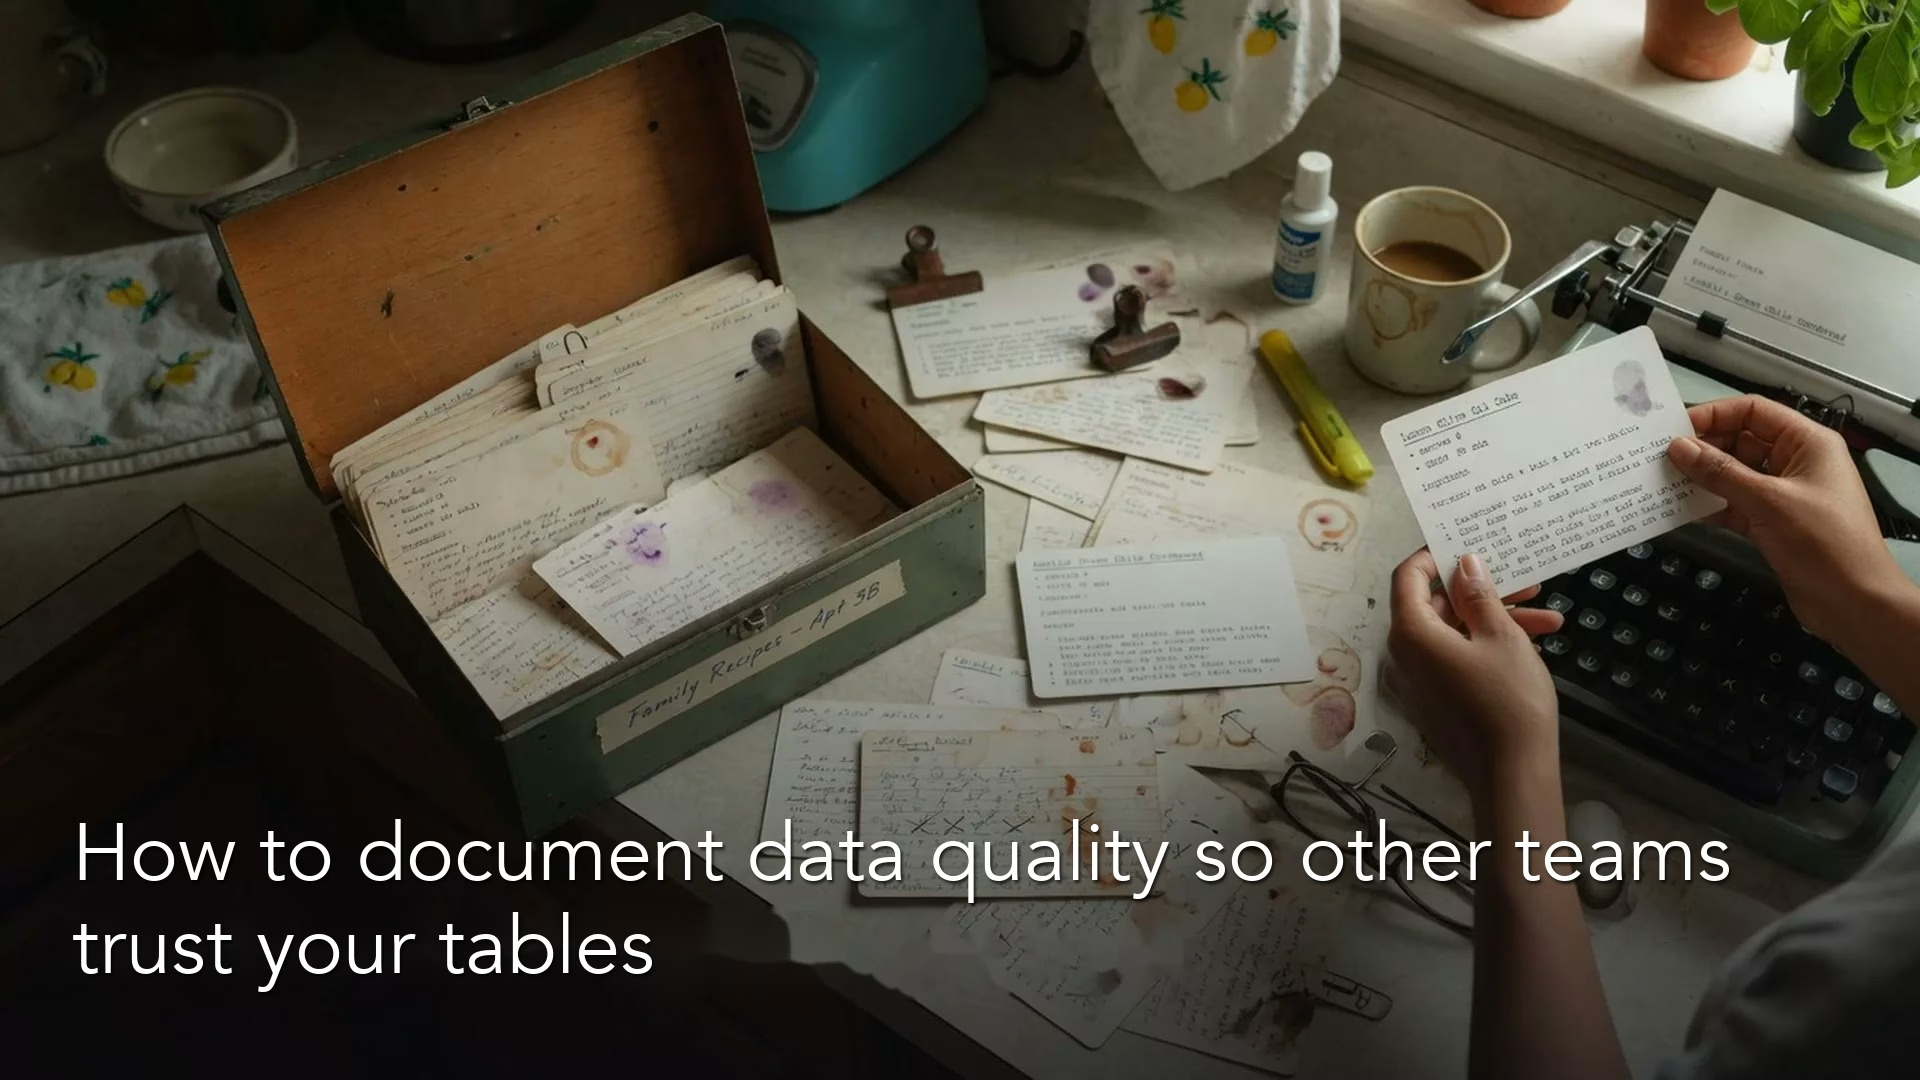
How to document data quality so other teams trust your tables
Trust needs a light paper trail, not a bureaucracy. Publish a simple data quality scorecard with owner, metrics, known issues, and next check so teammates can rely on…
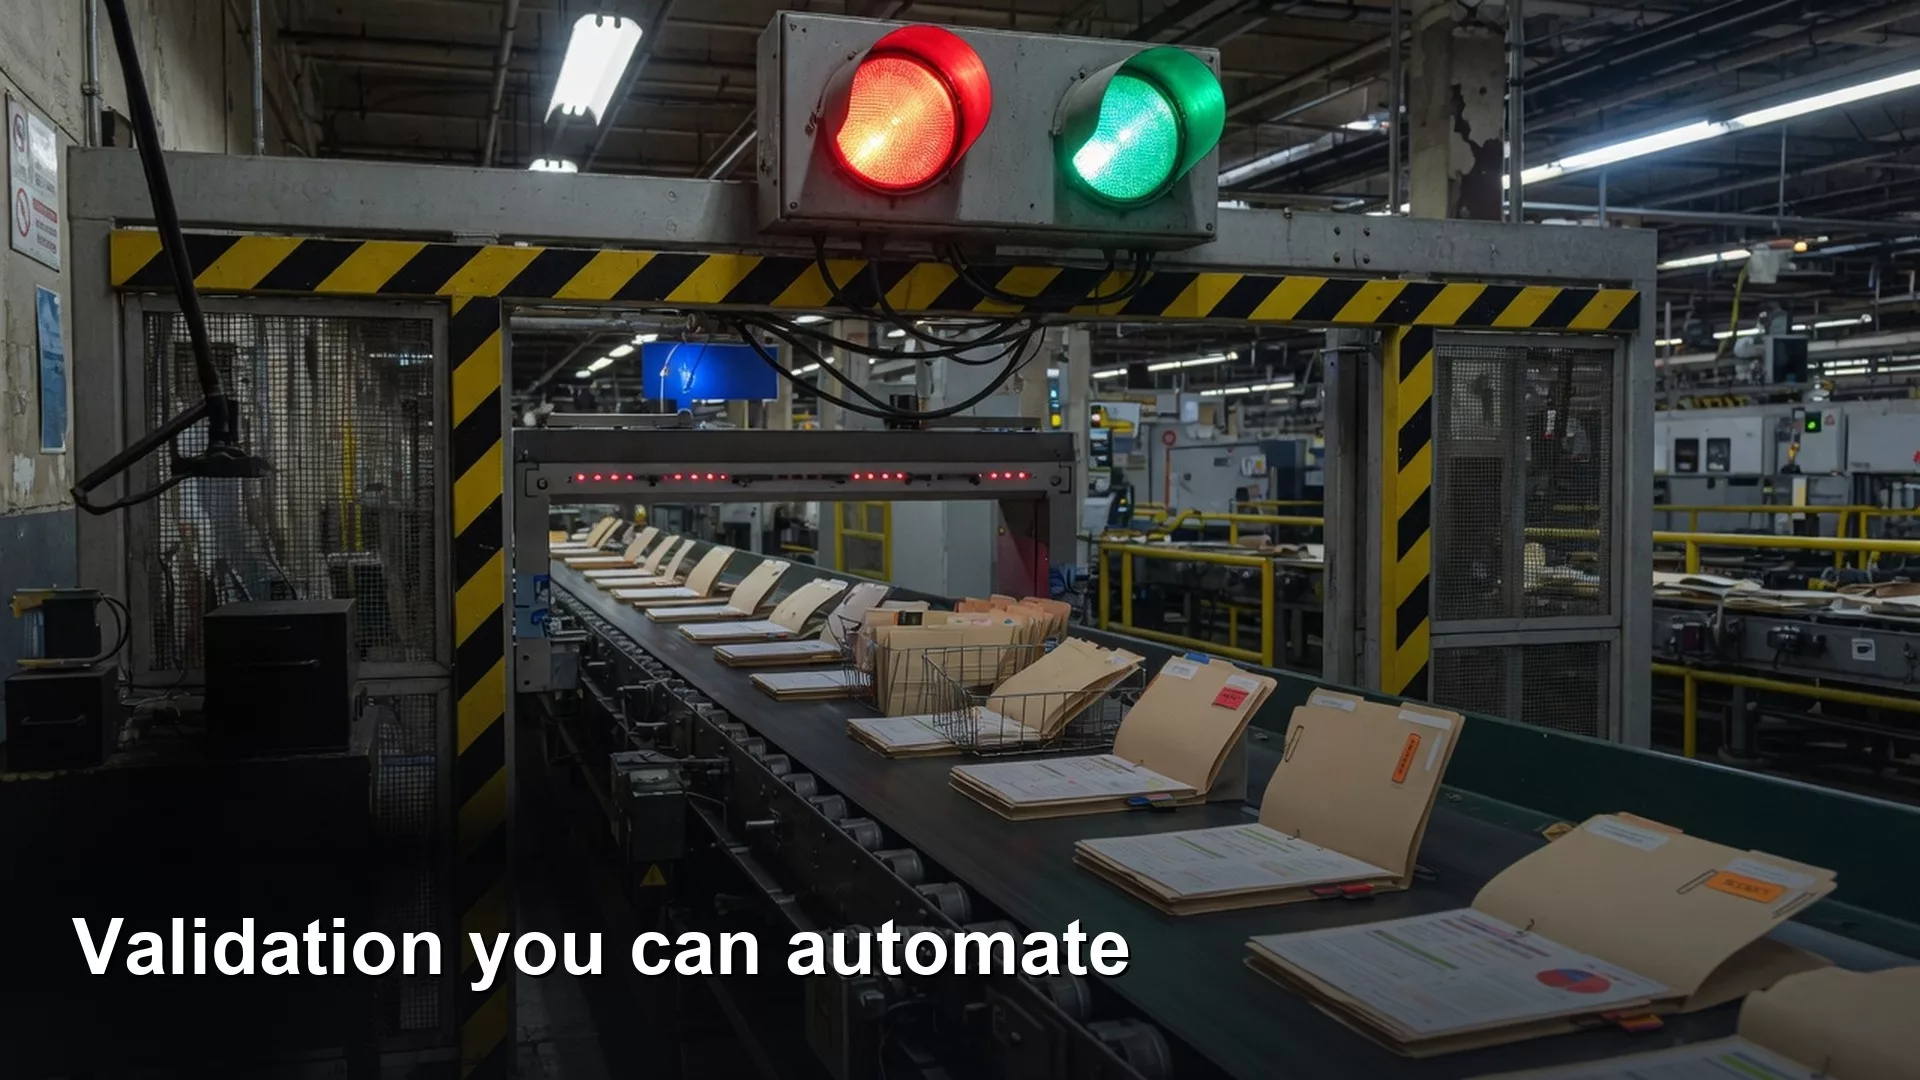
How to automate data validation checks so bad data never reaches your reports
Automated checks catch bad data before leadership does. Build small scripts for row counts, referential integrity, freshness, and yesterday versus last week sanity so every number you ship…
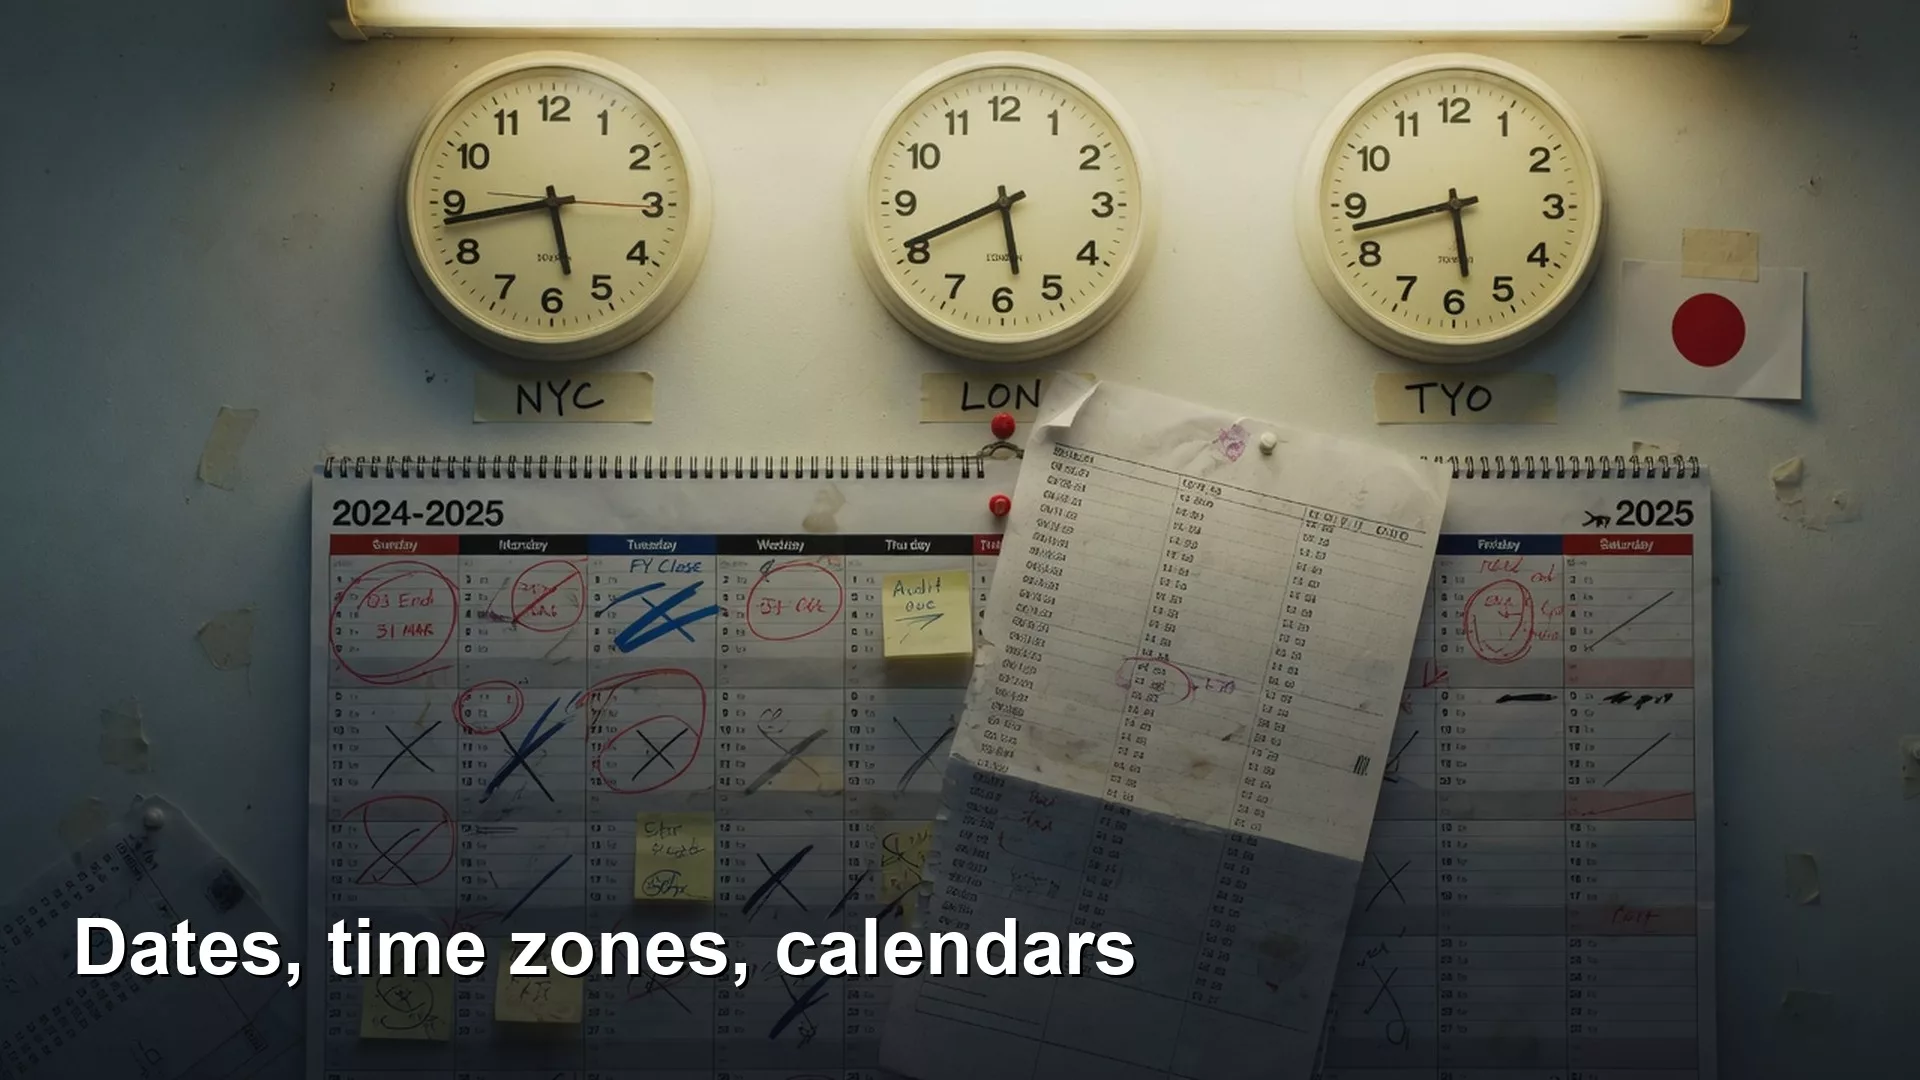
How to handle dates, time zones, and fiscal calendars in your reports
Time zones and fiscal calendars quietly break dashboards people trust. Learn to store UTC, display local time, separate calendar months from fiscal periods, and cast dates safely in…