
Automated data checks are a safety net that warns you when a table looks wrong before anyone else notices. They are small tests that run every morning and say either that the data is fine to use or that something needs attention.
Say you already fixed the joins, labeled the time zone, and even wrote “partial day” on the chart. Then a data pipeline (the automatic steps that load data into your tables) quietly loads only half a file, and a customer ID points at a customer who was deleted. Yesterday’s revenue sits 40% under last week. Nobody wrote an alert for that, so leadership finds it first. The cause was a missing safety net, not a tool that broke.
This post is part of the series Data quality for people who ship numbers. The previous post made dates and fiscal calendars explicit. Now you automate the boring checks that protect every number you ship. They cover row counts, referential integrity (whether records point at other records that exist), freshness, and simple sanity comparisons. If you profiled your data in an earlier post, this is the same profiling on a schedule, with a pass or a fail at the end. SQL (the standard language for asking a database for data) skills from the SQL series and small scripts from Python for analytics are enough, and you do not need to buy a platform to start. The foundations still matter, because checks should serve a decision and not exist for show (see Analytics foundations). Spreadsheet handoffs from From spreadsheets to real data need the same gates when they become warehouse tables.
Validation is not perfection. It is early news.
What a night-run status board can look like:
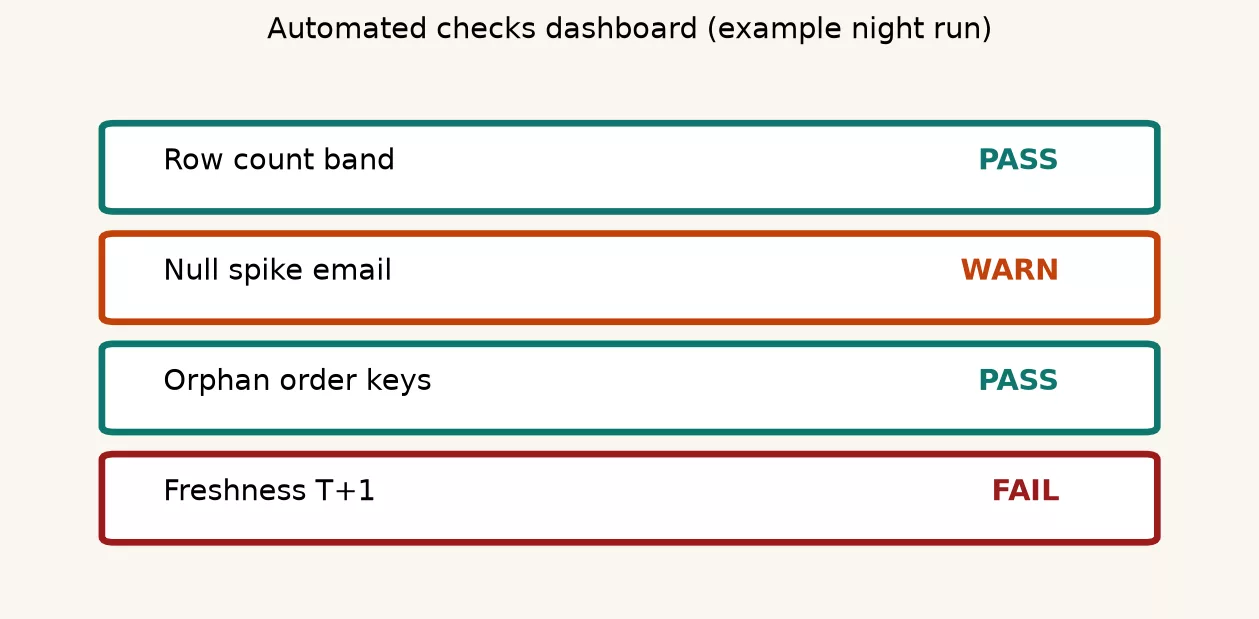
Validation here means automated tests that say either that this table is safe enough for today’s decisions, or to stop because something drifted. It is not a claim that every field matches reality forever. The first post in this series named five quality dimensions: completeness, accuracy, consistency, timeliness, and uniqueness. Each one becomes a concrete yes-or-no test that you can write in code.
Good checks share three traits.
- Cheap to run so you actually schedule them.
- Clear on failure so a human knows what broke and where.
- Tied to a user so you fix what dashboards and exports care about first.
If a check never fails and never gets read, delete it. If a check fails daily and everyone ignores it, fix the threshold or the pipeline, because noise is the enemy of trust.
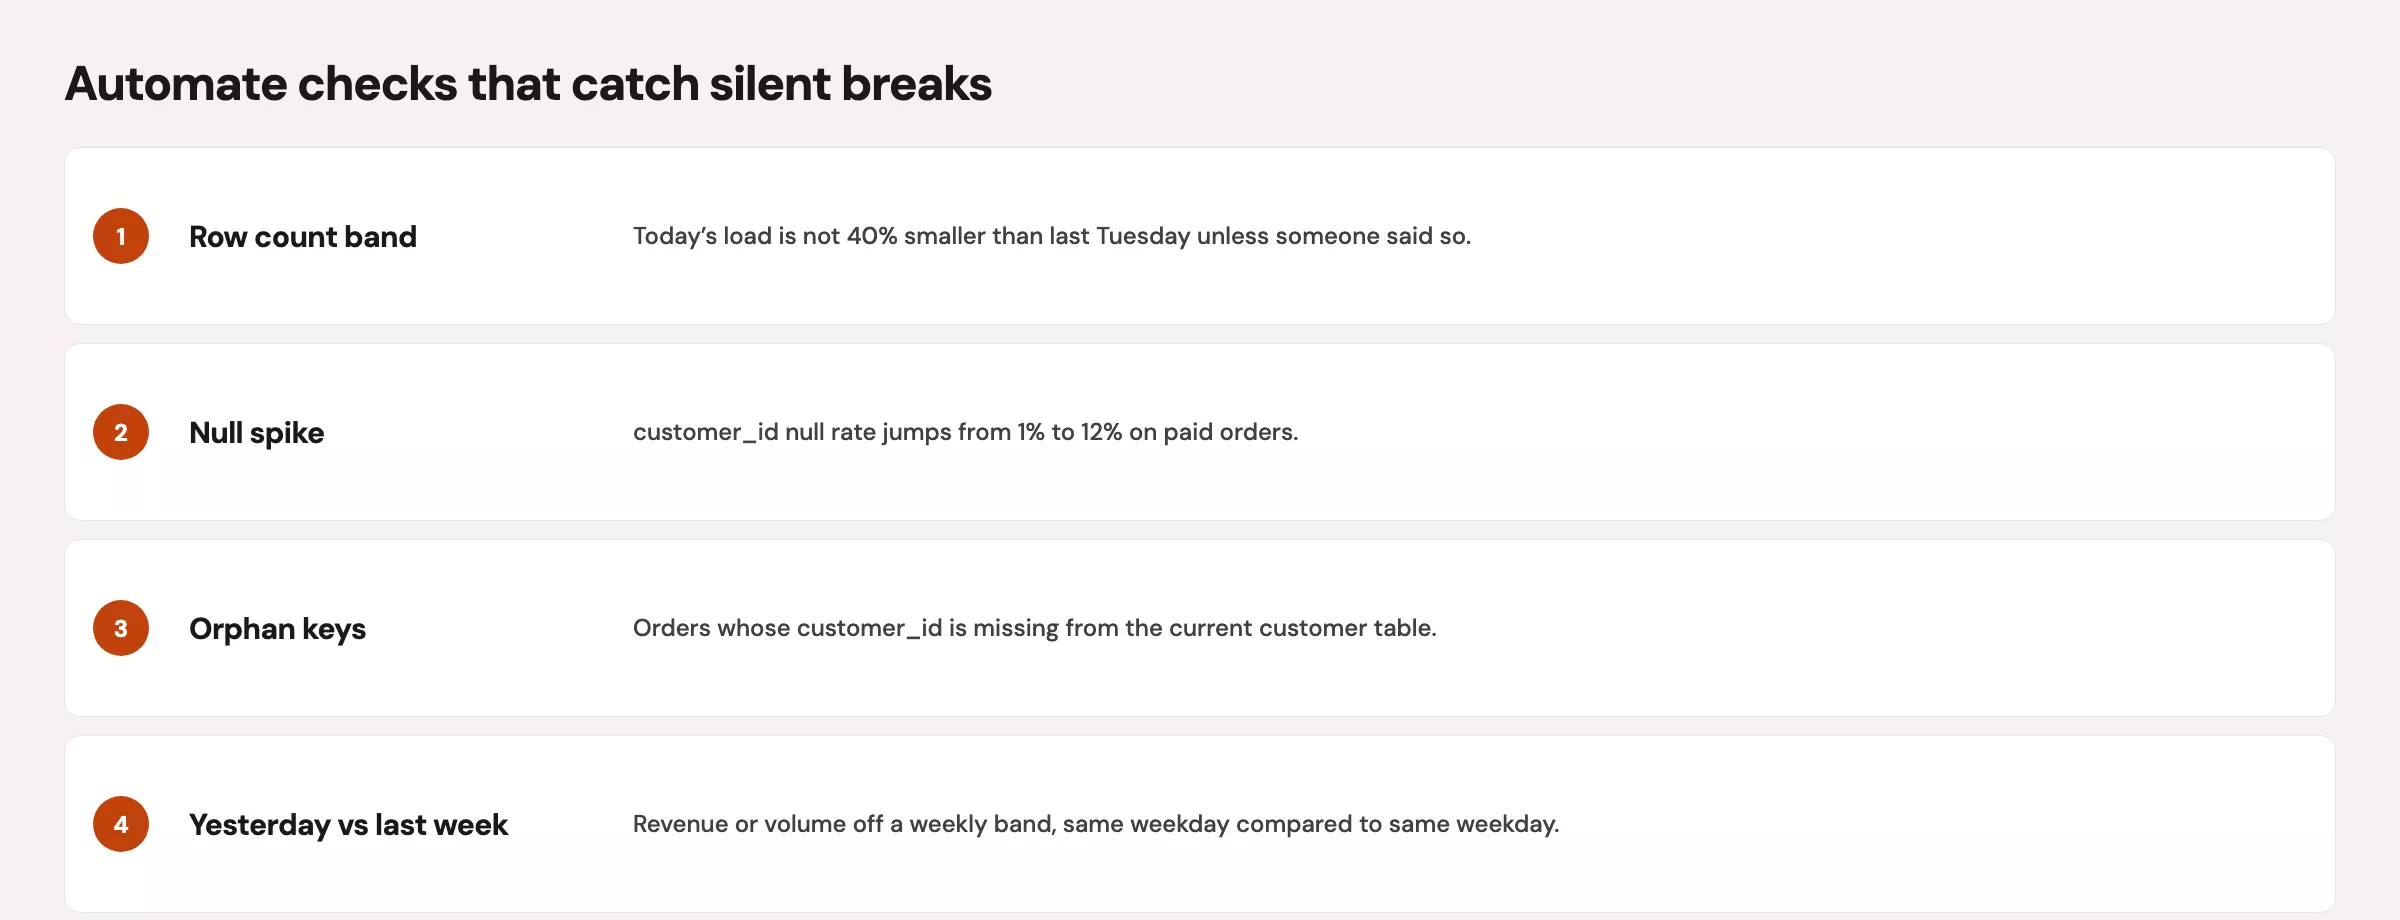
The starter checklist (ship this first)
| Check | Question it answers | Typical fail signal |
|---|---|---|
| Row count floor or band | Did we load roughly the right volume? | 0 rows, or 50% off recent baseline |
| Primary key uniqueness | Do IDs collide? | Duplicate order_id after load |
| Required fields non-null | Are critical columns complete enough? | Null rate for amount above 1% |
| Referential integrity | Do facts point at real dimensions? | Orders with missing customers |
| Accepted values | Are categories in the known set? | New status code not in map |
| Freshness | Is the data recent enough? | Newest event time is older than the agreed freshness limit |
| Sanity compare | Is today or yesterday wildly off? | Revenue < 50% of same weekday last week |
| Parse or type health | Did casts silently null out? | A spike in invalid dates after the new date rules |
Start with three checks on the table that gets blamed most often, and expand only after they save you once. A short list that runs is better than a beautiful framework that never ships.
Row counts: the canary that still works
Row counts are blunt but valuable. They catch empty loads, double loads, and filters applied twice. Prefer a band, meaning an acceptable range, over a single magic number when volume naturally moves with weekends, promotions, and seasons.
There are two useful kinds of row count check:
- Absolute floor: “Daily orders fact must have more than 0 rows after the morning load.”.
- Relative band: “Yesterday’s row count should sit between 60% and 140% of the median of the last 28 same-weekdays,” adjusted for known holidays later.
Always write down the grain, which is what one row stands for, because counting order lines is not the same as counting orders. If you already respect grain when you remove duplicates, put the same grain sentence in the check name.
Referential integrity without enterprise theater
Referential integrity means that child rows point at parent rows that actually exist. Orders refer to customers, line items refer to products, and events refer to sessions. When the parent is missing, joins drop rows or inflate the “unknown” category, and people end up arguing about marketing performance.
You do not need the database to enforce foreign keys on every analytics table to care about this. You need a daily query that counts orphans, meaning child rows with no parent, and fails when the count passes a threshold. The threshold is often zero for core tables, or a tiny rate where records are marked deleted instead of removed.
-- Orphan orders: customer_id not found in customers dimension
SELECT
  COUNT(*) AS orphan_orders
FROM analytics.orders_fact o
LEFT JOIN analytics.customers_dim c
  ON c.customer_id = o.customer_id
WHERE c.customer_id IS NULL
  AND o.order_date >= CURRENT_DATE - INTERVAL '7' DAY;

-- Soft-delete aware version: parent exists but is inactive
SELECT
  COUNT(*) AS orders_pointing_at_inactive_customers
FROM analytics.orders_fact o
JOIN analytics.customers_dim c
  ON c.customer_id = o.customer_id
WHERE c.is_active = FALSE
  AND o.order_date >= CURRENT_DATE - INTERVAL '7' DAY;
Example output.
| check_name | status | value | threshold |
|---|---|---|---|
| row_count_band | PASS | 1184 | 1000-1500 |
| null_email_rate | WARN | 2.1% | <2% |
| orphan_orders | PASS | 0 | 0 |
| freshness_hours | FAIL | 36h | ≤24h |
Decide the policy in advance. You can block the dashboard (a screen of charts that tracks key numbers), open a ticket, or move the bad rows into an exceptions table. Silently dropping rows in a join is the worst policy, because it produces a number that looks clean.
Freshness: timeliness you can measure
Timeliness is one of the quality dimensions from the first post in this series. To measure it, use freshness, which asks how old the newest trustworthy row is compared with now.
max(event_time)for “when did reality last show up?”.max(loaded_at)for “when did the pipeline last write?”.- Compare both, because a fresh load of stale events is a different failure than no load at all.
Set a freshness promise, often called a service level agreement (SLA), that matches the decision. An hourly operations board may need data less than 90 minutes old, while a weekly executive pack may tolerate a one-day delay. The clock rules from the earlier post on time zones still apply, because freshness in universal time (UTC, the world’s standard time zone) and freshness by local business day can disagree near midnight.
SELECT
  MAX(ordered_at_utc) AS max_event_utc,
  MAX(loaded_at_utc) AS max_load_utc,
  EXTRACT(EPOCH FROM (CURRENT_TIMESTAMP - MAX(ordered_at_utc))) / 3600.0
    AS event_lag_hours,
  EXTRACT(EPOCH FROM (CURRENT_TIMESTAMP - MAX(loaded_at_utc))) / 3600.0
    AS load_lag_hours
FROM analytics.orders_fact
WHERE order_date >= CURRENT_DATE - INTERVAL '3' DAY;
This query looks at the last three days of orders and reports the newest order time, the newest load time, and how many hours old each one is. A large gap in the first number means orders stopped arriving; a gap in the second means the loading job stopped.
Yesterday versus last week: sanity without superstition
Example.
| check | value | flag |
|---|---|---|
| yesterday_orders | 1180 | OK |
| last_week_avg | 1100 | baseline |
| ratio | 1.07 | within 20% |
Seasonality is real, so a Monday does not look like a Sunday and Black Friday does not look like a normal Friday. A good sanity check compares like with like and uses wide bands, not two-decimal anomaly scores that you cannot explain in a meeting.
A practical pattern looks like this:
- Compute yesterday’s number at the agreed grain and clock.
- Compare to the same weekday last week, or to the median of the last four same weekdays.
- Fail only on extreme ratios or absolute floors you would bet a reputation on.
- Allow an override table for known events such as a product launch, an outage, or a holiday.
A proper monitoring system does much more than this. Think of these checks as a seatbelt, which is boring until the day it is not.
Worked example: morning checks on a toy orders table
Below is a compact Python checklist that you can adapt. It uses pandas, a popular Python library for tables. You can run it on a warehouse extract or a CSV (a plain spreadsheet-style text file) while you build trust in the pattern. Later you can move the same tests into SQL jobs, dbt tests, or a scheduler you already have.
| order_id | customer_id | order_date | amount | status |
|---|---|---|---|---|
| 501 | C1 | 2024-06-10 | 40.00 | paid |
| 502 | C2 | 2024-06-10 | 12.50 | paid |
| 503 | C9 | 2024-06-10 | 30.00 | paid |
| 503 | C2 | 2024-06-10 | 30.00 | paid |
| 504 | C1 | 2024-06-11 | pending | |
| 505 | C3 | 2024-06-11 | 22.00 | refunded |
The customers table contains only C1, C2, and C3, and the allowed statuses are paid, pending, and refunded. You should expect failures for duplicate 503, orphan C9, and a missing amount on 504.
from dataclasses import dataclass
from datetime import date, datetime, timezone
from typing import Callable, List

import pandas as pd

orders = pd.DataFrame(
    {
        "order_id": [501, 502, 503, 503, 504, 505],
        "customer_id": ["C1", "C2", "C9", "C2", "C1", "C3"],
        "order_date": pd.to_datetime(
            ["2024-06-10", "2024-06-10", "2024-06-10", "2024-06-10", "2024-06-11", "2024-06-11"]
        ),
        "amount": [40.0, 12.5, 30.0, 30.0, None, 22.0],
        "status": ["paid", "paid", "paid", "paid", "pending", "refunded"],
        "loaded_at_utc": pd.to_datetime(
            ["2024-06-12 06:00:00"] * 6, utc=True
        ),
    }
)
customers = pd.DataFrame({"customer_id": ["C1", "C2", "C3"]})
ALLOWED_STATUS = {"paid", "pending", "refunded"}

@dataclass
class CheckResult:
    name: str
    ok: bool
    detail: str

def run_checks(checks: List[Callable[[], CheckResult]]) -> List[CheckResult]:
    return [fn() for fn in checks]

def check_row_count_floor(df: pd.DataFrame, minimum: int) -> CheckResult:
    n = len(df)
    return CheckResult(
        "row_count_floor",
        n >= minimum,
        f"rows={n}, minimum={minimum}",
    )

def check_unique_key(df: pd.DataFrame, col: str) -> CheckResult:
    dupes = int(df[col].duplicated().sum())
    return CheckResult(
        f"unique_{col}",
        dupes == 0,
        f"duplicate_rows={dupes}",
    )

def check_null_rate(df: pd.DataFrame, col: str, max_rate: float) -> CheckResult:
    rate = float(df[col].isna().mean())
    return CheckResult(
        f"null_rate_{col}",
        rate <= max_rate,
        f"null_rate={rate:.3f}, max={max_rate:.3f}",
    )

def check_referential(df: pd.DataFrame, dim: pd.DataFrame, key: str) -> CheckResult:
    orphans = int((~df[key].isin(set(dim[key]))).sum())
    return CheckResult(
        f"referential_{key}",
        orphans == 0,
        f"orphan_rows={orphans}",
    )

def check_accepted_values(df: pd.DataFrame, col: str, allowed: set) -> CheckResult:
    bad = int((~df[col].isin(allowed)).sum())
    return CheckResult(
        f"accepted_{col}",
        bad == 0,
        f"invalid_rows={bad}",
    )

def check_freshness(df: pd.DataFrame, col: str, max_lag_hours: float) -> CheckResult:
    max_ts = df[col].max()
    now = datetime.now(timezone.utc)
    lag_h = (now - max_ts.to_pydatetime()).total_seconds() / 3600.0
    # For the toy run, treat max_lag loosely; in prod use real now vs SLA
    return CheckResult(
        f"freshness_{col}",
        lag_h <= max_lag_hours,
        f"lag_hours={lag_h:.1f}, max={max_lag_hours}",
    )

def check_yesterday_vs_last_week(
    df: pd.DataFrame,
    day: date,
    value_col: str,
    ratio_min: float = 0.5,
    ratio_max: float = 1.8,
) -> CheckResult:
    y = df.loc[df["order_date"].dt.date == day, value_col].sum(min_count=1)
    prior = date.fromordinal(day.toordinal() - 7)
    p = df.loc[df["order_date"].dt.date == prior, value_col].sum(min_count=1)
    if pd.isna(y) or pd.isna(p) or p == 0:
        return CheckResult(
            "yesterday_vs_last_week",
            False,
            f"insufficient_data y={y}, prior={p}, prior_day={prior}",
        )
    ratio = float(y) / float(p)
    ok = ratio_min <= ratio <= ratio_max
    return CheckResult(
        "yesterday_vs_last_week",
        ok,
        f"ratio={ratio:.2f}, y={y}, prior_week={p}",
    )

results = run_checks(
    [
        lambda: check_row_count_floor(orders, minimum=1),
        lambda: check_unique_key(orders, "order_id"),
        lambda: check_null_rate(orders, "amount", max_rate=0.0),
        lambda: check_referential(orders, customers, "customer_id"),
        lambda: check_accepted_values(orders, "status", ALLOWED_STATUS),
        lambda: check_freshness(orders, "loaded_at_utc", max_lag_hours=48),
        lambda: check_yesterday_vs_last_week(
            orders, day=date(2024, 6, 11), value_col="amount"
        ),
    ]
)

for r in results:
    flag = "PASS" if r.ok else "FAIL"
    print(f"{flag:4}  {r.name:28}  {r.detail}")

failed = [r for r in results if not r.ok]
if failed:
    raise SystemExit(f"{len(failed)} checks failed")
print("all checks passed")
Example:
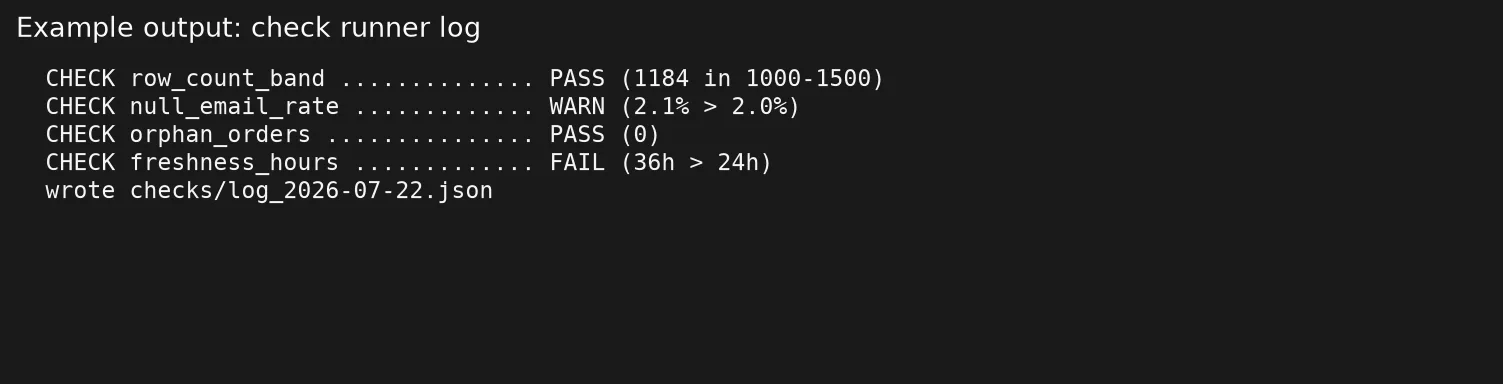
When you run this toy example, the uniqueness, empty-value, and referential checks should fail, and that is the point. A green suite on dirty data is a liability. Wire SystemExit or an equivalent failure status into your scheduler, so a red run blocks the “data ready” message in your team chat.
SQL twin for the same ideas
-- Bundle check outputs into one result set for a log table
WITH metrics AS (
  SELECT
    (SELECT COUNT(*) FROM analytics.orders_fact
      WHERE order_date = DATE '2024-06-11') AS rows_yesterday,
    (SELECT COUNT(*) - COUNT(DISTINCT order_id)
      FROM analytics.orders_fact
      WHERE order_date >= DATE '2024-06-01') AS duplicate_order_id_extra_rows,
    (SELECT AVG(CASE WHEN amount IS NULL THEN 1.0 ELSE 0.0 END)
      FROM analytics.orders_fact
      WHERE order_date >= DATE '2024-06-01') AS null_amount_rate,
    (SELECT COUNT(*)
      FROM analytics.orders_fact o
      LEFT JOIN analytics.customers_dim c ON c.customer_id = o.customer_id
      WHERE c.customer_id IS NULL
        AND o.order_date >= DATE '2024-06-01') AS orphan_orders
)
SELECT
  *,
  CASE WHEN rows_yesterday > 0 THEN 'PASS' ELSE 'FAIL' END AS row_count_status,
  CASE WHEN duplicate_order_id_extra_rows = 0 THEN 'PASS' ELSE 'FAIL' END AS uniqueness_status,
  CASE WHEN null_amount_rate = 0 THEN 'PASS' ELSE 'FAIL' END AS null_status,
  CASE WHEN orphan_orders = 0 THEN 'PASS' ELSE 'FAIL' END AS referential_status
FROM metrics;
Where to run checks (pick boring infrastructure)
Use tools you already operate:
- A scheduled SQL script (a small program) in the warehouse with results written to
dq_check_log - A Python job next to your pipeline scripts, in the style of the pipeline habits from the Python series.
- dbt tests or similar, if your team already transforms data with them.
- A notebook (a document that mixes code, its results, and notes) only as a prototype, not as the long-term production gate.
Log at least the check name, the dataset, the timestamp, the status, the measured value, the threshold, and a short owner. That log becomes the input for the quality scorecard covered in the next post in this series. Without history, every failure feels brand new.
Build a check log you can audit later
A check that prints to the screen and vanishes is only half a check. Write a log table, or a CSV file that you only ever add to, with enough columns to reconstruct a Monday morning:
| Column | Why it exists |
|---|---|
checked_at_utc | When the suite ran |
dataset_name | What object was tested |
check_name | A stable ID, not a sentence that changes weekly |
status | PASS, WARN, FAIL |
measured_value | The number you computed |
threshold_text | The rule in plain words |
detail | Short free text for debugging |
owner | Who gets the first ping |
That log is how you prove the dashboard was green when leadership took a screenshot, or red when someone shipped anyway. It also feeds the scorecard in the next post without any heroic digging.
Sampling and volume: when full scans hurt
On huge tables, counting distinct values across the whole table every day can be expensive. You can stay honest without overloading the warehouse:
- Run heavy uniqueness checks on the rolling last 7 to 30 days, plus a weekly full scan if needed.
- Filters on
order_dateor load date, so checks touch only the new slices of data. - Use approximate distinct counts only as warnings, never as the only gate that fails a run on financial keys.
- Keep a cheap always-on set of checks, such as row count, freshness, and the empty-value rate on critical columns, separate from deeper weekly audits.
Cost control is part of running quality checks, because a suite that gets switched off after the cloud bill arrives helps nobody.
Alert design for humans
Bad alerts train people to mute you, while good alerts are rare, specific, and actionable.
- Name who is affected: “Sales daily dashboard blocked” beats “check failed.”.
- Include the query or link, so it takes one click to reach the failing number.
- Separate warnings from failures: warn on soft bands, and fail on empty loads and broken keys.
- Deduplicate: send one incident per dataset per morning, not fifty messages for fifty partitions.
- Close the loop: when the problem is fixed, post the recovery so trust rebuilds.
Rule of thumb: If you would not wake someone for it on a Saturday, it is a log line, not a page. If you would stake a quarterly business review on it, it is a gate that should block the data.
Common mistakes
| Mistake | Symptom | Fix |
|---|---|---|
| Only testing in notebooks | Production drifts unnoticed | Schedule the same asserts |
| Thresholds copied from another company | Permanent red or permanent green | Calibrate on your 4 to 8 weeks of history |
| Checking the wrong grain | Duplicate keys that are valid line items | State grain in the check name |
| Comparing raw calendar days | Weekend false alarms | Same weekday or business-day calendar |
| No owner on failure | Alerts rot | Named human or rotation in the log |
| Fixing data only in the BI layer | Two truths forever | Fix upstream or document a controlled exception |
| Hundreds of low-value tests | Alert fatigue | Start with the blamed table’s top five risks |
What “good enough” checks look like for different consumers
Not every table deserves the same gates. Match the strictness of the checks to how much damage a wrong number could do, the same judgment call the foundations series teaches for analysis quality.
| Consumer | Minimum gates | Notes |
|---|---|---|
| Exploratory sandbox extract | Row count > 0, basic type parse | Label as uncertified |
| Team working dashboard | Uniqueness, null rates, freshness | WARN bands OK if owners watch |
| Exec or customer-facing metric | All of the above plus referential and sanity | FAIL blocks publish |
| Finance close input | Strict keys, reconciliations to source totals | Human sign-off may still be required |
| ML training snapshot | Schema drift, null spikes, label leakage checks | Different suite; still automate |
Put the audience in the name of the check suite. A name like “orders_fact_exec_gate” tells a story, and “misc_tests_v3” does not.
Quick recap
- Automated validation is early warning about safety, not a promise of perfect data.
- Start with row counts, uniqueness, null rates, referential integrity, freshness, and wide sanity bands.
- Write checks in SQL or Python, schedule them, and make them fail with clear detail and an owner.
- Respect grain, clocks, and same-weekday comparisons so checks do not cry wolf.
- Keep a log of history, and turn that history into a trust document that others can read.
Series notes: the final post in this series covers a light data quality scorecard, with the dataset, owner, measures, known issues, and next check, so teammates can trust your numbers without any bureaucracy. Company-wide governance still matters later, and this is the hands-on layer you can publish this month.
How to practice this week
- Choose one dataset that feeds a visible dashboard, and write its grain sentence and primary key (the column that should be unique for every row).
- Implement three checks: row count floor, unique key, and freshness on load time.
- Add one referential check to the most important dimension parent.
- Run the suite on purpose against a known bad extract (duplicate a key) and confirm it fails.
- Log the results to a table or CSV with timestamps, and tomorrow add a yesterday-versus-last-week check for one number.
- Tell one stakeholder what green means in plain language, and invite them to trust a red flag more than silence.
More learning paths sit on the Learn hub. If SQL is still rusty, the filtering and aggregation parts of the SQL series are enough to write these queries. If Python is your hammer, keep scripts short and boring like the pipeline habits in Python for analytics.
Sources
Research and further reading used for this article:
- Wang, R. Y., and Strong, D. M. (1996), Beyond Accuracy: What Data Quality Means to Data Consumers: http://mitiq.mit.edu/Documents/Publications/TDQMpub/14_Beyond_Accuracy.pdf
- DAMA NL, Dimensions of Data Quality research: https://www.dama-nl.org/wp-content/uploads/2020/09/DDQ-Dimensions-of-Data-Quality-Research-Paper-version-1.2-d.d.-3-Sept-2020.pdf
- IBM, Data quality dimensions: https://www.ibm.com/docs/en/ws-and-kc?topic=quality-data-dimensions
- Collibra, The 6 data quality dimensions: https://www.collibra.com/blog/the-6-dimensions-of-data-quality
- dbt Labs, About tests: https://docs.getdbt.com/docs/build/tests
- Great Expectations documentation: https://docs.greatexpectations.io/
- Analytics Made Simple, Learn hub: https://analyticsmadesimple.com/learn/
- Analytics Made Simple, Analytics foundations: https://analyticsmadesimple.com/series/analytics-foundations/
- Analytics Made Simple, From spreadsheets to real data: https://analyticsmadesimple.com/series/spreadsheets-to-data/
- Analytics Made Simple, SQL series: https://analyticsmadesimple.com/series/sql/
- Analytics Made Simple, Python for analytics: https://analyticsmadesimple.com/series/python/
- Analytics Made Simple, Data Governance 101: https://analyticsmadesimple.com/key-terms/data-governance/
Keep going
Same lessons in your feed
Short diagrams, hooks, and weekly tutorials on Substack, Instagram, X, and Facebook.