A notebook is good for thinking and a script is good for repeating, and problems start when you use one for the other’s job. Use a notebook while you are still exploring, and turn the work into a script once other people depend on the result. This post shows how to make that move and how to share the result so a teammate can run it without calling you.
Two kinds of Python files float around most analytics teams. One is a notebook saved late at night after a great analysis, full of plots, half-run cells, and a note that says “final??”. The other is a short .py script that nobody loves to open, but it runs the same way every Monday and nobody argues about which version is real. Both are useful. Confusing them is expensive.
This is the close of the Python for analytics series, after loading, cleaning, joining, and charting data. The last skill is packaging, which means knowing when to stay in a notebook, when to move to a script, and how to share your work.
Notebook or script: which to use when
Example:
Two tools, two jobs
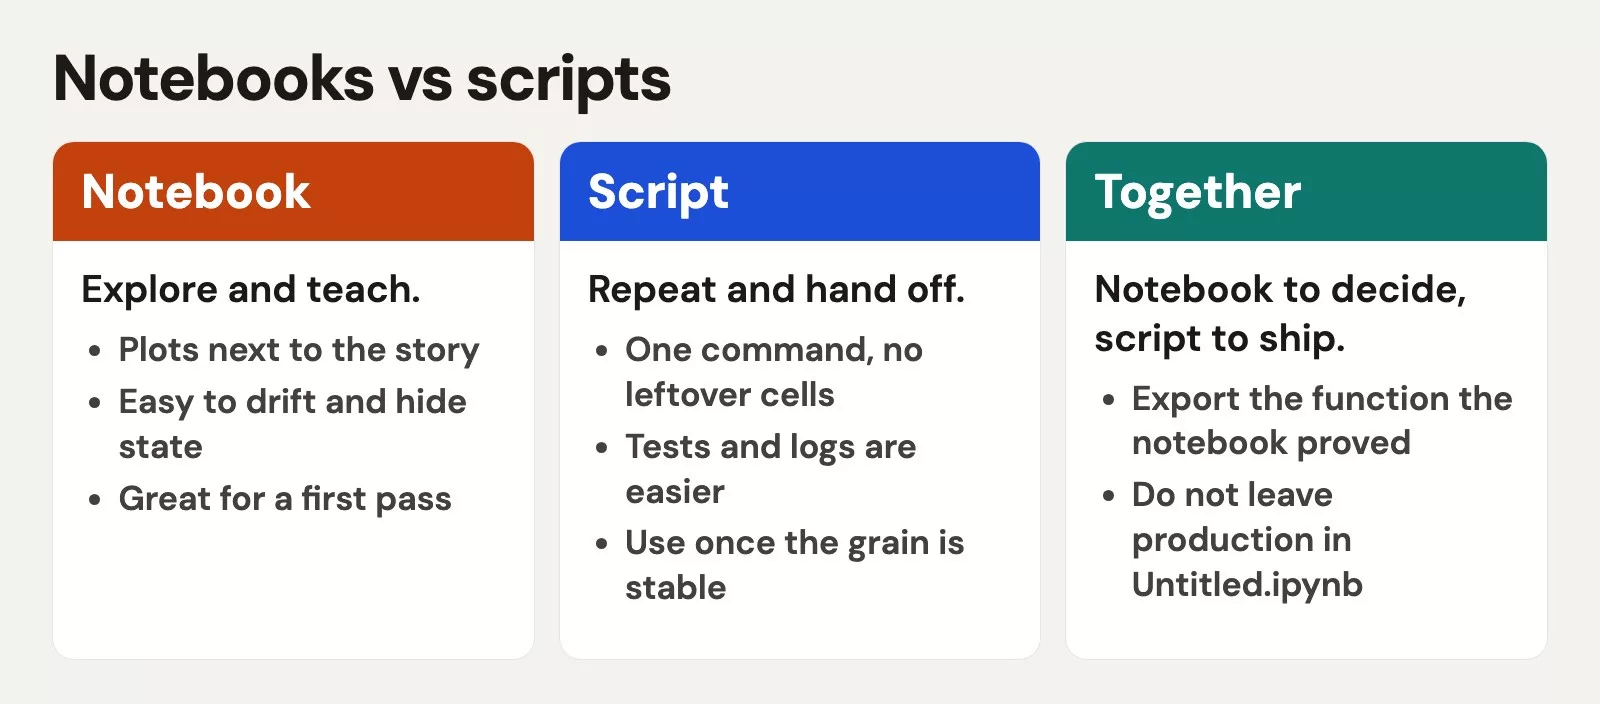
A notebook (Jupyter, VS Code notebooks, and similar tools) mixes explanations, code, and results in one document. You run it one cell at a time, the order can get tangled, and the computer keeps leftover variables in memory. That is perfect for thinking out loud with data.
A script is a plain .py file that runs from top to bottom, or from a clear main function. It has no hidden cell state, so it suits jobs you will run again, schedule, or hand to someone who does not want a tour of your rabbit holes.
| Need | Prefer notebook | Prefer script |
|---|---|---|
| First look at a new extract | Yes | Later |
| Teaching a teammate the logic | Yes | Maybe with comments |
| Weekly job every Monday | Risky | Yes |
| Scheduled or automated run | Usually no | Yes |
| Lots of charts while exploring | Yes | Export later |
| Code review in git | Messy diffs | Cleaner |
| One-off stakeholder question | Often fine | Overkill |
Rule of thumb: If you have run it more than twice and someone else depends on the output, start a script.
Why notebooks go wrong, even good ones
Notebooks do not fail because they are bad. They fail because they hide the process that produced the result. These are the usual problems:
- Out-of-order cells: You fix cell 12, forget to re-run cell 3, and the chart shows old filters without telling you.
- Hidden state: A variable that you renamed in one place still exists under the old name in memory.
- Unclear inputs: The CSV path only works on the Desktop folder of your own laptop.
- Giant output blobs: They are hard to review in git, the version-history tool, and it is easy to ship stale plots.
- No single starting point: “Which cell do I run?” is not a set of instructions anyone can follow.
None of this means you should never use a notebook. It means you should not confuse a thinking document with a path other people depend on. That is the same lesson as spreadsheets turning into liabilities in the series on moving from spreadsheets to real data, where tools that start out personal eventually need habits that work for a team.
Why scripts go wrong, even good ones
Scripts can fail in the opposite direction, and these are the common ways:
- No story: Six months later you forget why a filter exists.
- Over-building early: Classes and settings files appear for a job that is only 40 lines long.
- Silent failures: with no printed checks, a CSV with zero rows can look like a success.
- Hard-coded secrets: Passwords written inside the file are something you should never do.
A good analytics script is boring. It has clear inputs, clear outputs, a few printed checks, and comments wherever a business rule is not obvious. Boring is the goal. You already practiced that shape in the earlier post on building a cleaning pipeline.
A graduation path that works at work
Six steps from explore to handoff:
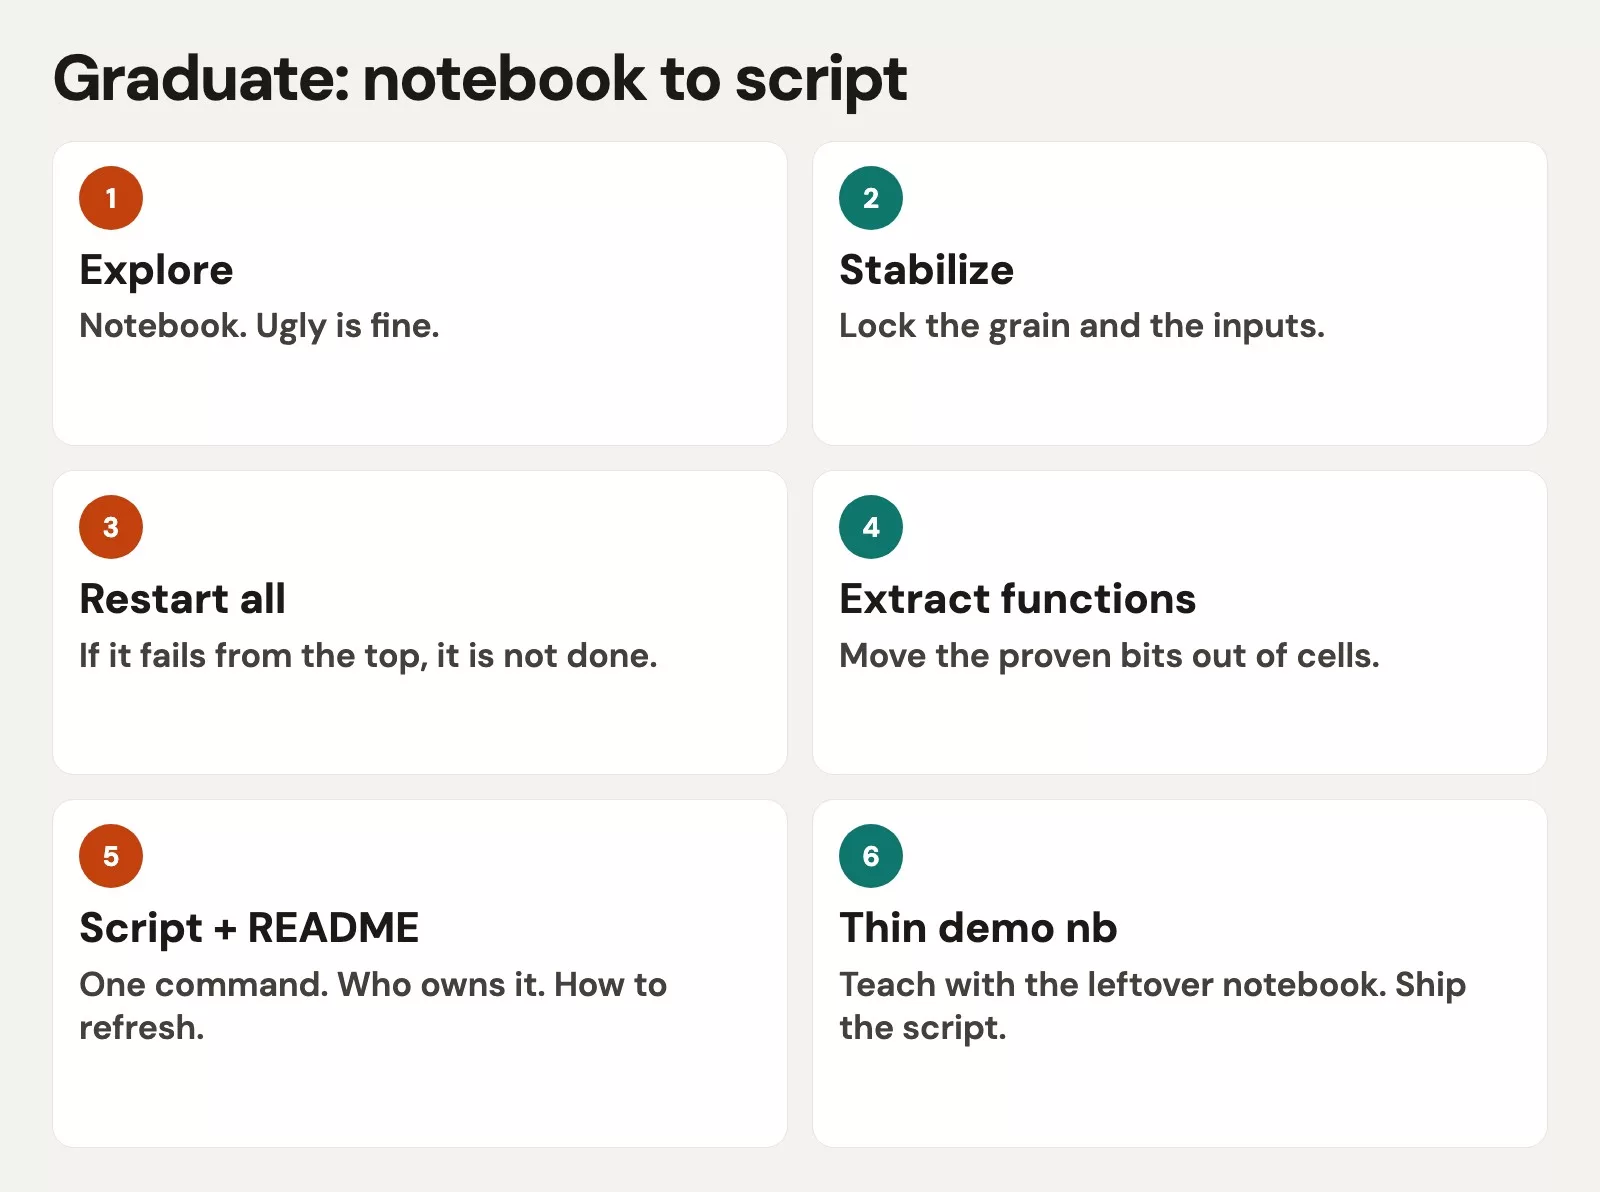
Move in stages. Do not jump from first curiosity to a full platform project.
- Explore in a notebook: Load the data, profile it, plot it, and take notes.
- Stabilize the logic: Collapse the dead ends and keep only the cells that matter.
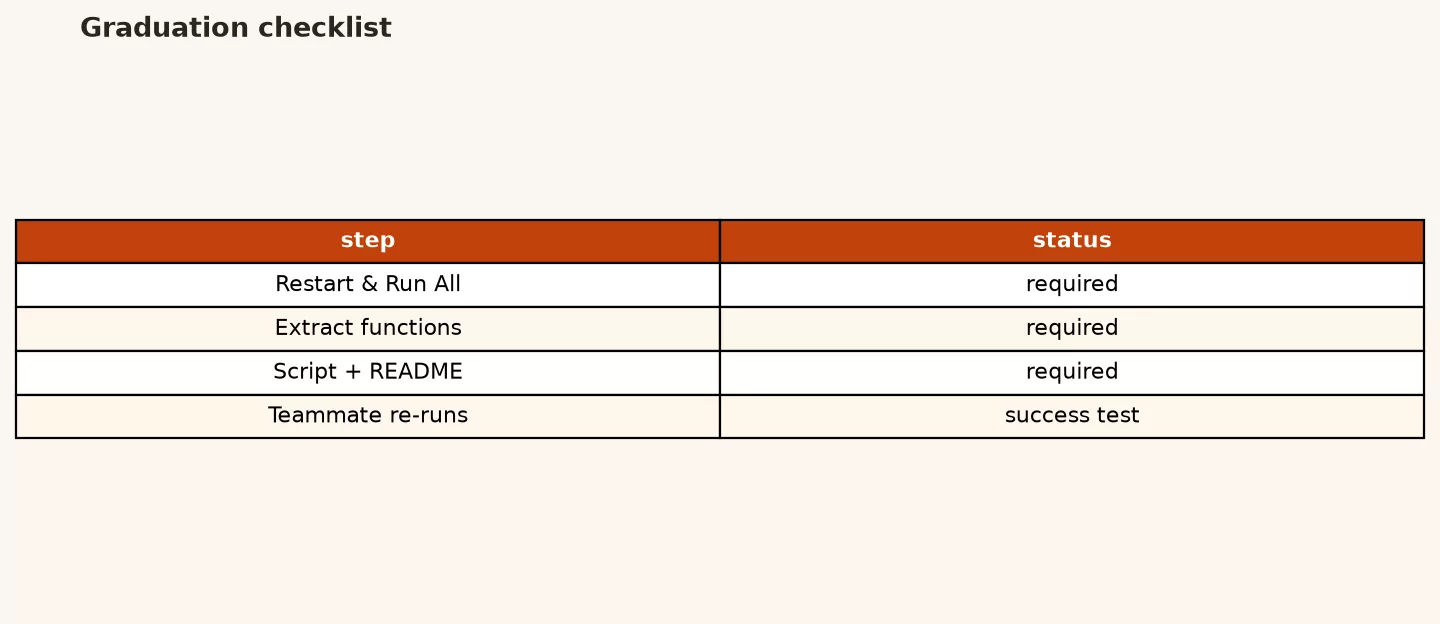
- Restart and run all: If that fails, the notebook is not ready to be shared as the truth.
- Extract functions for loading, cleaning, summarizing, and exporting.
- Move the functions into a
.pymodule or a single script withif __name__ == "__main__":. - Keep a thin notebook only if you still need a teaching demo that imports the module.
That last step is underrated. You can still teach with a notebook while the real job lives in a script, because teaching and running are different products.
Minimal project shape
What the folder looks like in practice:
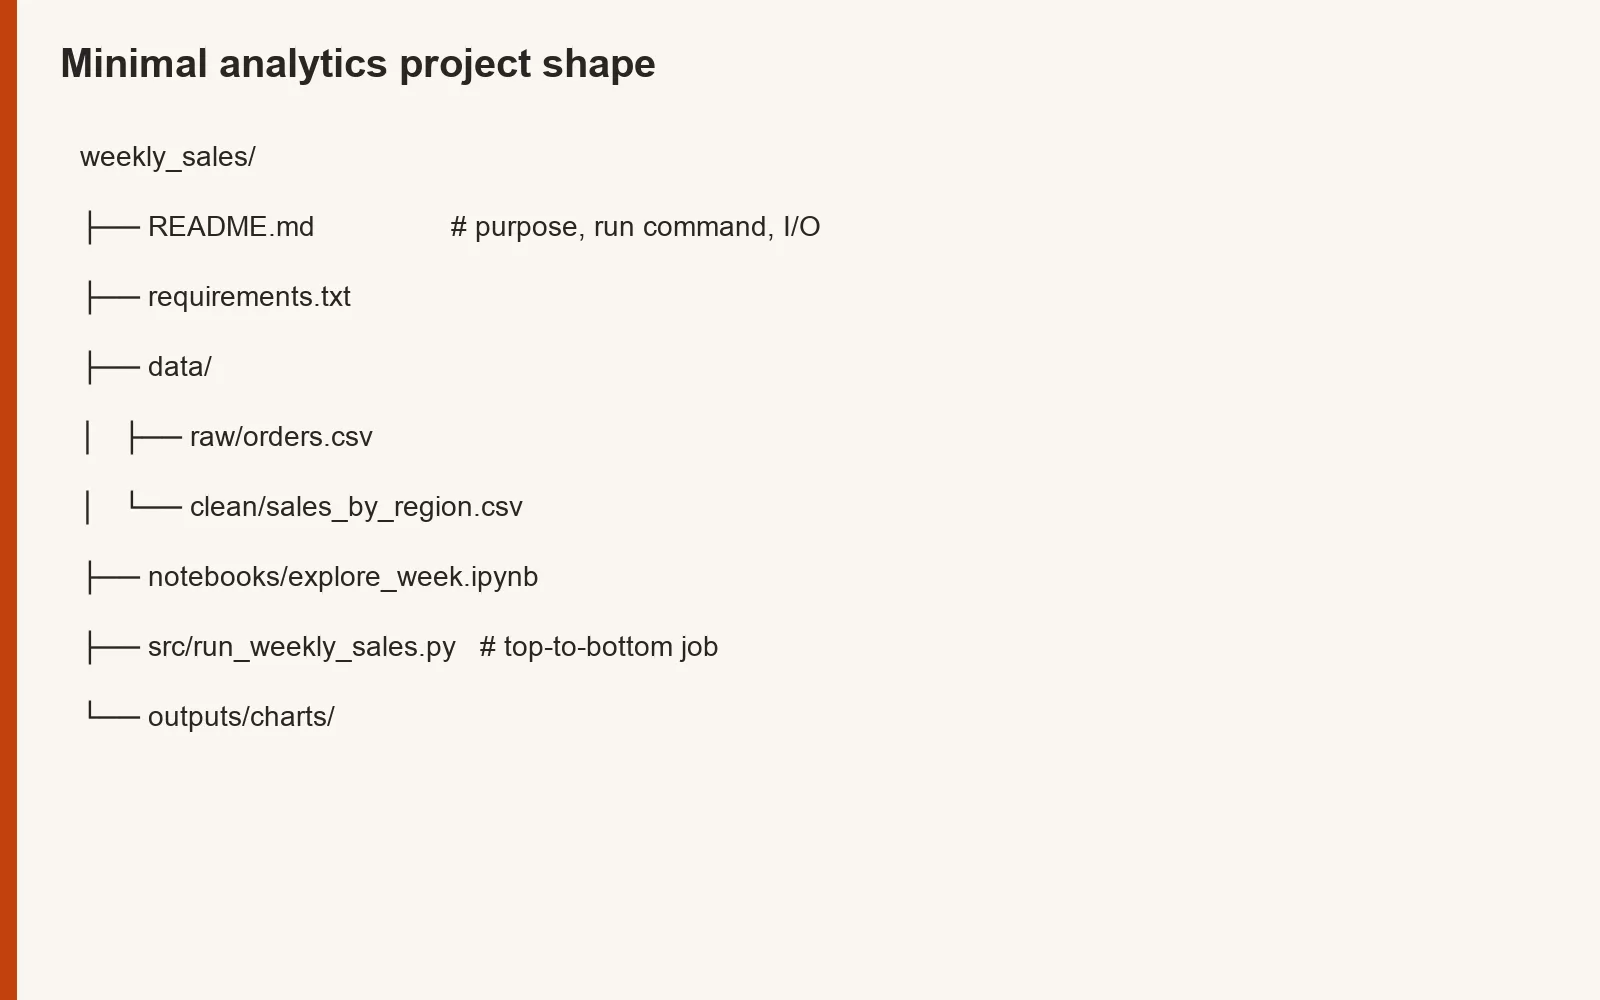
You do not need a giant shared code repository. You need a folder that a teammate can open without digging around.
weekly_sales/
  README.md
  requirements.txt
  data/
    raw/           # inputs you do not edit by hand
    clean/         # outputs of the pipeline
  notebooks/
    explore_week.ipynb
  src/
    run_weekly_sales.py
  outputs/
    charts/
The README.md file should answer four questions in under one screen:
- What decision or report this is for
- Which file to run
- What inputs it expects
- What outputs you should see
That is a lightweight version of the table contract idea from the spreadsheet series. You write down what one row means, who owns the file, and what comes out, so the next person is not reverse engineering your work.
Script pattern you can copy
Example:
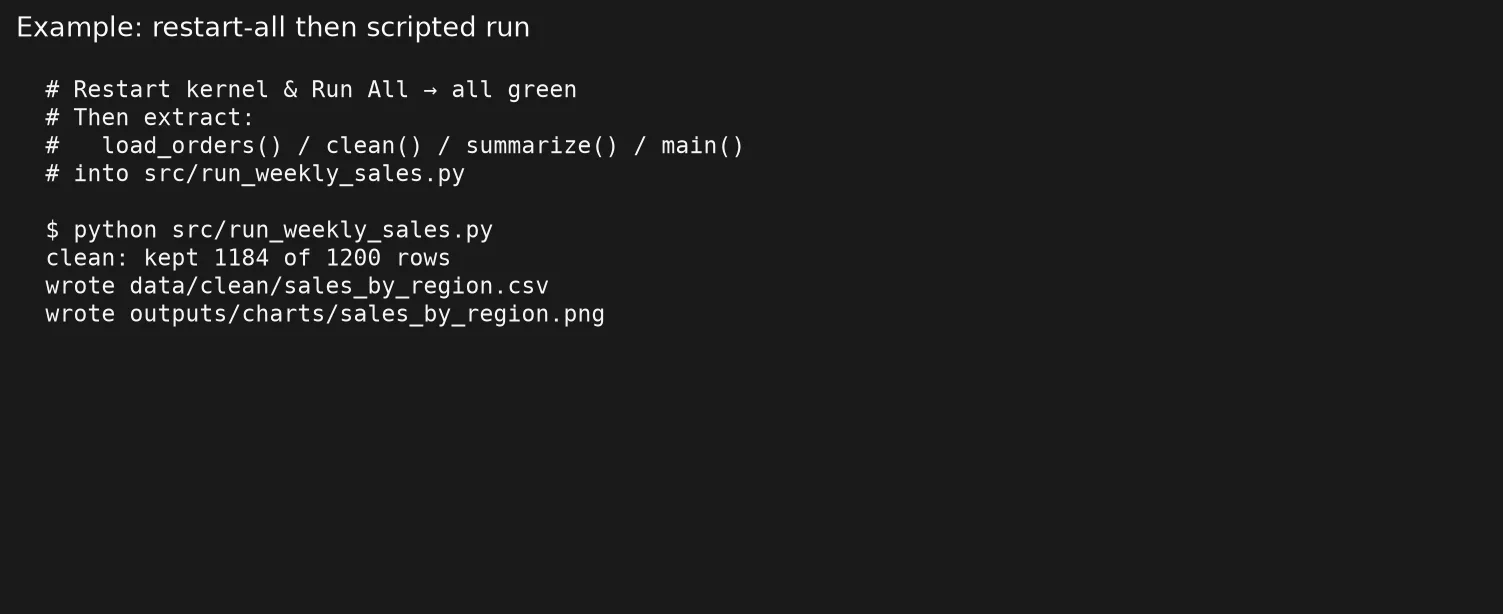
Example console output when the job runs cleanly:
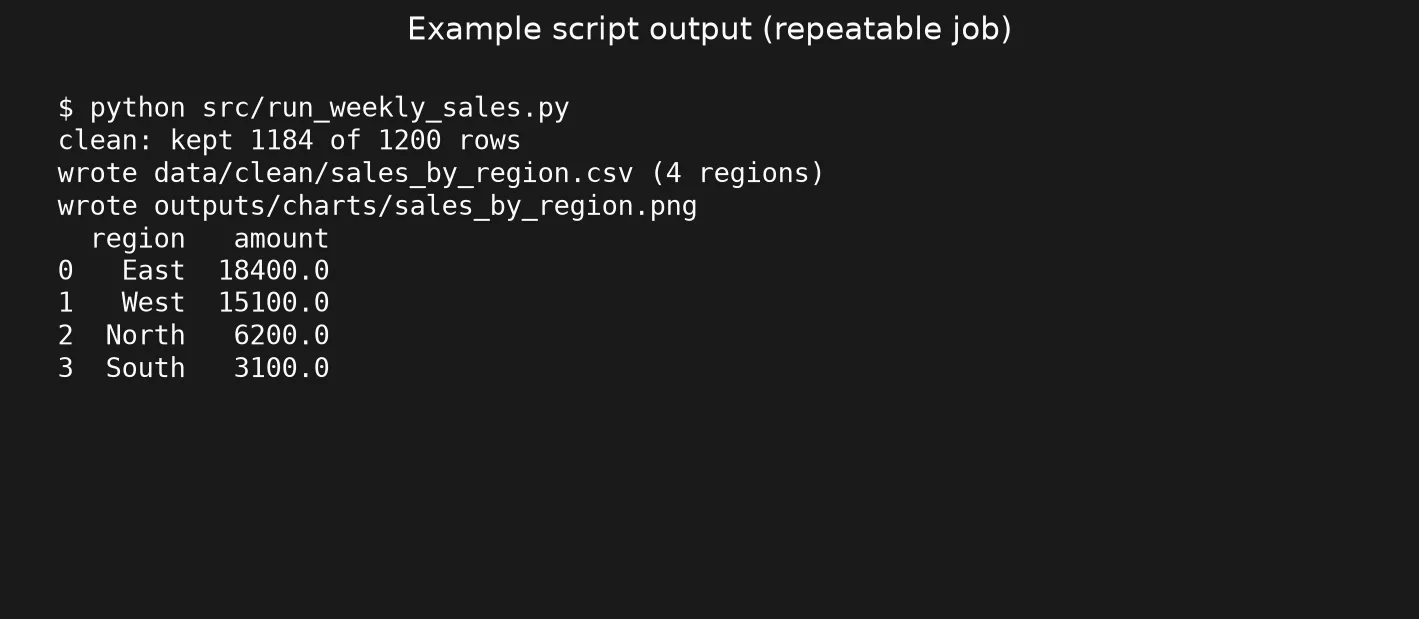
Here is a small script shape that puts together the earlier posts on loading, cleaning, summarizing, charting, exporting, and validating:
"""Weekly sales summary.

Run:
  python src/run_weekly_sales.py

Inputs:
  data/raw/orders.csv
Outputs:
  data/clean/sales_by_region.csv
  outputs/charts/sales_by_region.png
"""

from pathlib import Path
import pandas as pd
import matplotlib.pyplot as plt

ROOT = Path(__file__).resolve().parents[1]
RAW = ROOT / "data" / "raw" / "orders.csv"
OUT_CSV = ROOT / "data" / "clean" / "sales_by_region.csv"
OUT_CHART = ROOT / "outputs" / "charts" / "sales_by_region.png"


def load_orders(path: Path) -> pd.DataFrame:
    df = pd.read_csv(path)
    expected = {"region", "amount", "order_date"}
    missing = expected - set(df.columns)
    if missing:
        raise ValueError(f"Missing columns: {sorted(missing)}")
    return df


def clean(df: pd.DataFrame) -> pd.DataFrame:
    out = df.copy()
    out["amount"] = pd.to_numeric(out["amount"], errors="coerce")
    out["order_date"] = pd.to_datetime(out["order_date"], errors="coerce")
    out["region"] = out["region"].astype(str).str.strip()
    before = len(out)
    out = out.dropna(subset=["amount", "order_date", "region"])
    print(f"clean: kept {len(out)} of {before} rows")
    return out


def summarize(df: pd.DataFrame) -> pd.DataFrame:
    return (
        df.groupby("region", as_index=False)["amount"]
        .sum()
        .sort_values("amount", ascending=False)
    )


def save_chart(summary: pd.DataFrame, path: Path) -> None:
    path.parent.mkdir(parents=True, exist_ok=True)
    ax = summary.plot(
        kind="bar",
        x="region",
        y="amount",
        legend=False,
        color="#c2410c",
        figsize=(8, 4.5),
    )
    ax.set_title("Sales by region (weekly run)")
    ax.set_xlabel("Region")
    ax.set_ylabel("Sales amount (USD)")
    ax.tick_params(axis="x", rotation=0)
    plt.tight_layout()
    plt.savefig(path, dpi=160)
    plt.close()
    print(f"wrote chart {path}")


def main() -> None:
    OUT_CSV.parent.mkdir(parents=True, exist_ok=True)
    orders = clean(load_orders(RAW))
    summary = summarize(orders)
    if summary.empty:
        raise SystemExit("No rows after clean; refusing to write empty success")
    summary.to_csv(OUT_CSV, index=False)
    print(f"wrote {OUT_CSV} ({len(summary)} regions)")
    save_chart(summary, OUT_CHART)
    print(summary)


if __name__ == "__main__":
    main()
These features are worth copying even if your field is different:
- A docstring, which is a note at the top of the file, with the run command and the inputs and outputs
- Paths relative to the project folder, not to your home folder
- A column check when the data loads
- Printed counts that show how many rows survived each step
- A hard failure when an empty result would otherwise pass as a success
plt.close(), so batch runs do not leak memory from figures
Notebook etiquette when you still need one
If the deliverable is a teaching notebook or a research log, raise the bar with these habits:
- Put the purpose, inputs, outputs, and owner name or team in the top cell.
- Use a virtual environment, an isolated set of installed packages, and pin its versions in
requirements.txt. - Choose Restart kernel and run all before you share, since the kernel is the engine that runs your cells.
- Clear giant unused outputs if the file has to live in git.
- Import shared logic from
src/instead of pasting the same cleaning steps into five notebooks.
# notebooks/explore_week.ipynb (conceptually)
# Cell 1
# Purpose: explore anomalies before the Monday scripted run
# Input: data/raw/orders.csv
# Owner: analytics team

import sys
from pathlib import Path
ROOT = Path("..").resolve()
sys.path.append(str(ROOT / "src"))

# If you later move clean() into a module, import it:
# from run_weekly_sales import load_orders, clean
Sharing with teammates without drama
| Share method | Works when | Watch out |
|---|---|---|
| Repo + README + requirements | Team uses git | Secrets, huge data files |
| Script + sample CSV | Small handoff | Sample that does not match what a row means in the real data |
| Exported HTML notebook | Read-only story | Not re-runnable easily |
| Scheduled job + output folder | Recurring report | Who owns failures? |
| Screenshot only | Never, almost | No definition of what a row means, no way to refresh |
Pair the share with the handoff habits from the earlier post on handing off analysis. Say what file you are sending, what one row means, what timestamp applies, and what known caveats exist. Python does not remove the need for that note, and it makes the path repeatable once you write the note down.
Where SQL still fits
As the earlier post on using Python with SQL explained, heavy filters and governed totals often stay in SQL. Your script can still be the conductor that ties the pieces together:
- SQL, or a warehouse job, produces a clean extract.
- A Python script loads the extract, adds light polish, draws the chart, and exports the result.
- A notebook is used only for investigations when the extract looks strange.
That division keeps the expensive computing where it belongs, and it keeps your Python layer small enough to reason about. Small is easier to trust.
Common mistakes
- Shipping a notebook as the production job because “it already works.”
- Never restarting the kernel before you trust the outputs.
- Absolute paths such as
/Users/you/Downloads, which break on any other computer. - No requirements file, so teammates install mystery package versions.
- Copy-pasted cleaning steps across six notebooks until one of them drifts.
- Empty success, where the script writes outputs even when the filters wipe out every row.
- Treating scripts as unreadable: Comments that explain business rules are a kindness to the next reader.
How to practice on Monday morning
- Pick one analysis you repeated this month in a notebook.
- Restart the kernel, run all, and fix whatever breaks.
- Extract the loading, cleaning, and summarizing steps into functions.
- Move them into a
.pyscript that uses a path relative to the project folder. - Write a five-line
README.mdwith the purpose, the run command, the inputs, and the outputs. - Have a teammate run it once without you in the room, and note every place they get stuck.
Where the Python series leaves you
Across the whole series you built a full path from beginner to working analyst, and it covered these skills:
- When Python is worth it, and when Sheets or SQL win
- A calm setup, with tables loaded as DataFrames, meaning tables inside Python
- Selecting, filtering, sorting, grouping, and joining
- Handling missing data, building cleaning pipelines, and exporting results
- Using Python with SQL, then plots, then packaging
You do not need to become a software engineer to be dangerous, in the good way, with data. You need habits: knowing what one row means, checking your joins, drawing honest charts, and leaving a run path someone else can follow. For more paths on the site, start at the Python series page and the Learn page. The next arc in the content plan is data quality, if you want the sequel on why numbers fight each other.
Quick recap
- Notebooks explore and teach, while scripts repeat and hand off.
- Graduate by restarting and running everything, then extracting functions.
- Small project folders beat mystery Desktops.
- Document the purpose, the run command, the inputs, and the outputs.
- Make the script fail loudly on empty or invalid results.
Sources
Research and further reading used for this article:
- Jupyter Project documentation (notebooks as computational documents)
- Python modules tutorial (scripts, imports,
__main__) - pip requirements files (pinning dependencies for teammates)
- matplotlib: save and close figures (batch-friendly plotting)
- Analytics Made Simple: Python for analytics
- Analytics Made Simple: Learn
Keep going
Same lessons in your feed
Short diagrams, hooks, and weekly tutorials on Substack, Instagram, X, and Facebook.