A notebook with forty cells, half of them run out of order, three of them commented “DO NOT RERUN,” and a final number nobody can reproduce on a clean kernel is not analysis. It’s performance art: the audience claps once, and the encore fails every time.
By now you can filter, group, merge, and clean missing values in pandas. This post strings those moves into a light cleaning pipeline: a short chain of small steps that runs top to bottom and leaves a trail a colleague can follow without holding a séance.
Reproducibility is a kindness, not a personality type
You do not need a ten-service platform to be reproducible. You need a file that, given the same inputs, produces the same outputs when run from the top. That standard is how you sleep before a board meeting. It is also how you hand work to a teammate without narrating every click.
If you lived through fragile spreadsheet chains in the From spreadsheets to real data series, this is the Python version of the same lesson: one path, one order, one definition of clean. The foundations habit from Analytics foundations still applies too, since you need to know the question before you polish columns for sport.
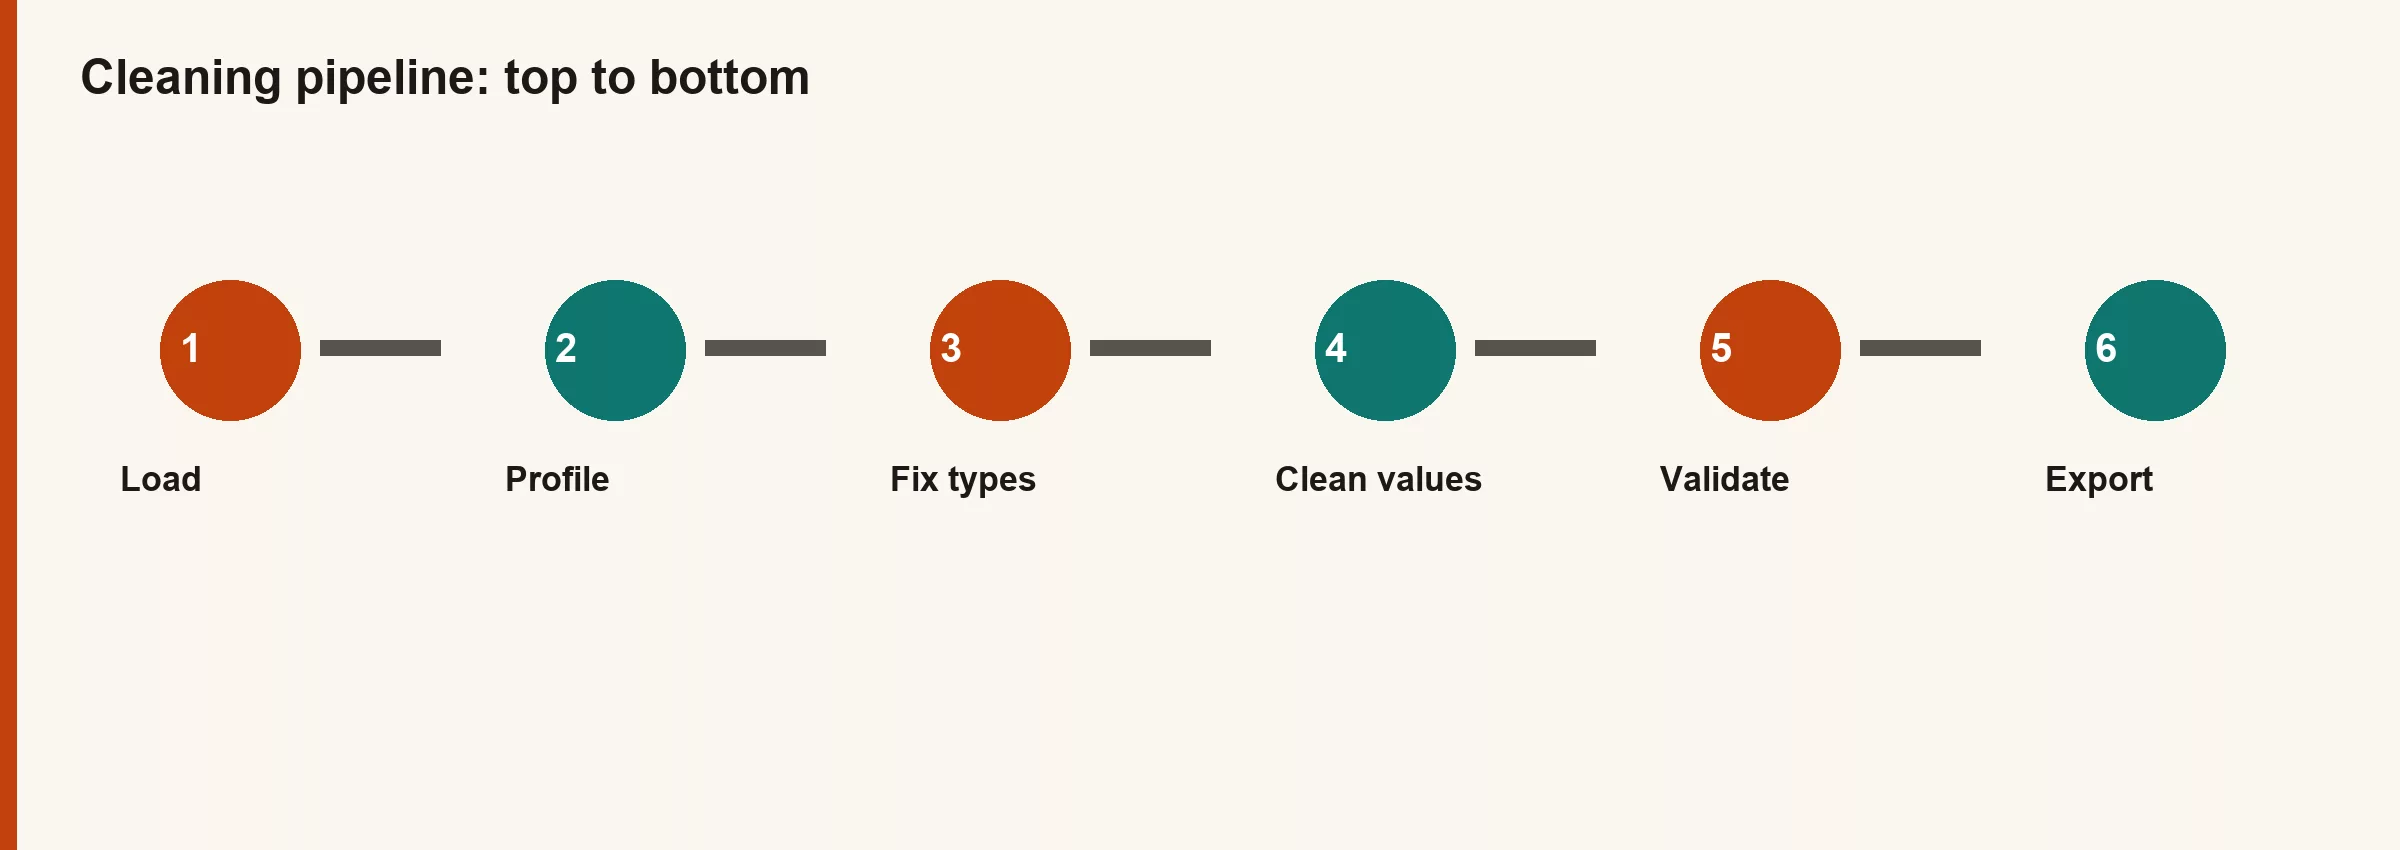
The diagram is intentionally boring, with arrows pointing in one direction only, because boring is the point. Clever branching notebooks are where metrics go to mutate.
Design rules for a light pipeline
Example:
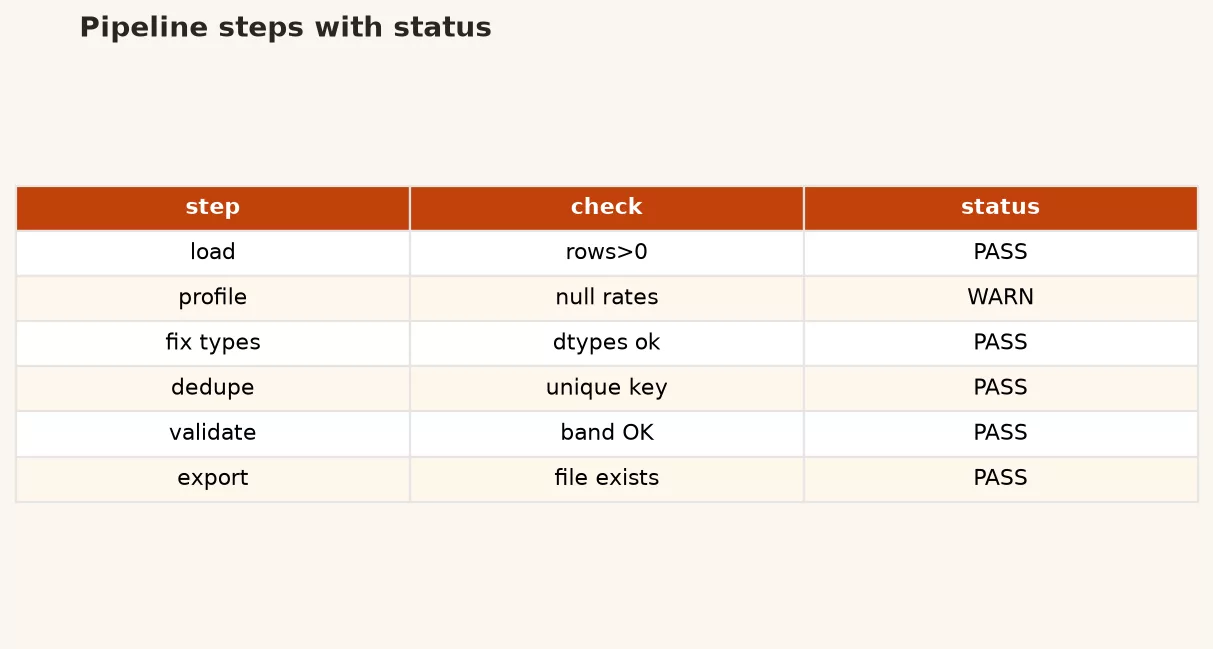
- One direction. Raw data goes in at the top, and clean frames and summaries come out at the bottom; you never edit an earlier cell once you already have a final number.
- Small steps. Each function does exactly one job: rename, convert types, filter out test rows, or aggregate.
- Visible checks. Print row counts, null rates, and a few assertions after any risky step.
- No silent globals. Pass DataFrames into functions and return new ones, instead of depending on a cell you happened to run yesterday.
- Explicit inputs. The path, sheet name, filter date, and business rules all live in a small config block at the top.
These rules scale from a 40-line notebook to a modest script, and you can grow into packaging later. First, earn the right to be fancy by being clear.
The four stages
1. Load
Read the raw file once, and don’t clean inside the read call itself beyond basic options like encoding or the separator character. Keep a raw frame you never overwrite, if you can afford the memory, so you have a before-and-after story when someone asks why a row disappeared.
2. Clean
Rename columns, normalize blanks, convert data types, map sentinel values, strip keys, and drop pure junk rows, for example the total rows a spreadsheet sometimes exports by accident. This is the renaming and type-fixing work from earlier posts, applied here as functions instead of improvised on the fly.
3. Validate
Assert the things that must be true for the analysis to mean anything: primary key uniqueness if you’re claiming it, no negative quantities where that’s impossible, a date range inside the expected window, join fanout under a threshold. Fail loud.
4. Summarize
Only after validation do you groupby, pivot, or build chart-ready aggregates. Summaries are outputs, not places to hide cleaning.
Worked example: a mini pipeline
Imagine a weekly orders export with the usual drama: mixed types, a sentinel value (a placeholder number like -999 that really means “missing”), a blank region, and a header row that includes a stray total line copied out of a spreadsheet. We’ll keep the example small enough to run through in your head.
import pandas as pd
from pathlib import Path

# --- config (edit only this block for a new week) ---
INPUT_PATH = Path("data/orders_raw.csv")
AS_OF = "2024-06-30"
MIN_AMOUNT = 0

def load_orders(path: Path) -> pd.DataFrame:
    df = pd.read_csv(path)
    print(f"loaded rows={len(df)} cols={list(df.columns)}")
    return df

def clean_orders(df: pd.DataFrame) -> pd.DataFrame:
    out = df.copy()

    # Standard names
    out = out.rename(
        columns={
            "Order ID": "order_id",
            "Customer ID": "customer_id",
            "Order Date": "order_date",
            "Amount": "amount",
            "Region": "region",
        }
    )

    # Drop spreadsheet total rows if present
    out = out[out["order_id"].astype(str).str.lower() != "total"]

    # Text nulls
    out["region"] = out["region"].replace(r"^\s*$", pd.NA, regex=True)
    out["region"] = out["region"].replace({"Unknown": pd.NA, "N/A": pd.NA})

    # Types
    out["amount"] = pd.to_numeric(out["amount"], errors="coerce")
    out.loc[out["amount"] == -999, "amount"] = pd.NA
    out["order_date"] = pd.to_datetime(out["order_date"], errors="coerce")
    out["customer_id"] = out["customer_id"].astype("string").str.strip()

    print(
        "after clean",
        f"rows={len(out)}",
        f"amount_nulls={out['amount'].isna().sum()}",
        f"date_nulls={out['order_date'].isna().sum()}",
    )
    return out

def validate_orders(df: pd.DataFrame, as_of: str, min_amount: float) -> pd.DataFrame:
    out = df.copy()
    as_of_ts = pd.Timestamp(as_of)

    # Required fields for this analysis
    before = len(out)
    out = out.dropna(subset=["order_id", "customer_id", "order_date", "amount"])
    dropped = before - len(out)
    print(f"dropped incomplete rows={dropped}")

    if out["order_id"].duplicated().any():
        raise ValueError("order_id is not unique after clean")

    if (out["amount"] < min_amount).any():
        bad = (out["amount"] < min_amount).sum()
        raise ValueError(f"found {bad} rows below min_amount={min_amount}")

    if out["order_date"].max() > as_of_ts:
        raise ValueError("order_date contains values after AS_OF")

    print(f"validated rows={len(out)}")
    return out

def summarize_orders(df: pd.DataFrame) -> pd.DataFrame:
    summary = (
        df.groupby("region", dropna=False, as_index=False)
        .agg(
            orders=("order_id", "count"),
            revenue=("amount", "sum"),
            customers=("customer_id", "nunique"),
        )
        .sort_values("revenue", ascending=False)
    )
    print(summary)
    return summary

def run_pipeline(path: Path = INPUT_PATH) -> tuple[pd.DataFrame, pd.DataFrame]:
    raw = load_orders(path)
    clean = clean_orders(raw)
    good = validate_orders(clean, AS_OF, MIN_AMOUNT)
    summary = summarize_orders(good)
    return good, summary

# On a fresh kernel, one call:
# clean_df, region_summary = run_pipeline()
Example:
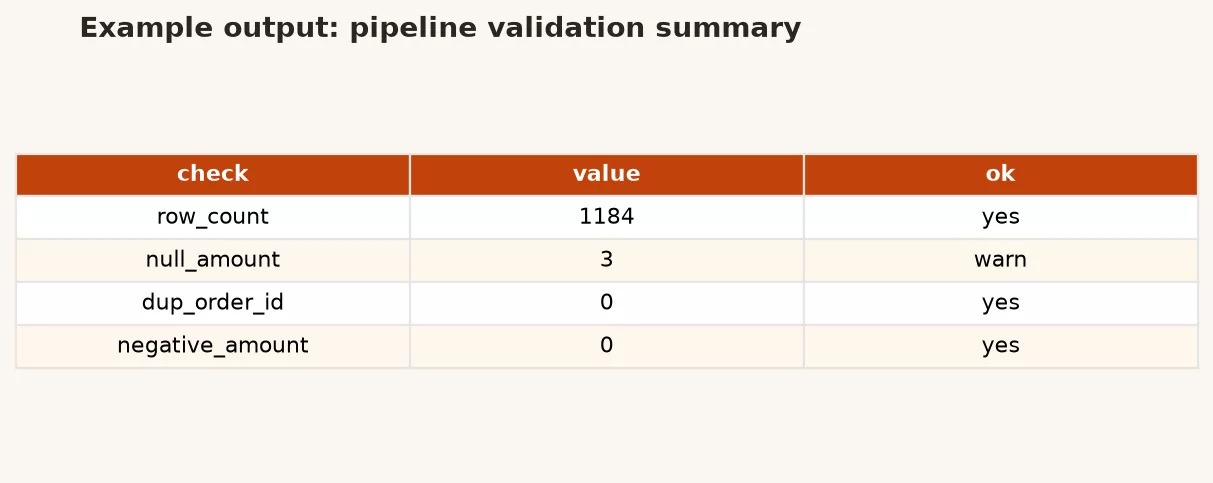
Example output:
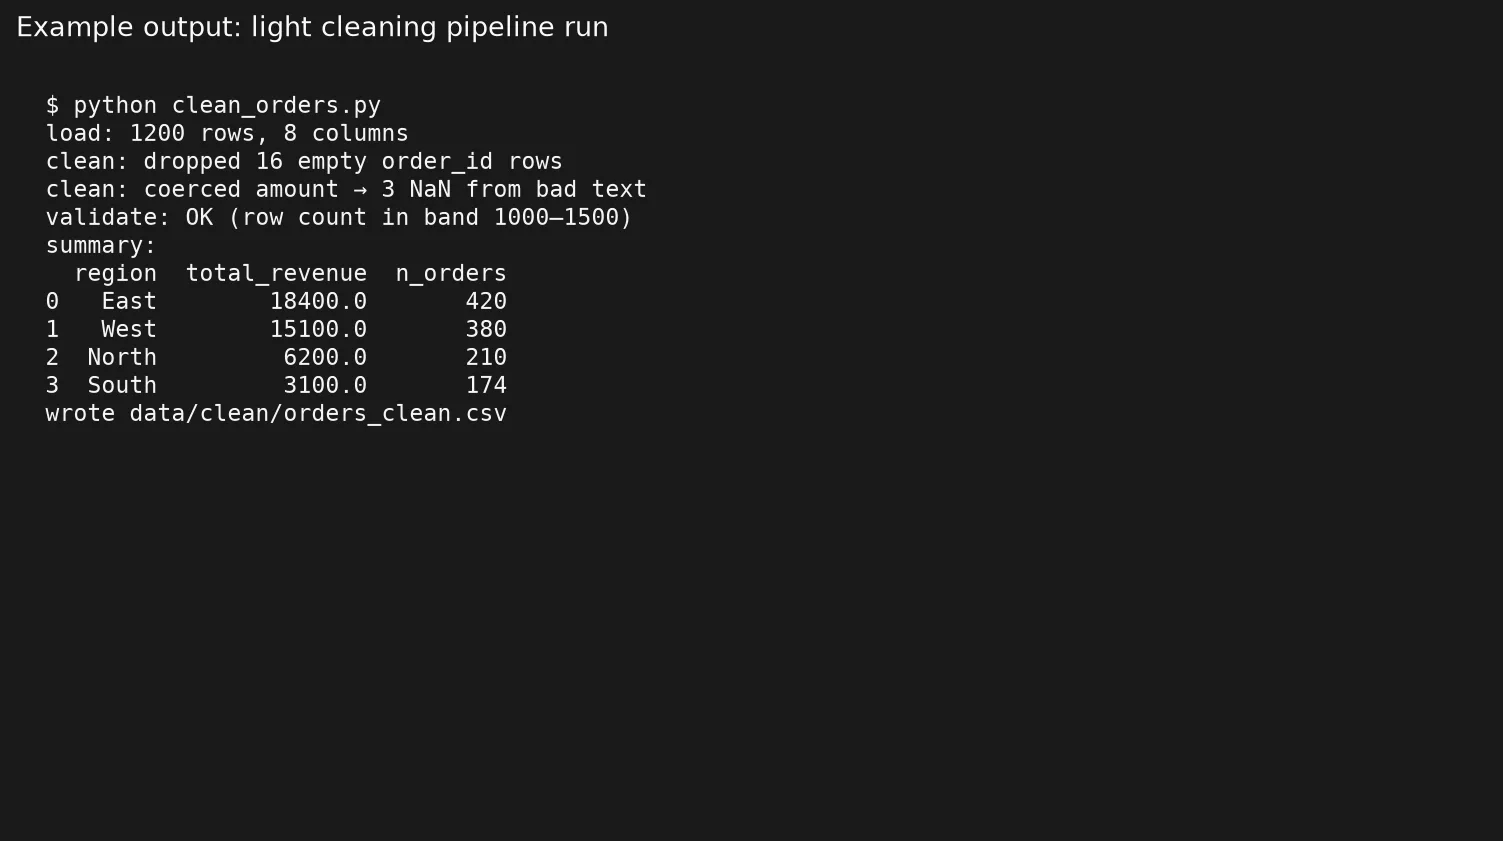
Even if you paste this into a notebook, treat run_pipeline() as the only cell that has to succeed from a cold start, along with your imports and config. Everything else is just definition. That structure is how you avoid the “works on my kernel” trap.
Inline demo without a file
If you want to practice without reading and writing an actual CSV file, build a raw frame directly and pass it through the same clean and validate functions, adjusting the load step as needed. Here is a tiny raw sample that mimics typical export mess:
raw = pd.DataFrame(
    {
        "Order ID": [101, 102, 103, "Total"],
        "Customer ID": [" 1 ", "2", "2", ""],
        "Order Date": ["2024-06-01", "2024-06-15", "not a date", ""],
        "Amount": ["40", "12.5", "-999", "52.5"],
        "Region": ["East", "", "West", ""],
    }
)

clean = clean_orders(raw)
# Expect: total row gone, amounts numeric, -999 becomes NA, blank region NA
print(clean)
When you later enable validate_orders, the bad date row should drop via dropna(subset=...), and you should see the drop count printed. That print isn’t noise; it’s the audit trail.
Pipeline checklist
| Stage | Must have | Done? |
|---|---|---|
| Config | Paths, as-of date, business thresholds in one place | |
| Load | Row/column print; raw preserved if possible | |
| Clean | Renames, nulls, dtypes, sentinels; no aggregates yet | |
| Validate | Assertions on keys, ranges, fanout; fail loud | |
| Summarize | Metrics only after validation | |
| Rerun test | Restart kernel / new process; run top to bottom once | |
| Handoff note | What one row means; known drops; as-of timestamp |
Print this checklist and pin it in your team wiki if that helps, or just use a sticky note. The ritual matters more than the tool.
Functions over mystery cells
Notebooks are excellent for exploration, but they’re dangerous as unreviewed production code. A few habits cut down the drama:
- Put your imports and config first.
- Put your pure functions next.
- Put a single orchestration call near the end.
- Keep charts after the numbers already exist, not interleaved with steps that are still changing the data.
- If you want to experiment, copy the code into a clearly marked scratch section, or use a separate exploratory notebook.
When the same pipeline needs to run on a schedule, move the functions into a .py file and call them from the notebook, or from a job runner instead. That move is much easier if you never relied on cell-order magic to begin with.
What “done” looks like for a weekly pipeline
A pipeline is done for the week when a cold run produces the same summary you would defend in a meeting, and when a teammate can find the input path, the as-of date, the drop counts, and the output files. That bar is lower than “fully automated on Kubernetes” and higher than “I clicked Run All once on Friday and it looked fine.”
If your team is small, store the notebook or script next to a one-page runbook: where the raw file lands, who drops it, what time you run, where outputs go, and who gets pinged when validation fails. The runbook is part of the pipeline. Code without operational notes becomes folklore.
When validation fails, resist the urge to comment out the assert so you can ship. Fix the data, widen the rule with an explicit documented exception, or ship a partial result with a loud caveat. Silent assert removal is how wrong numbers become tradition.
Common mistakes
- Cleaning in place across ten cells, so a second run double-filters or double-fills the data.
- Validating only the happy path, using rows you hand-picked instead of the actual messy export.
- Hiding filters inside a groupby without printing how many rows are left afterward.
- Changing business rules partway through the notebook, after stakeholders already saw a number based on the old rule.
- Skipping the as-of date, so “weekly” ends up meaning whatever happened to be sitting on disk that day.
- Copy-pasting the pipeline into five different notebooks that slowly drift apart; prefer one shared module once the team is ready for it.
Practice and next step
Take last week’s real export, and write four functions using the names above, even if the bodies stay short at first. Restart your environment, and run only the orchestration call. If it fails, that’s good news, because you just found the hidden dependency. Keep fixing until the cold start works cleanly.
Quick recap
- A light pipeline runs load, clean, validate, and summarize, all in one direction.
- Functions and a config block at the top beat mystery cells and hidden kernel state.
- Print the row losses and assert your invariants; fail loudly the moment the grain breaks.
- A cold-start rerun is the real test of whether something is reproducible.
- Summaries come last, so cleaning never hides inside a chart.
Series notes
This is Part 8 of the Python for analytics series. The next post covers exporting results and handing them to humans and BI tools without losing data types or context, and for SQL-shaped validation checks you already know, the SQL series covers the same ground from that side. More learning paths live on the Learn hub.
Sources
- pandas I/O tools (CSV): https://pandas.pydata.org/docs/user_guide/io.html
- Python tutorial, defining functions: https://docs.python.org/3/tutorial/controlflow.html#defining-functions
- pandas groupby user guide: https://pandas.pydata.org/docs/user_guide/groupby.html
- Analytics Made Simple, spreadsheets series: https://analyticsmadesimple.com/series/spreadsheets-to-data/
- Analytics Made Simple, Learn hub: https://analyticsmadesimple.com/learn/
Keep going
Same lessons in your feed
Short diagrams, hooks, and weekly tutorials on Substack, Instagram, X, and Facebook.