
Your boss pings late in the afternoon: “Can you pull the numbers on churn real quick? Leadership wants to ‘be data-driven’ in tomorrow’s standup.” You open three dashboards, two spreadsheets, and a SQL client. Two hours later you have four different churn numbers, none of which match last quarter’s board slide, and a growing suspicion that nobody agreed what “churn” means in the first place.
That is not a tools problem. That is not even mainly a data-quality problem. It is a problem-definition problem: people asked for analysis before they agreed what decision the analysis was supposed to change.
This is part 1 of Analytics foundations, a series for ordinary people who hear “data-driven” at work and want to respond with something smarter than a frantic export. You do not need to be a data scientist. You do need a habit: questions before data.
What you’ll learn
- Why starting with data often wastes time (and trust)
- How to turn a vague ask into a decision-ready problem statement
- Stakeholder requests vs curiosity projects, and how to treat each
- A one-page “problem brief” you can reuse Monday morning
- Common traps: metrics without owners, dashboards without decisions
Why “just pull the data” is a trap
Data feels productive. Opening a warehouse, writing a query, or spinning a pivot table looks like work. Framing a problem looks like… talking. In busy companies, talking loses to typing every time, until the meeting where three “facts” fight each other and everyone leaves less confident than they arrived.
Here’s the uncomfortable truth: the quality of every chart, model, and recommendation is capped by the clarity of the problem you set up first. Fuzzy problem in, fuzzy (or confidently wrong) answer out. Tools only amplify whatever clarity, or chaos, you fed them.
If you want the big-picture map of how analytics sits next to BI and data science, we already wrote that up in Analytics, BI, Data Science, What’s the Difference?. This series starts earlier: before roles and tools, before the first SELECT.
In one sentence: what is the problem?
Example:
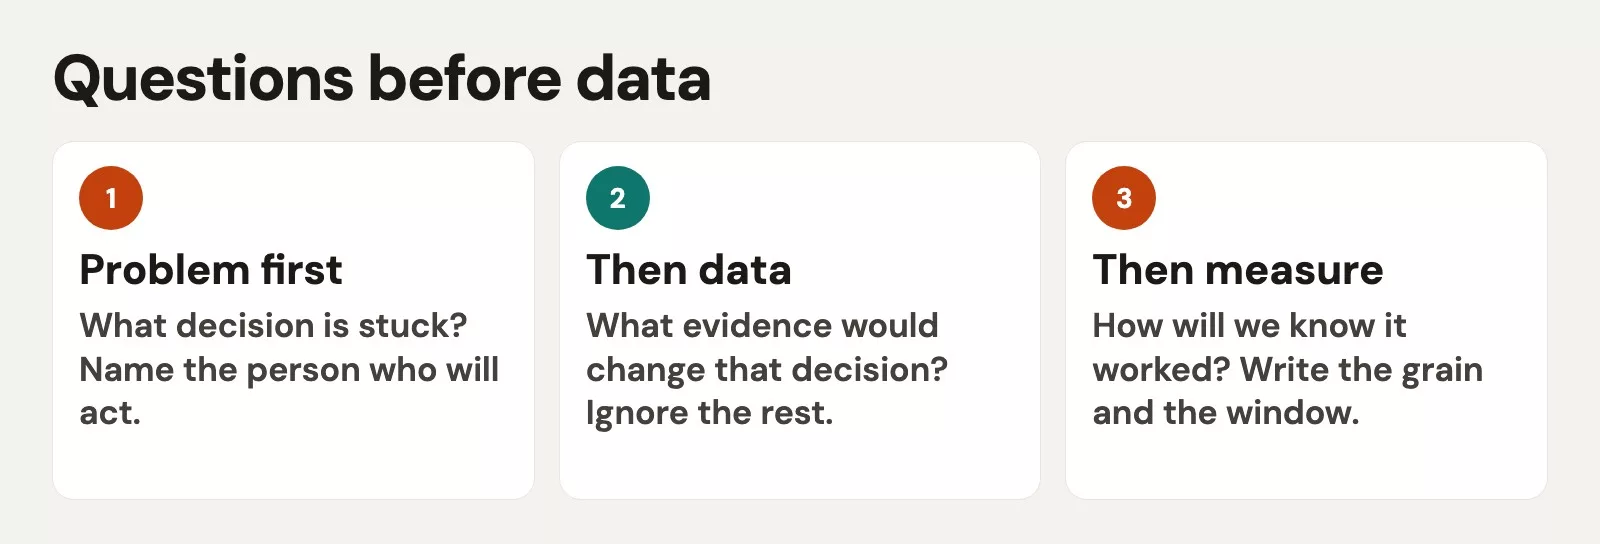
A usable analytics problem is not “we need a dashboard.” It is a situation where someone must choose between options, and better information would change which option they pick, or how confidently they pick it.
Write this sentence and refuse to open a dataset until you can finish it:
We need to understand ___ so that ___ can decide whether to ___ (by date ___), using a definition of success that looks like ___.
Example filled in:
We need to understand which customer segments are canceling after month two so that the lifecycle marketing lead can decide whether to fund an onboarding redesign by next Friday, using success defined as a clear ranking of segments by cancel rate and estimated revenue at risk.
Notice what appeared without a single chart:
- Topic: cancel behavior after month two
- Decision owner: lifecycle marketing lead
- Decision: fund redesign or not
- Deadline: next Friday
- Success shape: ranking + revenue at risk, not “interesting insights”
If the sentence collapses into “we need visibility,” you do not have an analytics problem yet. You have a vibe. Vibes do not need SQL; they need a conversation.
Stakeholder asks vs curiosity projects
Not every analysis is a fire drill from leadership. Both types are valid, but they need different contracts.
Stakeholder-driven work
Someone else owns a decision (or thinks they do). Your job is to reduce uncertainty for that decision, not to explore the entire universe of data. Success is measured by whether the decision got clearer, not by how many slides you made.
Healthy questions to ask them (out loud, not only in your head):
- What will you do differently if the answer is A vs B?
- What is the deadline for the decision, not the deadline for “a first look”?
- Who else must agree with this number?
- What does a “good enough” answer look like if perfect data is impossible this week?
Curiosity-driven work
You noticed something weird. No one assigned it. That is how good analysts get better, but curiosity without a frame becomes an infinite scroll of rabbit holes.
Give curiosity a time box and a kill criterion: “I’ll spend two hours checking whether weekend orders really underperform weekday orders by more than 10%. If not, I stop. If yes, I write a three-bullet note to the ops lead.”
Curiosity is research. Stakeholder work is service. Mixing them without saying so is how you miss deadlines while feeling very productive.
The decision test (one decision this analysis should change)
Example:
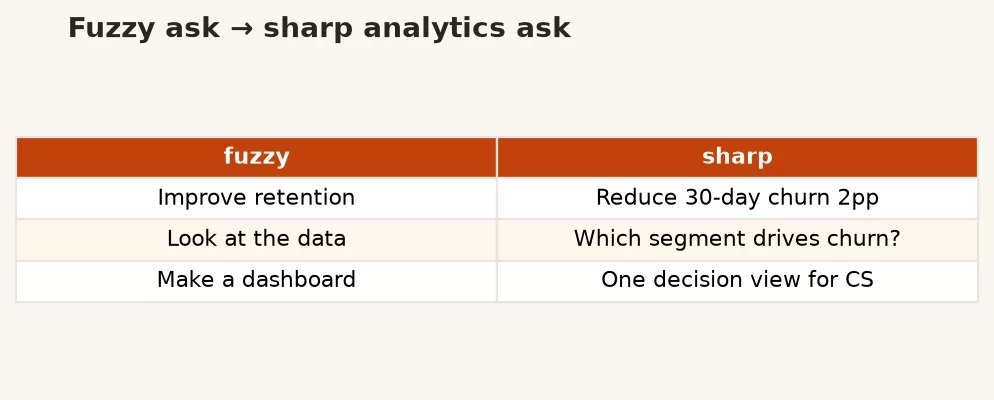
Tape this above your monitor:
If no decision changes, even a small one, this analysis is optional entertainment.
Decisions are not only “go / no-go” mega bets. They include:
- Which segment to email first
- Whether to investigate a data pipeline this sprint
- Whether to trust last month’s report enough to brief a customer
- Whether to hire, pause, or reallocate budget
When someone asks for “all the metrics,” translate: Which decision is drowning without a number? If they cannot name one, help them name one before you build a cathedral of charts. Our post on KPIs goes deeper on measures; this post is about not measuring until you know why.
A worked example: three ways to hear “how are sales?”
Those represent three different problems drawn from the same raw data warehouse, demanding completely different analyses.
| What they might mean | Decision at stake | What “done” looks like | Wrong deliverable |
|---|---|---|---|
| Are we going to hit the quarterly target? | Whether to pull forward a promotion | Forecast vs target, with assumptions listed | A 40-tab history of every SKU |
| Which rep territory is lagging? | Where to send coaching time | Ranked territories with fair normalization | One company-wide average |
| Did the website redesign help? | Whether to keep the new layout | Before/after with a defined window and caveats | Live dashboard with no comparison window |
If you skip the clarification step, you will default to whatever is easiest to query, usually a pretty line chart of “sales over time.” Sometimes that helps. Often it answers a question nobody asked, while the real decision waits.
Mini scene: the promotion meeting
Marketing wants a “sales deep dive” by Thursday. You ask the decision test. It turns out finance already locked the forecast; the real decision is whether to spend leftover budget on a flash sale this weekend. Suddenly you do not need five years of history. You need: current run rate, inventory risk on top SKUs, and what happened the last two flash sales. Your scope shrinks, delivery quality goes up, and peace of mind returns.
The one-page problem brief (steal this)
Copy into a doc, a ticket, or a sticky note. Fill it before any serious pull.
| Field | Prompt | Example |
|---|---|---|
| Decision owner | Who will act? | Support lead |
| Decision | What choice is open? | Add night-shift coverage: yes/no |
| Deadline | When is the choice made? | Staffing meeting, Tuesday 10 a.m. |
| Question | What must we learn? | Are tickets after 8 p.m. growing faster than daytime? |
| Success metric shape | What does a useful answer look like? | Trend of after-hours share + top 3 issue categories |
| Grain | What is one row? | One support ticket |
| Time window | Which period? | Last 12 complete weeks |
| Exclusions | What should we ignore? | Spam tickets, internal test accounts |
| Confidence needed | Rough OK or audit-ready? | Directional is fine for Tuesday |
| Risk if wrong | What breaks if we err? | Overtime budget; agent burnout |
Grain means “what one row represents.” If you cannot finish that sentence, stop. Wrong grain is how you double-count orders, undercount customers, and ship confident nonsense. We will keep returning to grain across this series and in SQL work (see the SQL series when you are ready to implement).
From brief to first query (optional SQL sketch)
You do not need SQL to frame a problem. When you do write SQL later, the brief becomes a checklist for the query instead of a blank page. Example sketch for the support scenario, not production-perfect, but directed:
-- Question: is after-hours ticket share rising?
-- Grain: one row per ticket
-- Window: last 12 complete weeks
SELECT
  DATE_TRUNC('week', created_at) AS week_start,
  COUNT(*) AS tickets,
  COUNT(*) FILTER (
    WHERE EXTRACT(HOUR FROM created_at) >= 20
       OR EXTRACT(HOUR FROM created_at) < 8
  ) AS after_hours_tickets
FROM support_tickets
WHERE created_at >= CURRENT_DATE - INTERVAL '12 weeks'
  AND is_spam = FALSE
  AND is_test = FALSE
GROUP BY 1
ORDER BY 1;
Every line maps to a field in the brief: window, exclusions, grain, metric shape. If a stakeholder changes the decision, the query changes with it, not the other way around. For AI-generated SQL, the same brief is your review checklist (see How to Check AI-Written SQL Before You Ship It).
How problem framing shows up in everyday roles
You might not have “analyst” in your title. Framing still applies.
- Marketer: “Engagement is down” → Which campaign decision freezes until we know whether open rate or click-to-purchase broke?
- Ops: “Warehouse is busy” → Are we deciding overtime, headcount, or process change?
- Founder: “We need to be data-driven” → Name one decision this month that will use a number you do not have yet.
- Engineer: “Product wants a dashboard” → Which alert or weekly decision will this dashboard feed?
For a tour of how roles differ, see Data Jobs Demystified. Framing is the shared language between them.
Common mistakes (and kinder fixes)
1. Starting with the data you already have
Convenience is not strategy. The easy table may not answer the decision. Fix: write the brief first; then see if the data exists. If not, say so early, “we can answer 70% of this with current fields; the other 30% needs a tracking change.”
2. Building dashboards without decision owners
Dashboards without owners become graveyards of green and red. Fix: every tile should survive the sentence “___ uses this to decide ___.” If no name fills the blank, archive the tile.
3. Confusing activity with progress
Queries written ≠ questions answered. Fix: time-box exploration; end every session with a written update to the brief (“still unknown,” “answered,” “blocked on definition”).
4. Letting metrics multiply without definitions
Five “revenue” fields is a political crisis, not a feature. Fix: pick one definition for this decision; document caveats; escalate definition fights separately from the analysis (governance helps, see Data Governance 101).
5. Treating “data-driven” as a personality
Being data-driven is a process: question → evidence → decision → learn. It is not a mood. Fix: celebrate clear problems and honest uncertainty, not just pretty charts. Data literacy is partly the courage to say “we don’t know yet.”
A 20-minute practice you can do today
- Pick one request sitting in your inbox or Slack.
- Fill the one-page problem brief without opening any tools.
- Send the brief back to the requester: “Confirming this is what we’re solving, edit anything wrong.”
- Only then open data. Stop when the decision is unblocked, not when the rabbit hole ends.
You will feel slightly awkward the first time. That awkwardness is cheaper than rebuilding the analysis twice.
How this fits the rest of Analytics foundations
This series continues with:
- A2. Data vs information vs insight, so you know which layer you are producing
- A3. The analytics loop, question → data → transform → answer → decision → measure again
- A4. Good enough vs perfect data, confidence language for imperfect sources
- A5. Reading a number like an adult, rates, denominators, comparisons
When you are ready to implement with queries, the Learn hub and SQL path are there. Foundations first means fewer heroic late nights later.
FAQ
Isn’t this just project management?
It overlaps with scoping, yes. The analytics-specific part is tying scope to definitions, grain, windows, and metric shape, the things that break when you skip straight to SQL or a BI tool.
What if leadership refuses to clarify?
Document your assumptions in the brief and share them with the deliverable: “Assuming churn = paid accounts with no renewal after 30 days…” Visible assumptions protect you and invite correction. Silent assumptions create politics.
How long should framing take?
For a small request: 10 to 20 minutes. For a strategic initiative: hours, not weeks. If framing takes longer than analysis, you may be stuck in alignment theater, escalate the decision owner problem, not the chart colors.
Can AI write the brief for me?
AI can draft questions to ask stakeholders. It cannot attend your meeting or own the consequences of a bad decision. Use it as a sounding board, then verify with humans who will act.
Quick recap
- Start with the decision, not the dataset.
- Finish the one-sentence problem template before tools.
- Separate stakeholder work from curiosity work with time boxes.
- Use a one-page brief: owner, decision, deadline, question, success shape, grain, window, exclusions, confidence, risk.
- Let the brief drive queries and dashboards, not the reverse.
In one sentence: Great analytics starts when you can say what problem you are solving and which decision will change when you are done.
Sources
Research and further reading that shaped this article:
- CMC Canada, Are you solving the right analytics problem?, on problem definition bounding every downstream recommendation
- Indiana Wesleyan University, Data-driven decision-making overview, goals before collection; common analytics pitfalls
- Meta Analytics, Four analytics best practices, practice of curated decision-oriented analytics guidance
- LinkedIn advice roundup, Framing and defining a problem for analytics, context and problem statements before methods
- Analytics Made Simple, Learn, series and paths on this site
- AMS, Analytics, BI, and Data Science differences
- AMS, What is data literacy?
- AMS, All about KPIs
- AMS, Check AI-written SQL before you ship
Keep going
Same lessons in your feed
Short diagrams, hooks, and weekly tutorials on Substack, Instagram, X, and Facebook.