, ,

What is data literacy and why it matters

8 min read
Editorial cover: person thoughtfully reading floating charts by a sunny window. Text: Data literacy

A chart goes up and to the right. Someone says “we’re crushing it.” Nobody asks what the denominator is, whether the tracking changed, or who is missing from the data. That room does not have a tools problem. It has a data literacy problem.

Data literacy is the ability to find, read, question, and use data to make better decisions, including knowing when the data is not good enough. It is not only for analysts. Managers who approve budgets from dashboards need it too.

What you’ll learn

  • A practical definition of data literacy
  • A ladder from finding data to deciding with caveats
  • Skills for readers vs builders
  • How organizations fake literacy with more dashboards
  • A simple practice plan for teams
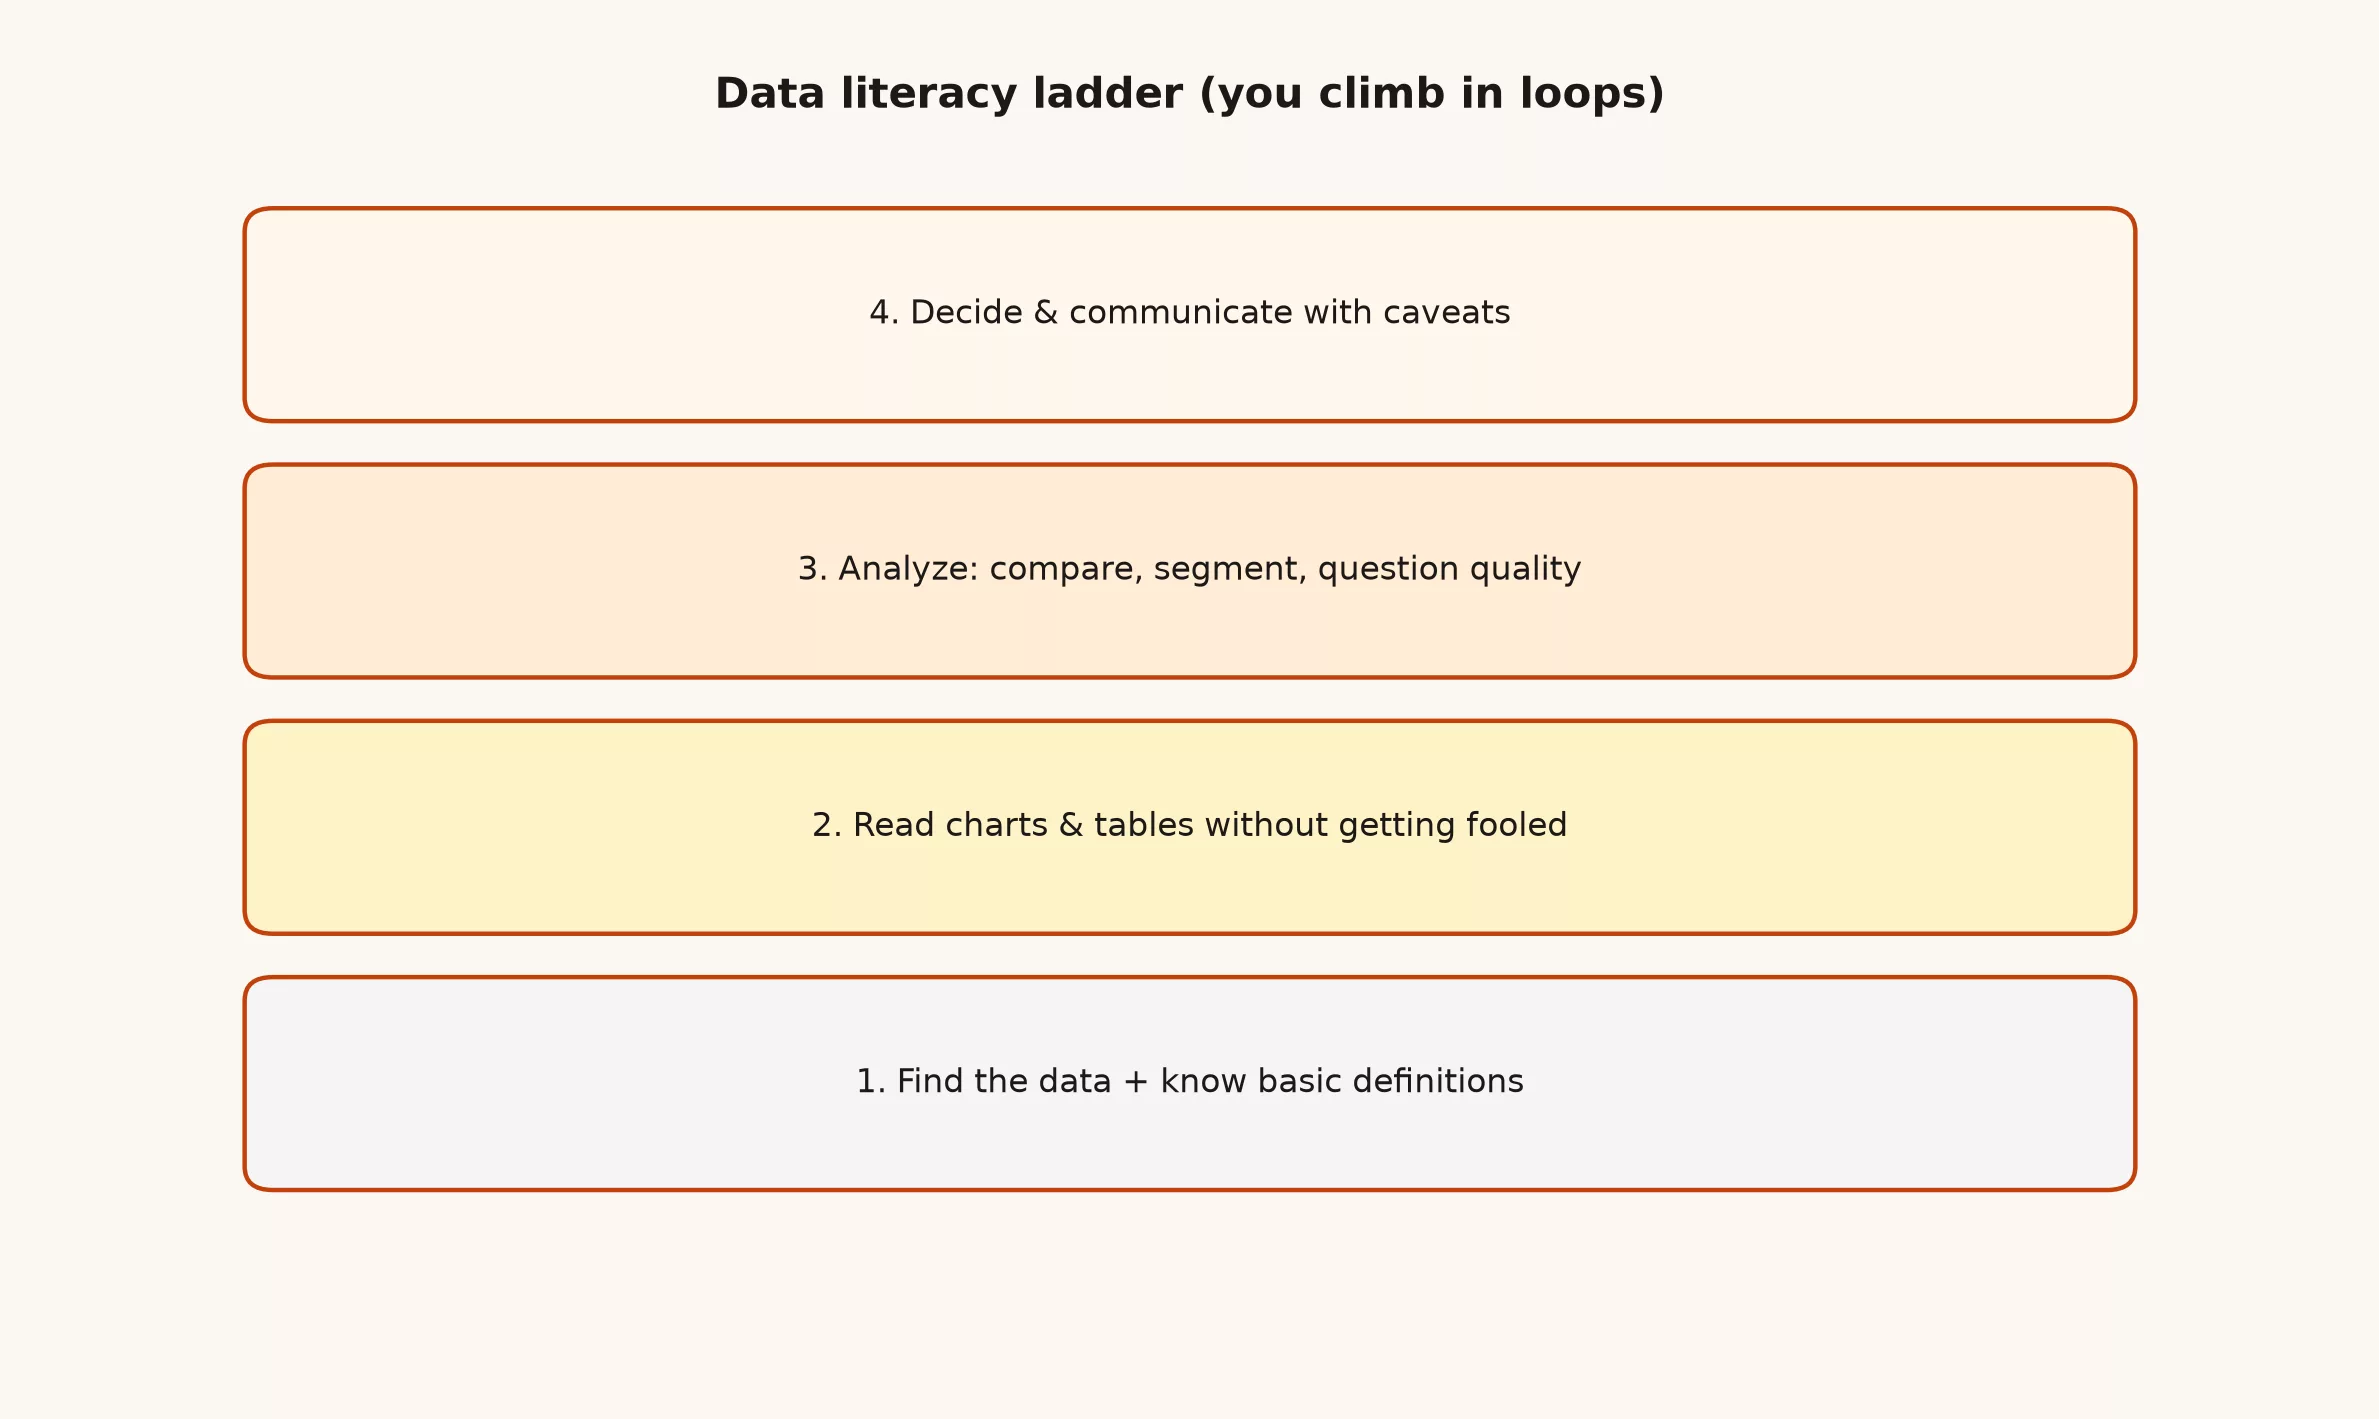
Four-step data literacy ladder from find data to decide with caveats
You climb in loops, not once forever.

The literacy ladder

  1. Find the right data and know basic definitions
  2. Read tables and charts without getting fooled
  3. Analyze: compare, segment, check quality
  4. Decide and communicate with caveats

People skip to step 4 with vibes from step 2. That is how bad launches get green-lit.

For readers (most of the company)

  • Ask what one row means
  • Ask what is excluded
  • Check the time range and timezone
  • Look for annotations when trends break
  • Separate “interesting” from “actionable”

For builders (analysts and friends)

  • Publish definitions next to metrics
  • Show quality issues instead of hiding them
  • Use consistent number formats and baselines
  • Write the decision the chart supports
  • Invite challenge without punishing it

Literacy is not more dashboards

Flooding people with tiles can reduce literacy by creating false confidence. A short scorecard with clear definitions beats a maze of 80 pages. Training helps when it uses the company’s real metrics, not only abstract chartjunk examples.

Worked micro-example

Chart: “Weekly active users up 12%.” Literate questions: Is this logins or unique accounts? Did we ship a tracking change? Did a bot farm appear? Is the lift in a segment we care about? What decision depends on this number this week? If nobody can answer, do not celebrate yet.

Building literacy on a team

  1. Pick five official metrics and document them in plain language
  2. Run a monthly “metric clinic” for 30 minutes on one confusing chart
  3. Add a definition tooltip requirement for new dashboards
  4. Reward people who catch data issues early
  5. Link analyses to decisions with a brief template

Common anti-patterns

  • Treating every uptick as skill and every dip as doom
  • Outsourcing thinking to a single “numbers person”
  • Hiding methodology because it is “too technical”
  • Changing definitions silently mid-quarter
  • Confusing access to tools with ability to reason

Why it matters for leadership

Strategy without literacy becomes storytelling with props. Literacy without strategy becomes endless exploration. Leaders set the tone by asking good questions publicly and by not shooting messengers who bring quality problems.

Quick recap

  • Literacy is find, read, question, decide
  • Readers and builders share responsibility
  • More dashboards alone do not create literacy
  • Practice on real company metrics
  • Reward careful questions, not only fast answers

Write examples from your own workplace. A named dashboard fight teaches more than a generic industry claim, and it keeps the post useful when the logos on the architecture slide change again next year.

If two teams argue about a number, put both definitions on one page with owners and timestamps. Clarity beats a forced compromise that nobody trusts enough to use in a real decision meeting.

Ship a small artifact this week: a definition card, a quality check, a retired vanity chart, or a one-page brief. Momentum compounds faster than another strategy deck about becoming data driven someday.

Teach newcomers where the source of truth lives on day one. Onboarding is a data-system surface. If new hires learn the wrong table first, you will spend months undoing that habit in code review and Slack threads.

When something breaks, fix the rule or the automated test that should have caught it. Heroic manual checks do not scale, and they disappear the week everyone is out on holiday or buried in a launch.

Prefer plain words in meetings until everyone shares a definition. Jargon is fine after that. Before that, jargon is just a way to lose the people who will actually act on the analysis.

Keep a short change log for metrics, pipelines, and critical dashboards. Future you will need the date a definition shifted, and you will not find it in a year-old screenshot buried in a slide archive.

Measure one concrete thing that proves the new approach beats the old habit: fewer reconcile hours, faster ticket answers, lower duplicate rates, or fewer “which number is right” threads per month.

Resist boiling the ocean. One domain, one partnership, one metric strip, or one retrieval evaluation set is enough to learn. Expansion is easier after you have a win people can point at without squinting.

Document the messy edge cases in the open. Hidden footnotes become tribal knowledge, and tribal knowledge becomes an outage when the only person who remembered the footnote changes teams.

Write examples from your own workplace. A named dashboard fight teaches more than a generic industry claim, and it keeps the post useful when the logos on the architecture slide change again next year.

If two teams argue about a number, put both definitions on one page with owners and timestamps. Clarity beats a forced compromise that nobody trusts enough to use in a real decision meeting.

Ship a small artifact this week: a definition card, a quality check, a retired vanity chart, or a one-page brief. Momentum compounds faster than another strategy deck about becoming data driven someday.

Teach newcomers where the source of truth lives on day one. Onboarding is a data-system surface. If new hires learn the wrong table first, you will spend months undoing that habit in code review and Slack threads.

When something breaks, fix the rule or the automated test that should have caught it. Heroic manual checks do not scale, and they disappear the week everyone is out on holiday or buried in a launch.

Prefer plain words in meetings until everyone shares a definition. Jargon is fine after that. Before that, jargon is just a way to lose the people who will actually act on the analysis.

Keep a short change log for metrics, pipelines, and critical dashboards. Future you will need the date a definition shifted, and you will not find it in a year-old screenshot buried in a slide archive.

Measure one concrete thing that proves the new approach beats the old habit: fewer reconcile hours, faster ticket answers, lower duplicate rates, or fewer “which number is right” threads per month.

Resist boiling the ocean. One domain, one partnership, one metric strip, or one retrieval evaluation set is enough to learn. Expansion is easier after you have a win people can point at without squinting.

Document the messy edge cases in the open. Hidden footnotes become tribal knowledge, and tribal knowledge becomes an outage when the only person who remembered the footnote changes teams.

Write examples from your own workplace. A named dashboard fight teaches more than a generic industry claim, and it keeps the post useful when the logos on the architecture slide change again next year.

If two teams argue about a number, put both definitions on one page with owners and timestamps. Clarity beats a forced compromise that nobody trusts enough to use in a real decision meeting.

Ship a small artifact this week: a definition card, a quality check, a retired vanity chart, or a one-page brief. Momentum compounds faster than another strategy deck about becoming data driven someday.

Teach newcomers where the source of truth lives on day one. Onboarding is a data-system surface. If new hires learn the wrong table first, you will spend months undoing that habit in code review and Slack threads.

When something breaks, fix the rule or the automated test that should have caught it. Heroic manual checks do not scale, and they disappear the week everyone is out on holiday or buried in a launch.

Prefer plain words in meetings until everyone shares a definition. Jargon is fine after that. Before that, jargon is just a way to lose the people who will actually act on the analysis.

Keep a short change log for metrics, pipelines, and critical dashboards. Future you will need the date a definition shifted, and you will not find it in a year-old screenshot buried in a slide archive.

Measure one concrete thing that proves the new approach beats the old habit: fewer reconcile hours, faster ticket answers, lower duplicate rates, or fewer “which number is right” threads per month.

Resist boiling the ocean. One domain, one partnership, one metric strip, or one retrieval evaluation set is enough to learn. Expansion is easier after you have a win people can point at without squinting.

Document the messy edge cases in the open. Hidden footnotes become tribal knowledge, and tribal knowledge becomes an outage when the only person who remembered the footnote changes teams.

Write examples from your own workplace. A named dashboard fight teaches more than a generic industry claim, and it keeps the post useful when the logos on the architecture slide change again next year.

If two teams argue about a number, put both definitions on one page with owners and timestamps. Clarity beats a forced compromise that nobody trusts enough to use in a real decision meeting.

Sources