Use AI tools to help you write and explain, but never treat them as the official source of a number. Say a coworker posts a screenshot in the team chat that reads, “ChatGPT says revenue was up 18% last quarter.”There is no note about what one row of the data means, which filters were used, whether refunds or taxes were counted, or which system the rows came from. Three people react with fire emojis. You feel the familiar drop in your stomach, because you know how easy it is to get a smooth-sounding wrong number.
That is the job this series is for. It does not ask you to become a machine learning engineer, and it does not ask you to ban the tools. It offers practical habits for people who already work with SQL (the standard language for asking a database for data), Python, data quality, and metrics, and who now have an AI chatbot open next to the data warehouse, the central database that holds the company’s official numbers.
This post opens the Practical AI for analytics people series. We start with the line that keeps you out of trouble: what AI can help with, what it cannot replace, and who is still responsible when a number lands in a slide deck. If you need the vocabulary first, read our plain-English tour of LLMs, ChatGPT, and generative AI. (LLMs, or large language models, are the kind of AI behind chatbots.) If you already ship SQL with a model’s help, keep the post on checking AI-written SQL open as a companion checklist.
Assist is real. Replace is a category error
Large language models are good at language-shaped work: drafting, rewriting, outlining steps, suggesting join ideas, turning a vague question into a clearer one, and proposing code you can test. They are bad at being the official source of truth. They do not “know” your warehouse, because they predict believable text from what you pasted and what they were trained on.
That sounds picky until you watch a model invent a column name that almost exists, a filter that sounds like company policy, or a growth percentage with two decimal places of false confidence. The writing is smooth, but the responsibility is still yours.
Think of AI for analysis the way you already think of autocomplete for SQL. Autocomplete speeds up typing, but it does not sign off on the query (a request that asks a database for data). Your job is still to know what one row of the data means, to keep the definitions straight, and to ask whether the result answers the question you were given. The SQL series and the Python series teach craft for that reason. AI does not erase that craft. It only multiplies how fast you can make a confident-looking mistake.
Four boxes: assist, replace, risk, refuse
When someone asks “should we use AI for this analysis?”, answer with one of four boxes and not a gut feeling.
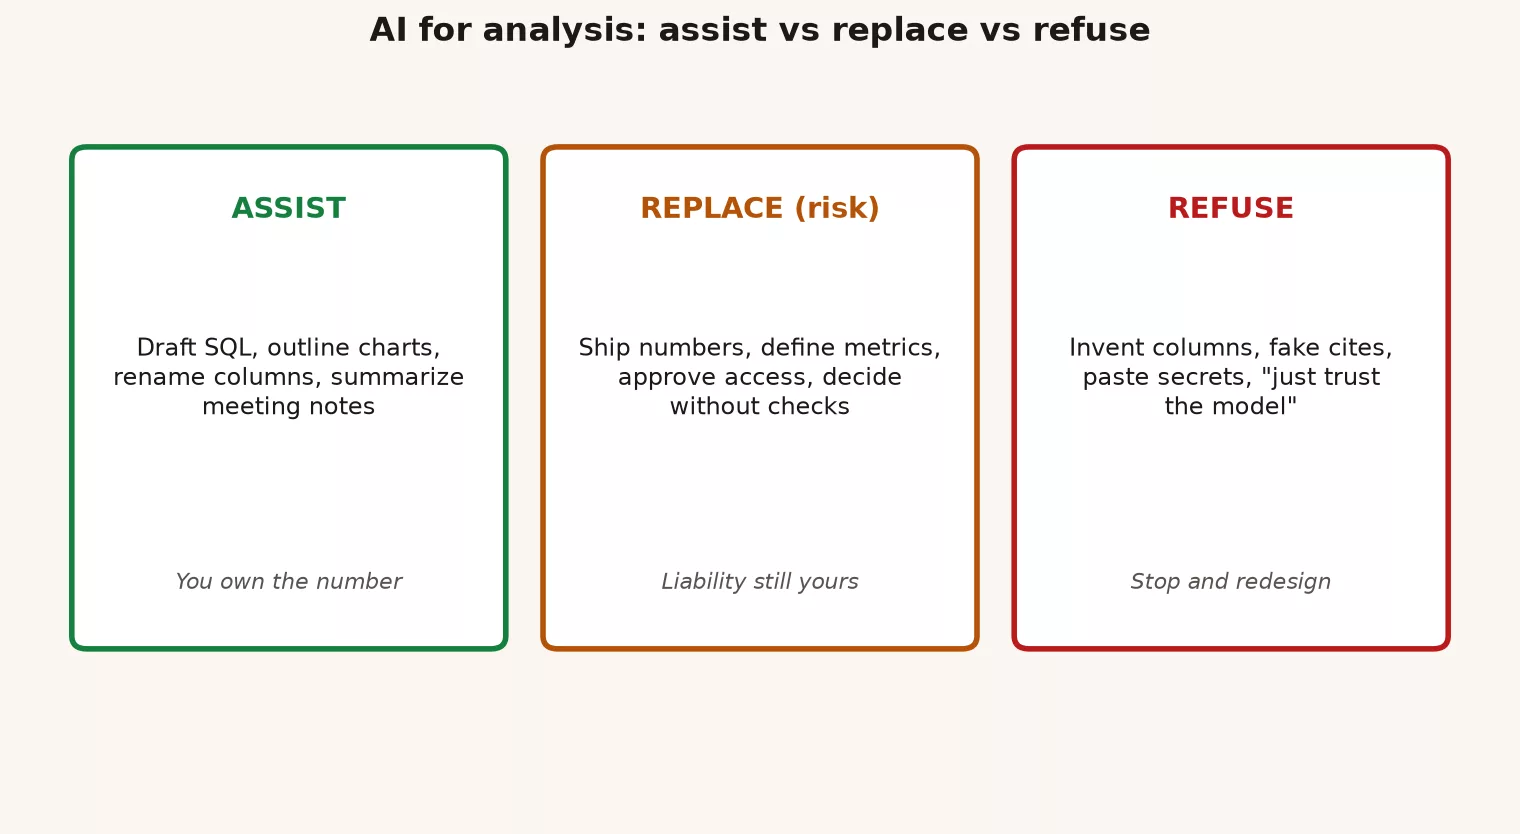
The diagram is a decision map, and here it is in words.
- Assist: draft SQL or pandas code (pandas is a popular Python tool for tables), rephrase a question, outline an analysis plan, suggest checks, write a first-pass narrative after you have numbers, or turn a metric definition into a checklist.
- Replace (almost never for numbers): produce the official key number without a query or an approved data pull, decide which records policy excludes, invent missing facts about your business, or own the number that goes to the board.
- Risk: anything where a wrong but fluent answer leads to a decision, a public claim, or a statement to customers. The risk rises with the size of the audience, the money involved, and how hard the decision is to undo.
- Refuse: pasting secrets or regulated fields into tools your company has not approved, asking for “the real revenue” when the tool has no data access, treating a model’s memory as if it were a data warehouse, and accepting invented columns or citations.
The assist box is wide, while the replace box for numbers is narrow or empty. Risk is the middle lane, where you still use the tool but force yourself to verify the result. Refusing is not fear of technology, since it is how careful people treat any untrusted input to a data process.
Why models sound right when they are wrong
Analysis has a special way of failing. In casual writing a wrong adjective is annoying, but in analysis a wrong filter gives you a picture of a different company. Models are built to keep the text flowing and to be helpful, so they will finish the story even when the story needs a join key (the shared column that links two tables) that is missing.
Three patterns show up constantly.
- Invented tables and columns: the model writes columns and tables that “should” exist. Your warehouse has
order_total_usd, but the model writesrevenueand keeps going. - Definition drift: “active customer” becomes whatever sounds reasonable in the prompt, and not what the finance team signed off on in the metric definition. Pair this with the habits in our metrics series.
- Caveats for show: the answer lists its warnings in one sentence, then delivers a precise number as if the warnings were optional decoration.
If you have already fought with AI-written SQL, you know the fix is not to keep re-asking until the answer feels true. The fix is to check the result against the real table definitions, sample rows, and totals you already know. That is the spirit of the post on checking AI-written SQL, applied to the whole analysis.
Liability: you still own the number
Companies love to ask who is “responsible for AI.” For analysis, the more useful question is smaller: who answers for the claim that leaves the room? Vendor terms, model documentation, and company AI policies all matter, but they do not take the board number off your desk once you put it on a slide.
You can borrow language from risk management without the ceremony. The National Institute of Standards and Technology (NIST) publishes an AI Risk Management Framework (AI RMF) that talks about mapping, measuring, and managing risk across the life of an AI system. For an analyst, the life of a number runs from the question to the data path, the transform, the check, the narrative, and the decision. AI can sit in several of those steps. The responsibility for the claim that drives a decision still lands on a person, often the analyst who shipped it, the owner who signed the definition, or both.
Data stewardship habits, which means someone is named to look after each dataset, help here. If nobody owns the definition, AI will invent one. If quality checks are optional, AI will skip them, and if the path the data took is a mystery, AI will describe a confident path that never ran. See the data stewardship series, the data quality series, and the data pipelines series when you need the half of the trust story that has nothing to do with AI.
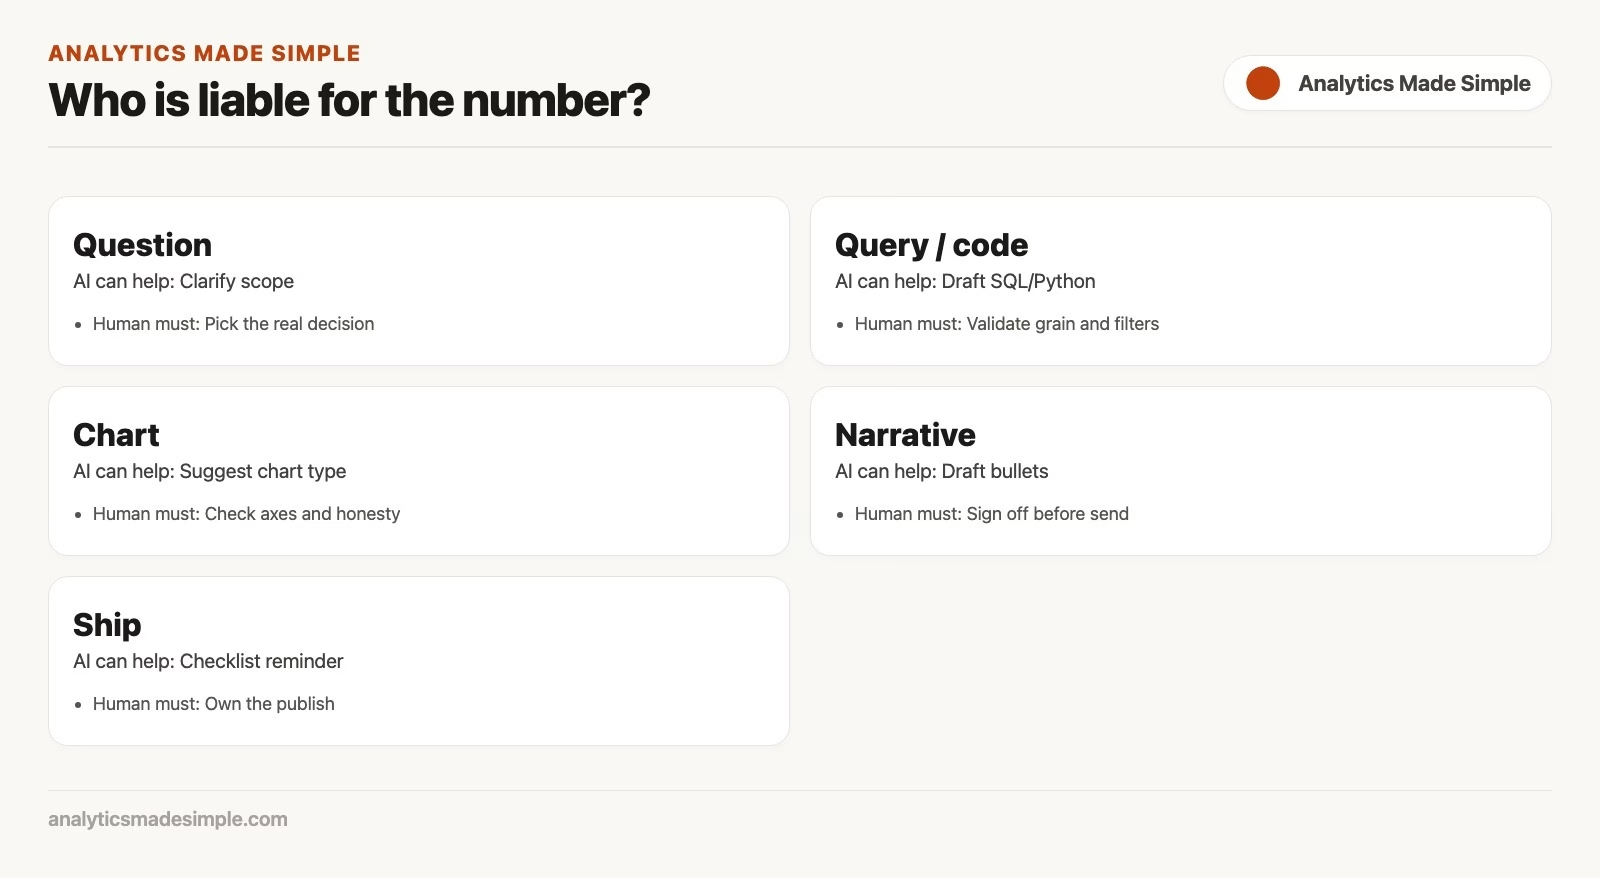
Use the table below as a default way of working, so it is clear which steps AI can help with and which a person must own.
| Step | AI can help | Human must own |
|---|---|---|
| Frame the question | Clarify the wording and list missing inputs | The decision and what success looks like |
| Choose data | Suggest tables from a table layout you paste in | The approved source, what one row means, and who has access |
| Transform | Draft SQL or Python | Run it, read how it works, and compare against samples |
| Aggregate | Propose groupings | The metric definition and the filters |
| Check | Suggest tests and edge cases | Pass or fail against numbers you already know |
| Narrate | Draft prose from your table | The claims, the caveats, and whether it suits the audience |
| Decide | List options and tradeoffs | The final call and the risk that remains |
If your team only remembers two rows, make them Check and Narrate, because that is where smooth-sounding mistakes turn into what the whole company believes.
Worked example: the helpful 18%
Imagine your product lead pastes this prompt into a general chat tool.
We sold 12,400 units last quarter and 10,500 the quarter before.
Marketing spend was roughly flat. What was our growth, and what
should I tell the board about drivers?
A model might answer something like this.
Growth = (12400 - 10500) / 10500 ≈ 18.1%.
Drivers: strong product-market fit and efficient marketing.
Recommend highlighting momentum and reinvesting in acquisition.
The arithmetic on the two whole numbers is fine, but the analysis is not. An analyst would want to know several things first.
- Are units shipped products, trials, or seats, and is it the same in both quarters?
- Were there refunds, cancellations, or returns to stock after the quarter closed?
- Did prices change, or did sales shift toward a cheaper item (a stock-keeping unit, or SKU)?
- Was there a seasonal bump, or one large customer who will not come back?
- “Marketing spend flat” is not an explanation of what drove sales, so it needs real evidence behind it.
A more careful version starts with the table you actually trust and not with a sentence for the board. Here is a made-up sketch.
| Quarter | Units shipped | Net revenue (USD) | Top customer share |
|---|---|---|---|
| Q3 | 10,500 | 2,100,000 | 9% |
| Q4 | 12,400 | 2,170,000 | 22% |
Unit growth is about 18%, but revenue growth is only about 3%, and one customer drove a lot of the jump in units. So the board story is not “momentum, so reinvest.” It is closer to “unit volume is up, but revenue barely moved and we now depend on one large customer.” AI can help you draft both versions of the story after you have the table. It should never invent the customer-share column out of thin air.
Here is a safer way to get help. Paste a small result set, or an approved metric extract, ask for alternate framings and risks, then edit what comes back. Here is what such a prompt can look like.
Here is a verified quarterly table (toy numbers). Do not invent
extra metrics. List three honest narratives and two risks a board
might miss. Flag any question the table cannot answer.

quarter,units_shipped,net_revenue_usd,top_customer_share
Q3,10500,2100000,0.09
Q4,12400,2170000,0.22
You still own the slide. The model is a second pair of eyes on how the story is framed, and it is not a second source of truth.
What good help looks like on a normal Tuesday
These are concrete jobs where AI earns its keep for people who work with data.
- Sharpening the question: asking “What is missing before I can answer this?” is often more valuable than asking “Write the SQL.”
- Draft, then test: generate a query, run it, compare the row counts to a known dashboard (a screen of charts that tracks key numbers) tile, fix it, and repeat. Never present a draft as the truth.
- Prove first, explain second: once you have a correct result, ask for a plain-language explanation for a non-technical audience, and then edit it.
- Checklists: turn your metric definition into a checklist to run before you publish, and keep it in your team document and not only in your chat history.
- A sounding board for joins and blanks: describe a strange pattern of empty values and ask what to investigate next, and treat the answers as guesses to test.
Some jobs look like help but are really the model taking over.
- “What was our true net revenue retention (NRR) last year?” with no data attached. (NRR is the share of last year’s recurring revenue you kept, counting upgrades and losses.)
- “Write the SQL and the board paragraph” as one step, with no check in between.
- “Fill in the size of the market” from the model’s memory for a pricing decision.
- Pasting dumps of real customer emails into a consumer chat tool because “it is faster.”
That last one belongs in the refuse box. Privacy and vendor terms are not optional footnotes. If your company has an approved workspace for AI tools, use it, and if it does not, keep personal data and secrets out of the paste box. Later posts in this series go deeper on safe pasting. For now, treat any unapproved tool like a public corridor where anyone can overhear you.
How this fits what you already know
AI does not replace analytics craft, because it sits on top of it.
- If you cannot explain what one row of your data means, you cannot check a grouping the model wrote.
- If you do not know the metric definition, the model will invent one.
- If your data quality checks are fuzzy, you will accept good-looking nonsense.
- If nobody owns the data pipeline (a chain of automatic steps), nobody will know which number was “the AI one.”
Vector databases and retrieval (looking up the right documents first) come up when you want a model to answer from your own documents instead of inventing things. That is a real design pattern and not magic. When you are ready for that path, use our intro to vector databases, and keep your expectations honest, because retrieval reduces some made-up answers but does not remove your responsibility.
Browse the full learning map anytime on Learn.
Common mistakes
- Assuming fluent means verified. Smooth writing is a presentation skill and not a test result.
- Skipping the table layout. Asking for SQL without pasting or linking the real table definitions is how you get invented columns.
- Publishing in one shot. Generate, screenshot, and ship, with no run, no sample, and no check against a known total.
- Shopping for a definition. Re-asking until the growth rate matches the story you wanted.
- Buying a tool instead of building a process. Paying for an “AI analytics” label without metric definitions, owners, or quality checks.
- Pasting secrets. Putting passwords, customer identifiers, or regulated fields into unapproved tools.
- Blaming the model afterward. The vendor did not put the number on your slide, so your process did.
Quick recap
- AI is strong at language-shaped help and weak as the official source for numbers.
- Use four boxes: assist, replace, risk, and refuse. Replacing the official number with AI is almost never the right box.
- Fluency is not evidence. Invented columns, definition drift, and caveats for show are normal failures.
- People own the claims that drive decisions. Map each analysis step to what AI may draft and what a person must verify.
- Prove it with data first and tell the story second, and attach real tables when you ask for a narrative.
- Your existing craft in SQL, Python, quality, metrics, pipelines, and stewardship is the set of checks AI needs.
Practice: 20 minutes this week
Pick one recurring analysis that you touch, such as weekly revenue, a sales funnel, inventory, or support volume. On a sticky note or in a document, write three columns: Assist, Risk, and Refuse. Fill in five bullets under Assist that you will allow yourself. Add three under Risk that require a check first, such as a query result, a match to a dashboard, or a second person. Finish with two under Refuse that are non-negotiable for your team.
Then take one old AI-assisted query or narrative and re-check it against the real table definitions and a known total. Note what would have failed if you had shipped the first draft, and keep that failure as a teaching example and not a story of shame.
Series notes: This is Part 1 of Practical AI for analytics people. The next post covers tokens (the small chunks of text AI models read and write), context windows, and cost, including why giant pastes fail and when splitting a job into pieces beats cramming it all in. The one after that turns it into prompt patterns for data work.
Sources
- NIST, Artificial Intelligence Risk Management Framework (AI RMF 1.0): https://www.nist.gov/itl/ai-risk-management-framework
- OpenAI, safety and usage policies (tool and data handling expectations): https://openai.com/policies/usage-policies
- OpenAI, model documentation and prompting guides (capabilities and limits in product docs): https://platform.openai.com/docs
- Anthropic, Claude documentation (prompting, limitations, and constitutional AI overview): https://platform.claude.com/docs
- Bender, Gebru, McMillan-Major, and Shmitchell, “On the Dangers of Stochastic Parrots” (why fluent text is not grounded knowledge): https://dl.acm.org/doi/10.1145/3442188.3445922
- Google, People + AI Guidebook (human-AI collaboration patterns): https://pair.withgoogle.com/guidebook
Keep going
Same lessons in your feed
Short diagrams, hooks, and weekly tutorials on Substack, Instagram, X, and Facebook.