All Articles & Tutorials
Explore practical guides, step-by-step masterclasses, and foundational definitions across AI, SQL, and data systems — written in plain, human English.
All articles
Power BI for beginners: build the data model before the charts
Power BI starts with the model, not the chart. Learn star schemas, relationships, and grain so your first report answers a real question instead of fighting double counts…

The analyst career ladder: what each level means if you don’t manage people
Analyst titles vary wildly. Part 1 of Analyst career path translates the IC ladder into plain English: execute, own slices, multi-team work, and senior bets, with signals you…

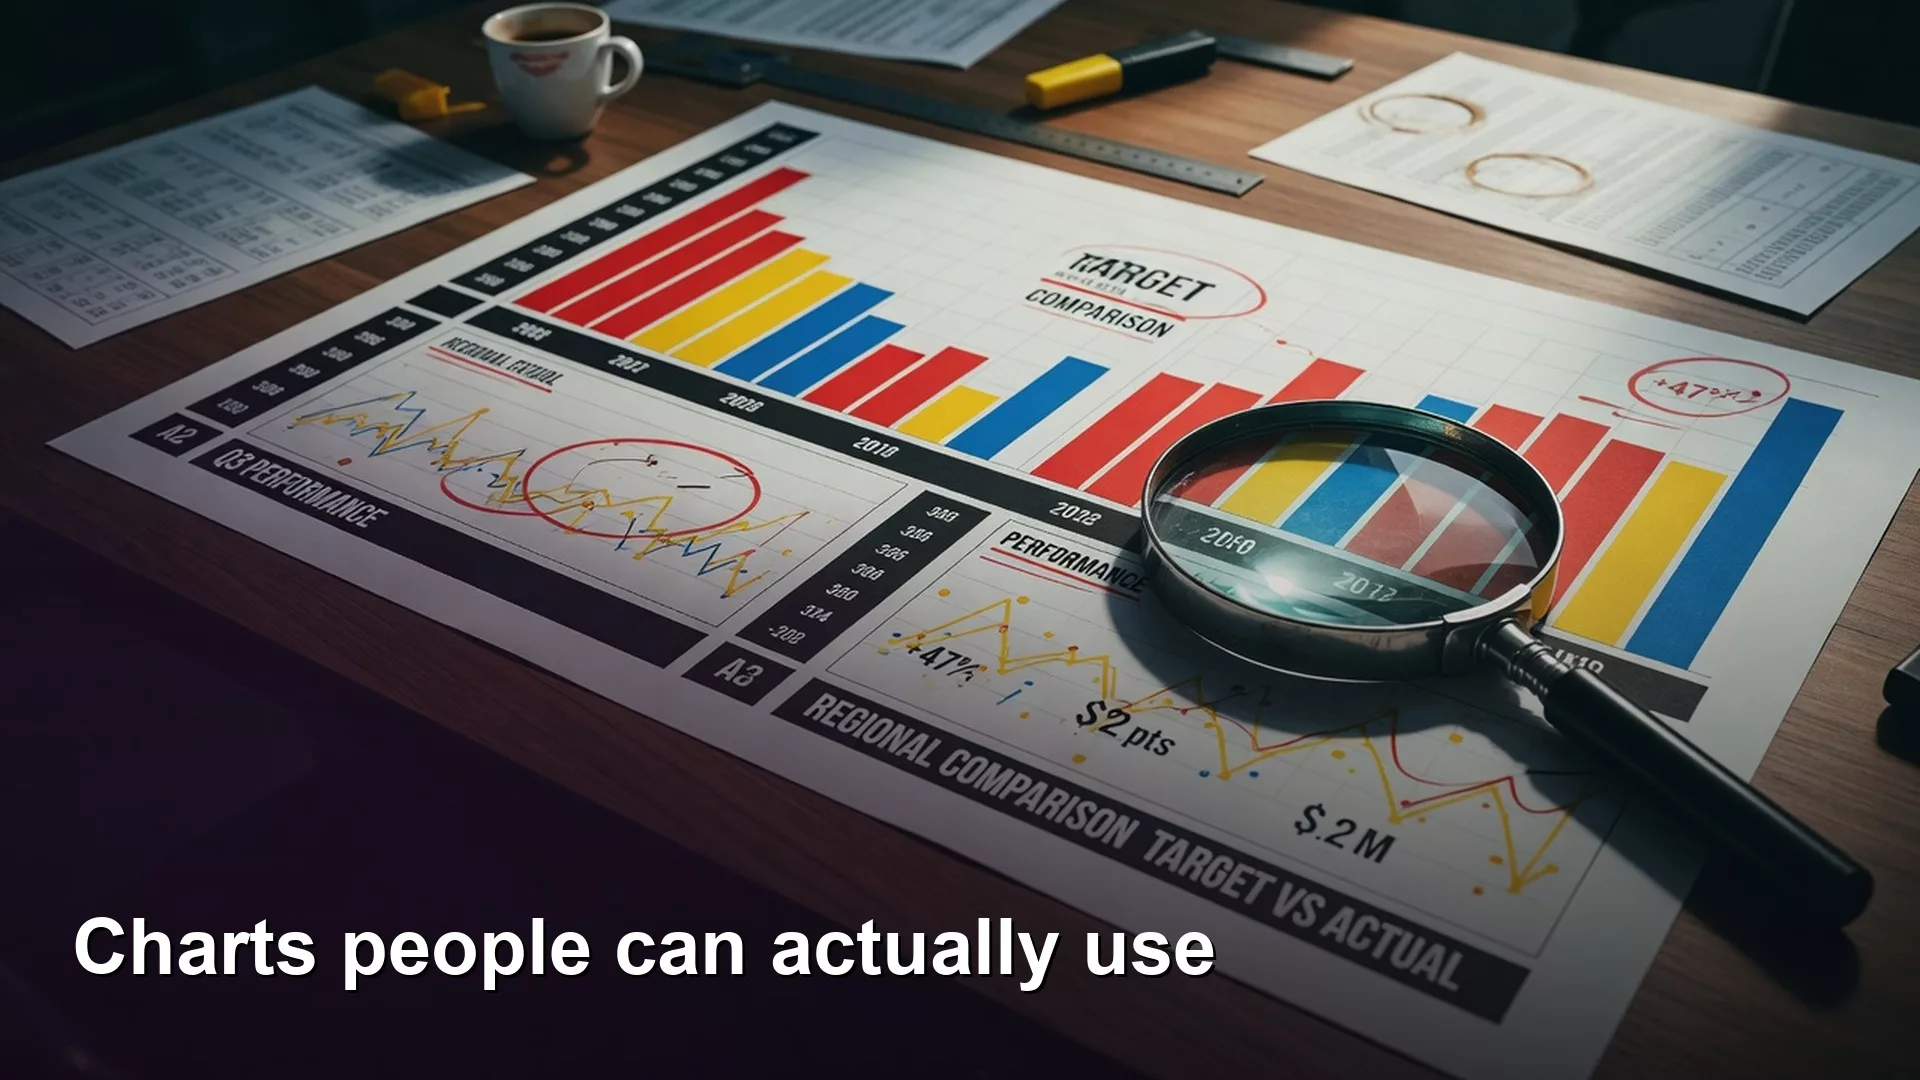
How to design accessible charts that everyone can read
Color-only charts exclude real users. This Part 1 of Inclusive data products covers labels, contrast, patterns, alt text, and a practical A11y checklist you can run before a…
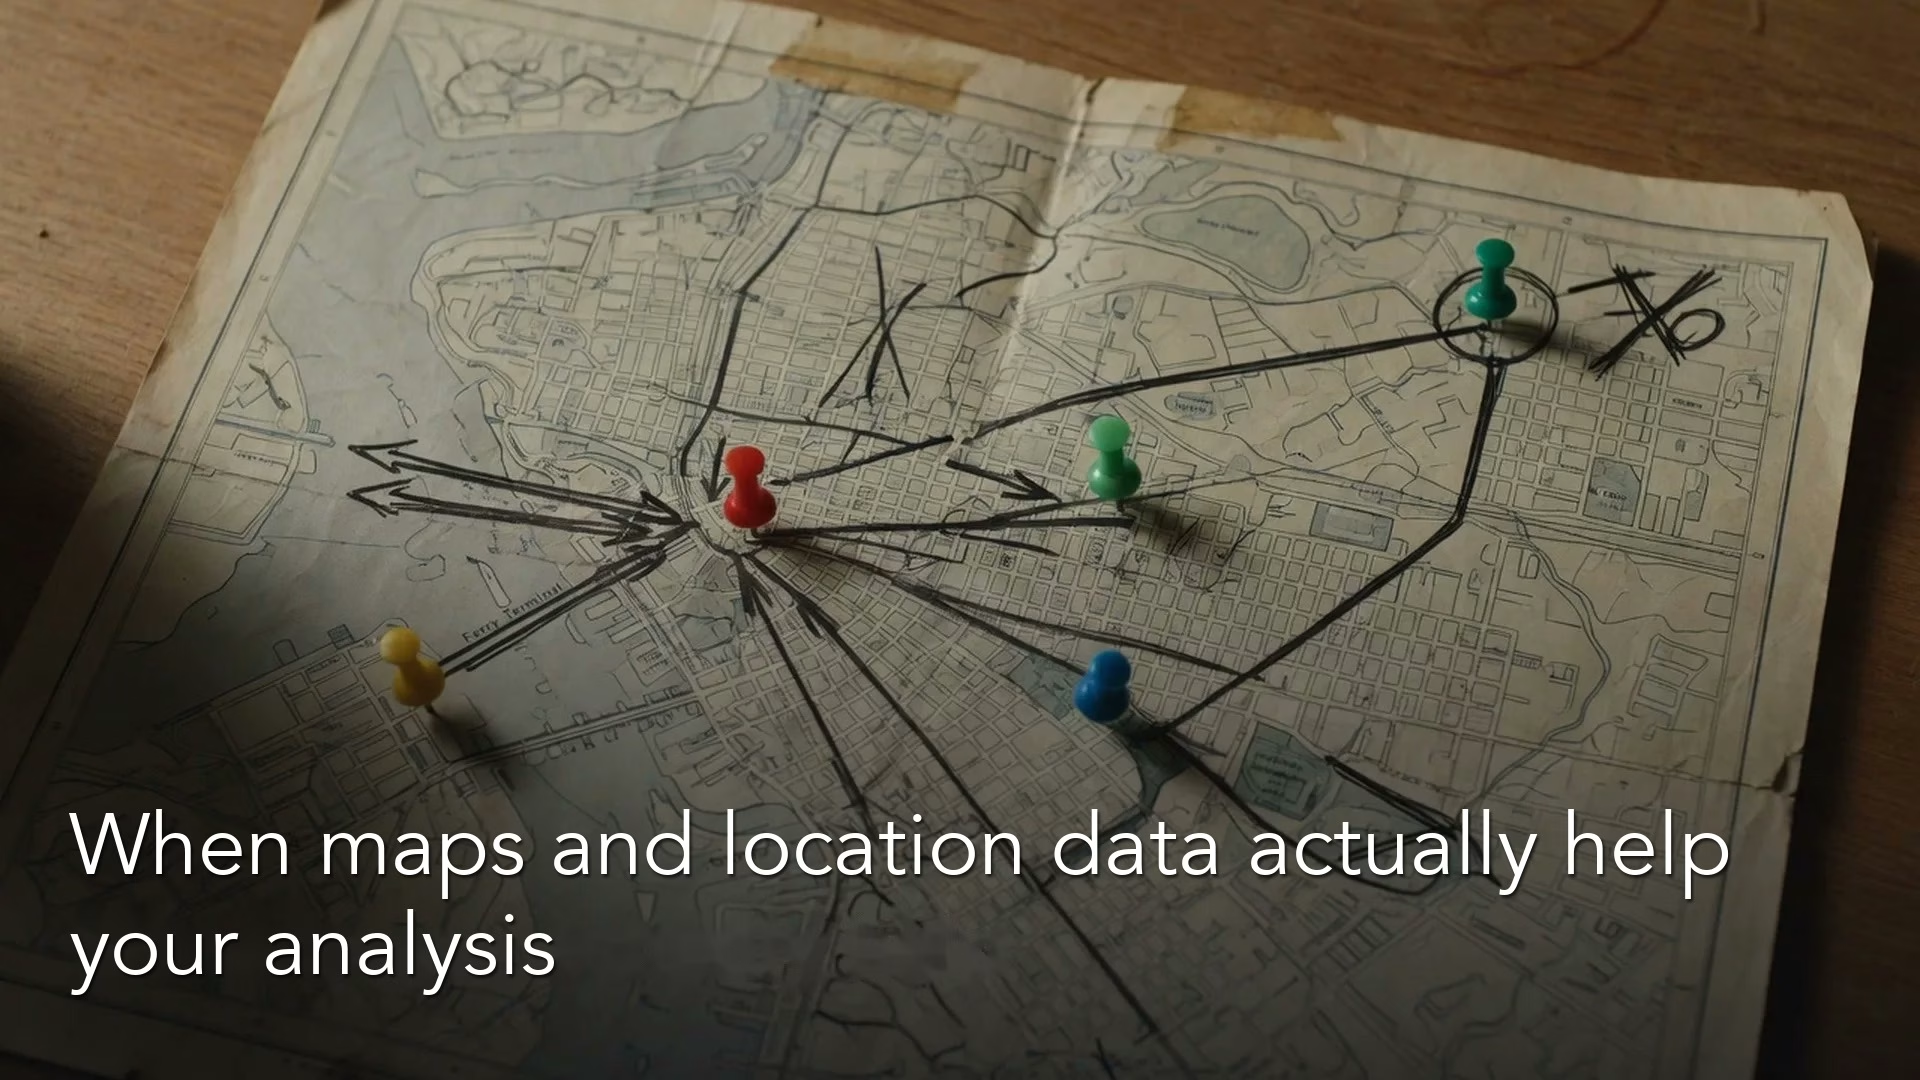
When maps and location data actually help your analysis
Geospatial analysis helps when location changes the decision, not when a map would merely look executive. Learn good-fit use cases, weak-fit traps, and a project card before you…
What are ARR and MRR? Recurring revenue explained for non-finance people
ARR and MRR sound simple until three teams report three different growth numbers. Learn the non-finance vocabulary, what each metric includes, and how to ask definition questions without…