
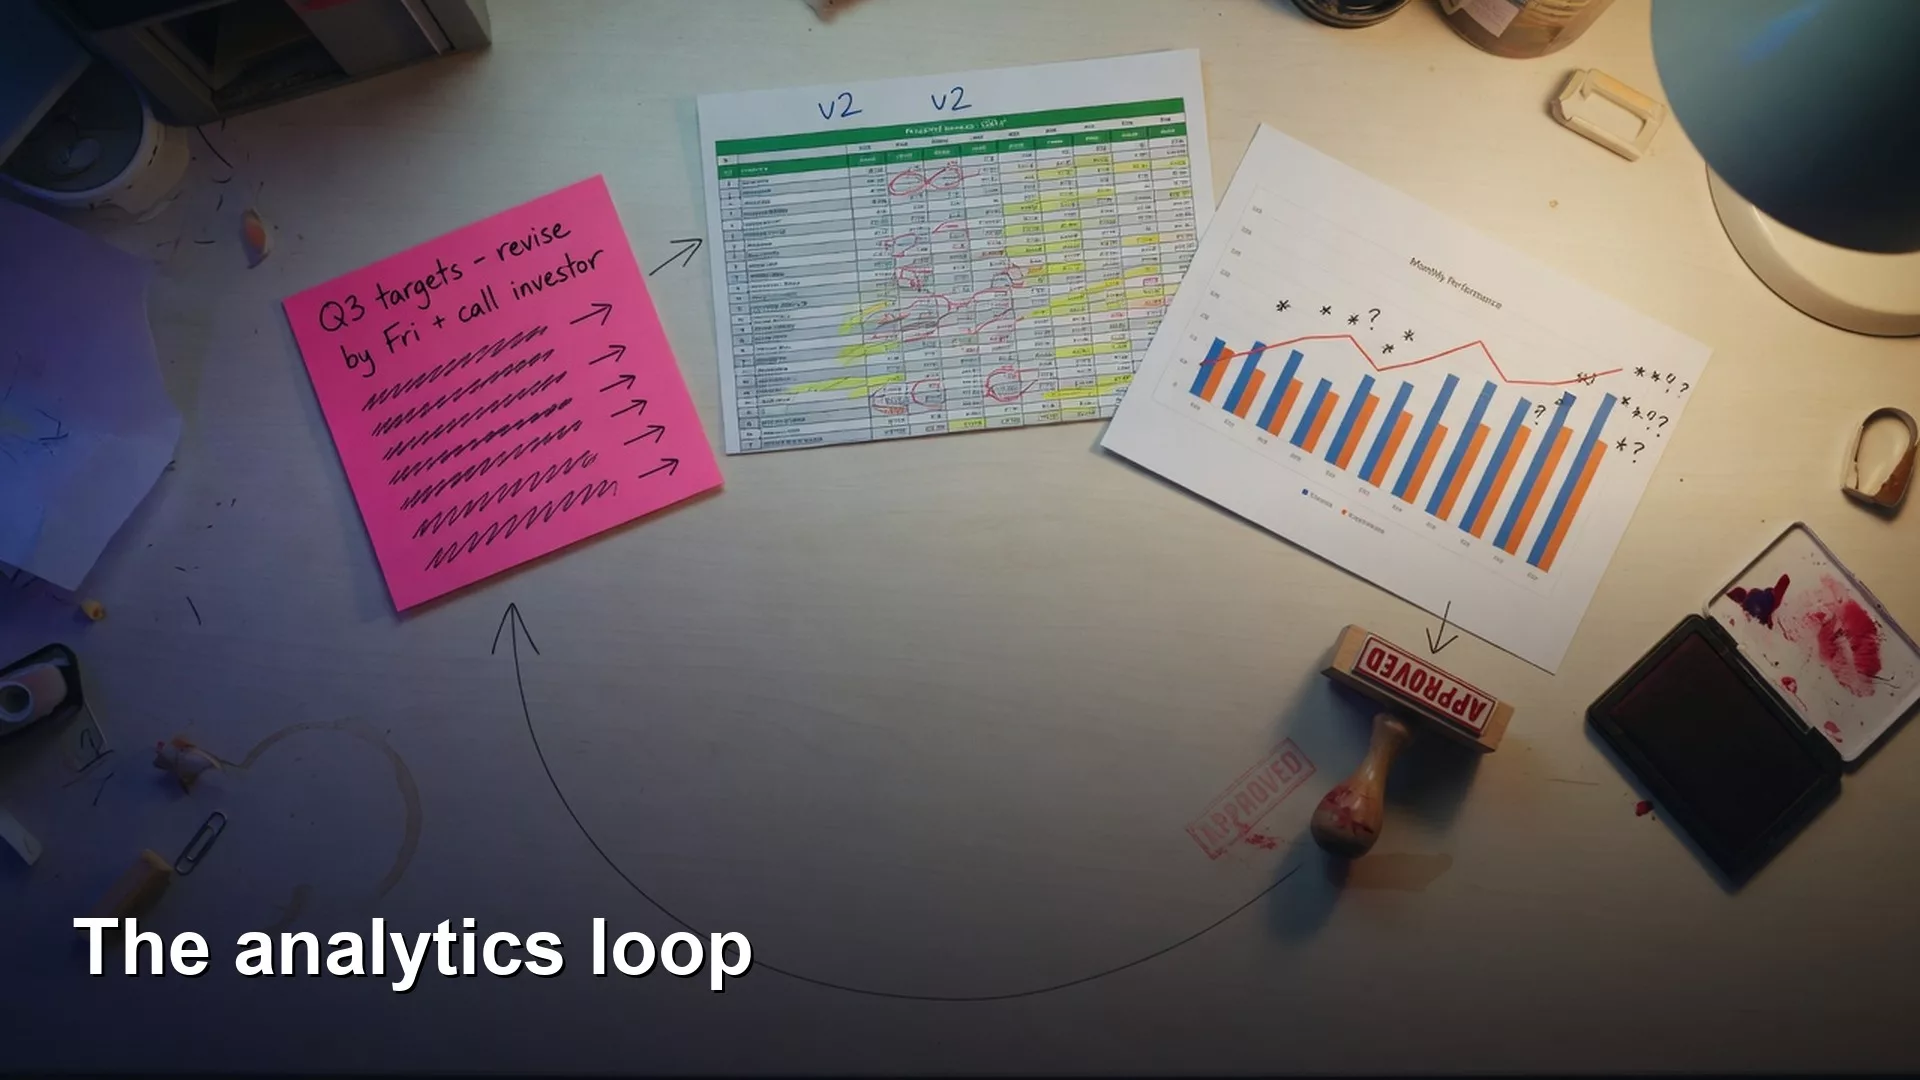
You built a solid chart. The meeting nodded. Someone said “interesting.” Then everyone went back to Slack, and three weeks later the same argument returned with slightly different colors.
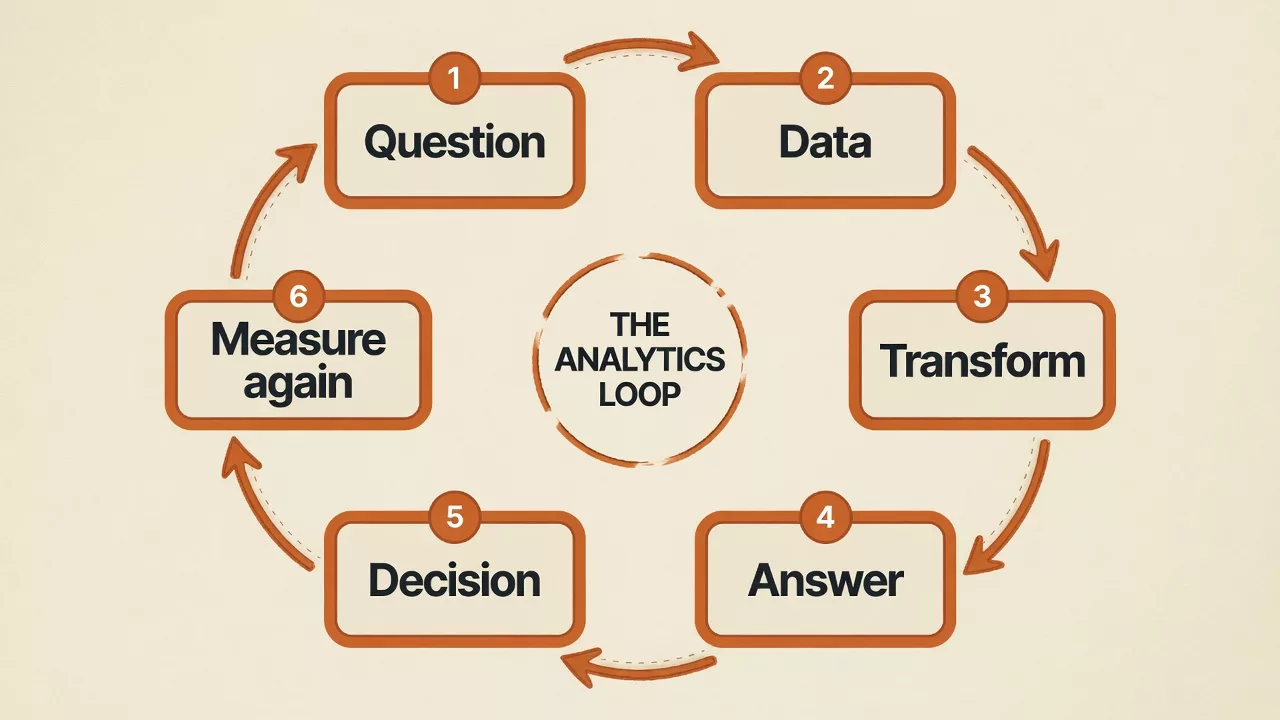
That is what analytics looks like when it is a one-way street: question in, slide out, file closed. Real work is a loop. You ask, gather, transform, answer, decide, and then measure again so the next question is smarter than the last one.
This is part 3 of Analytics foundations. Part 1 covered framing the problem. Part 2 separated data, information, and insight. Here we wire those ideas into a repeatable cycle you can run on a Tuesday afternoon without a six-month “analytics transformation.”
What you’ll learn
- The six steps of the analytics loop (and why “done” is a myth)
- What good work looks like at each step
- A worked example from question to measure-again
- Where teams get stuck (and how to unstick without drama)
- A lightweight checklist you can paste into tickets
The loop at a glance
Example:
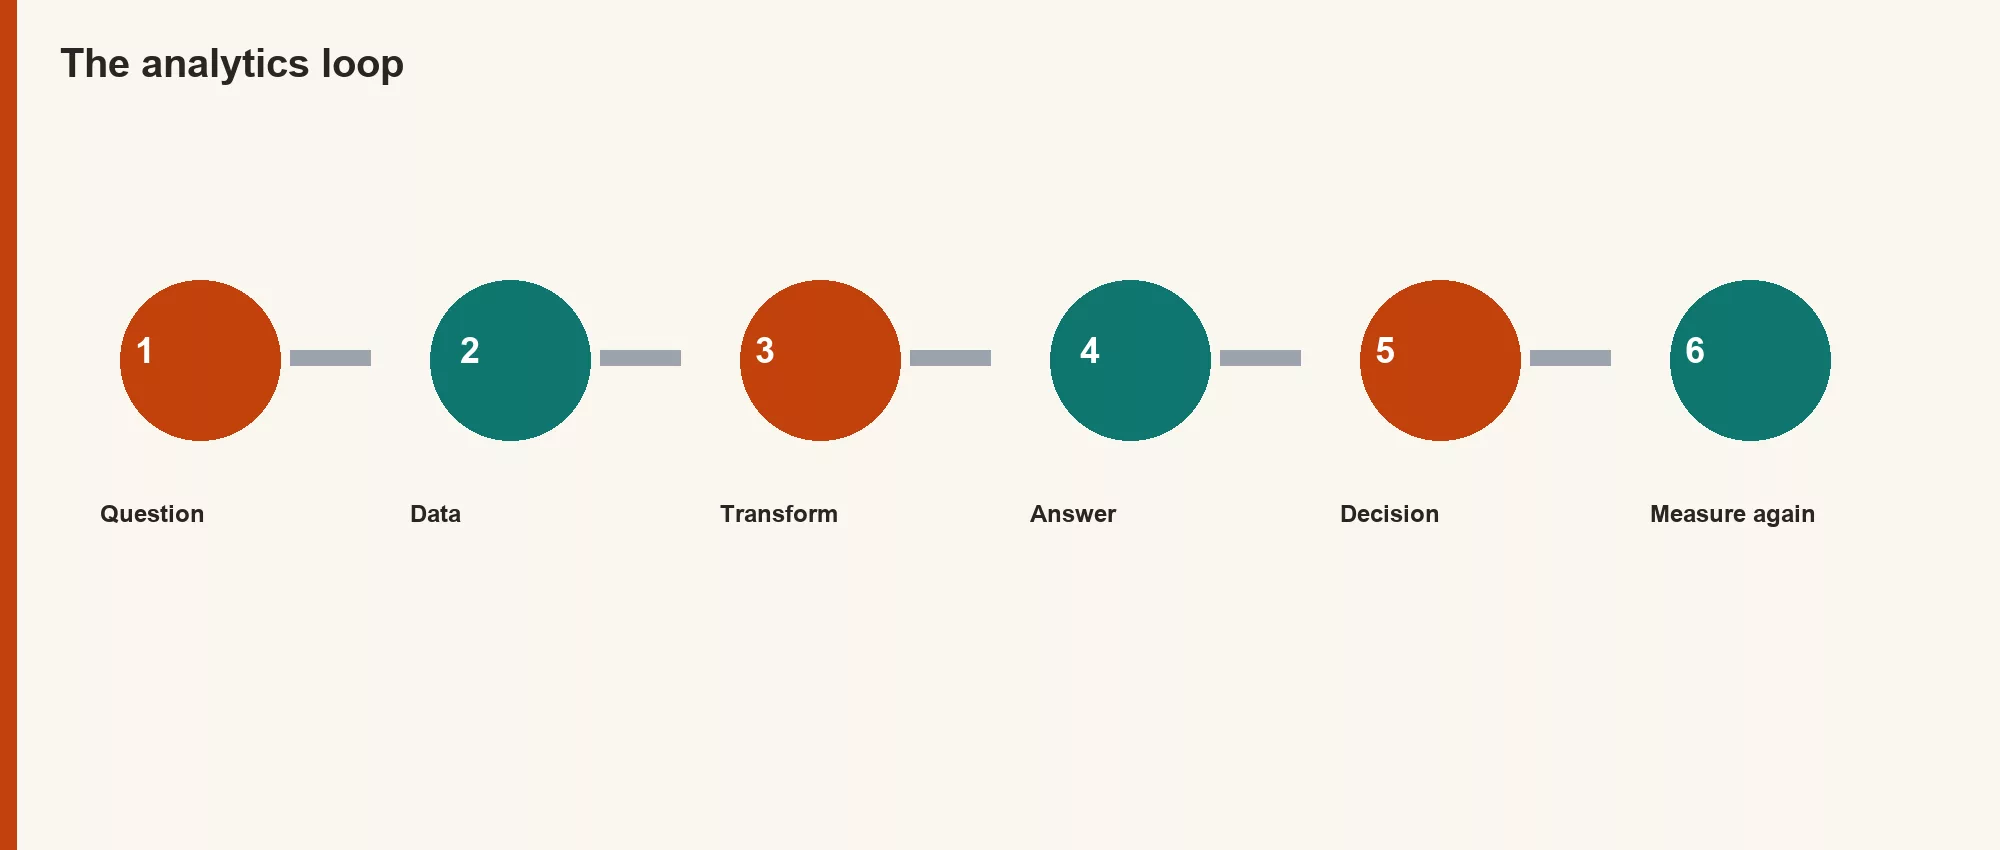
Here is the whole cycle as one picture. Keep it nearby. We will walk each box with the same shipping example.
| Step | Job in plain English | Typical output |
|---|---|---|
| 1. Question | Name the decision and what you need to learn | Problem brief |
| 2. Data | Find recorded facts that could speak to it | Sources, fields, grain |
| 3. Transform | Clean, join, filter, aggregate into something readable | Table, metric, model input |
| 4. Answer | State what the information says (with caveats) | Clear finding |
| 5. Decision | Someone chooses what to do (or not do) | Action, owner, date |
| 6. Measure again | Check whether the world moved after the choice | Follow-up metric, new question |
If you stop after step 4, you produced information. If you stop after step 5 without step 6, you made a bet you will never grade. The loop is what turns analytics from theater into learning.
Step 1: Question
Start with the decision, not the dataset. Reuse the sentence from part 1:
We need to understand ___ so that ___ can decide whether to ___ by ___, with success looking like ___.
Example we will carry through this post:
We need to understand whether late ground shipments are concentrated in one warehouse so that Ops can decide whether to change the packing SLA for that site by next Friday, with success defined as a clear late-rate comparison and a go or no-go on the SLA pilot.
Without that sentence, every later step drifts. With it, you know what “enough analysis” means.
Step 2: Data
Data is what was recorded: packages, timestamps, warehouses, carriers. List sources and grain before you join five systems “just in case.”
For our example, the minimum useful data might be:
- One row per package (grain)
- Ship timestamp, delivery timestamp (or null if still open)
- Warehouse code
- Service level (ground vs express)
- Exclude test and cancelled packages
If a field does not exist, say so early. Missing data is a finding, not a personal failure. Part 2’s ladder still applies: raw extracts are data until you structure them.
Step 3: Transform
Transform means turning rows into something a human can use: definitions, filters, joins, aggregates. This is where SQL, Python, and spreadsheet formulas live. It is also where silent bugs hide.
Define “late” in writing before you code it. Example: ground package is late if delivery is more than 2 calendar days after ship date, ignoring Sundays if that is company policy. Then implement the definition once.
Here is a sketch that builds weekly late rate by warehouse for ground packages. Comments map back to the brief.
-- Question: late ground packages by warehouse (last 8 complete weeks)
-- Grain: one row per package
-- Definition: late if delivery_date > ship_date + 2 days
SELECT
  warehouse_code,
  DATE_TRUNC('week', ship_date) AS week_start,
  COUNT(*) AS packages,
  COUNT(*) FILTER (
    WHERE delivery_date IS NOT NULL
      AND delivery_date > ship_date + INTERVAL '2 days'
  ) AS late_packages,
  ROUND(
    100.0 * COUNT(*) FILTER (
      WHERE delivery_date IS NOT NULL
        AND delivery_date > ship_date + INTERVAL '2 days'
    ) / NULLIF(COUNT(*), 0),
    1
  ) AS late_rate_pct
FROM shipments
WHERE service_level = 'ground'
  AND is_test = FALSE
  AND is_cancelled = FALSE
  AND ship_date >= CURRENT_DATE - INTERVAL '8 weeks'
  AND ship_date < DATE_TRUNC('week', CURRENT_DATE)
GROUP BY 1, 2
ORDER BY 1, 2;
That output is still information, not a decision. You have rates by warehouse and week. You have not yet said what Ops should do. For AI-written SQL, run the same checklist you use on human SQL: grain, filters, join type, sample totals (see How to Check AI-Written SQL Before You Ship It).
Step 4: Answer
The answer is a plain-language statement of what the information shows, plus caveats. No hero music required.
Example answer:
Warehouse B’s ground late rate sat near 11% for four weeks while A and C stayed near 5-6%. The gap is not explained by a spike in volume alone in this window. Caveat: we only have complete delivery timestamps on 97% of packages; open packages are excluded from “late.”
Notice what is missing: “we should hire more people,” “the carrier is bad,” “marketing broke peak.” Those might be later hypotheses. The answer step sticks to what the defined metric shows.
Step 5: Decision
Someone with authority chooses. Analysts can recommend. Owners decide. Write the choice down like a receipt.
| Field | Example |
|---|---|
| Owner | Jordan (Ops) |
| Choice | Pilot a tighter packing SLA at Warehouse B for 4 weeks |
| Start | Monday after review |
| Success signal | Late rate under 7% for 3 consecutive weeks without overtime spike |
| Kill criteria | Stop if cost per package rises more than 8% vs prior 4 weeks |
If no one will own a choice, you are still in the information business. That can be fine. Label it honestly so the loop does not fake closure.
Step 6: Measure again
This is the step teams skip when they are busy celebrating the pilot kickoff. Measuring again is how you learn whether the decision worked and what to ask next.
Below is a toy example chart (made-up numbers for teaching). It shows a late rate that stayed high, then fell after a process change between week 4 and week 5. Your real chart should use your real definition and window.
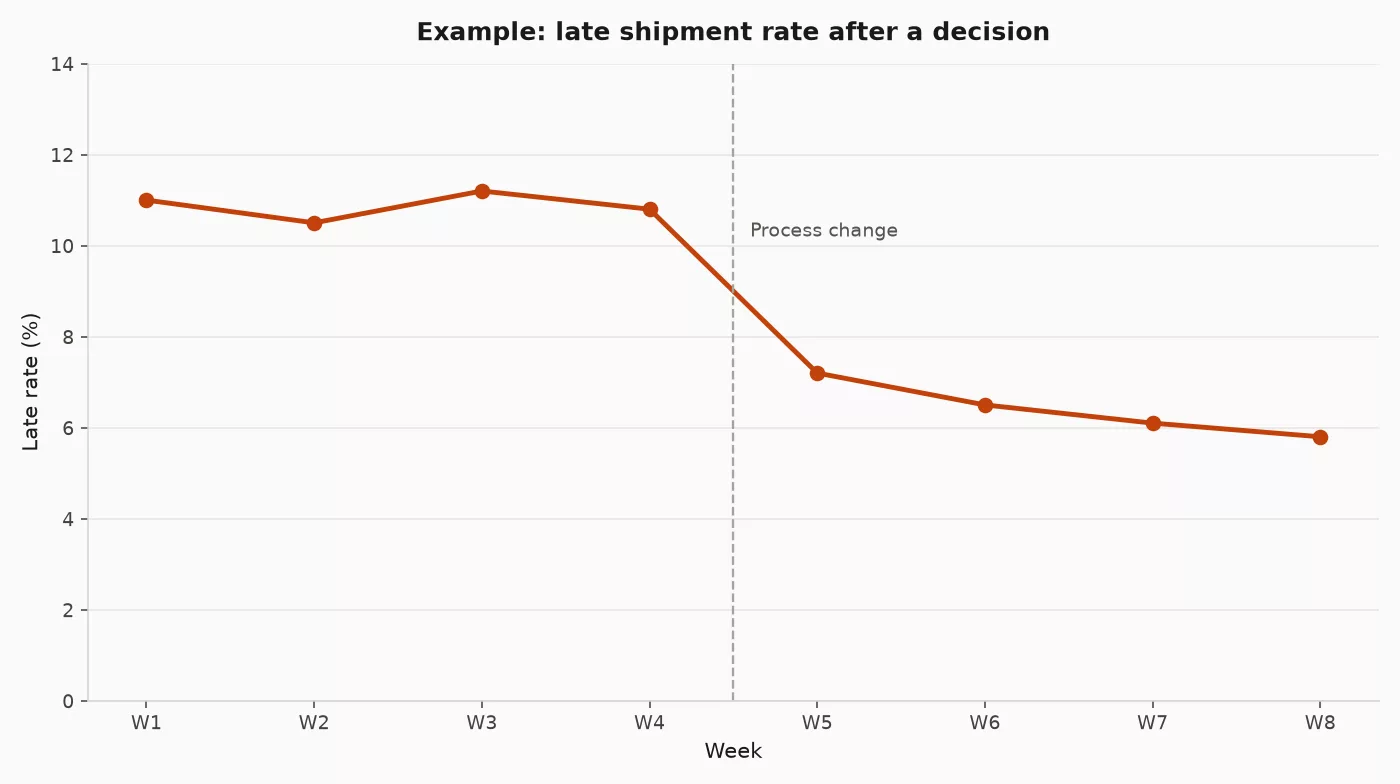
Measure again produces new questions: Did quality hold? Did cost rise? Did another warehouse get worse because volume shifted? That is not failure. That is the loop spinning correctly.
Worked walkthrough: one page story
Put the six steps in order for our warehouse story:
- Question: Should Ops pilot a packing SLA change at B?
- Data: Package-level shipments with ship/delivery times and warehouse.
- Transform: Define late, filter ground, aggregate weekly rates.
- Answer: B is roughly double A/C on late rate for four weeks.
- Decision: Pilot SLA for four weeks with kill criteria.
- Measure again: Track late rate and cost; open a new question on carrier mix if rate falls but cost jumps.
Each step has a different “done.” Coding is not done. A meeting is not done. A decision plus a follow-up metric is closer to done, until the next loop starts.
Where teams get stuck
Stuck on data
Endless hunting for perfect sources. Fix: time-box discovery, list what you can answer with 80% of fields, and name what you cannot answer yet.
Stuck on transform
Polishing joins forever. Fix: ship a narrow metric that matches the decision, then improve the model.
Stuck on answer without decision
Beautiful decks, no owner. Fix: put the owner’s name on the first slide. If there is no owner, stop calling it a decision project.
Stuck after decision
No measure-again plan. Fix: write the success metric and review date in the same ticket as the decision.
Ticket checklist (copy/paste)
| Loop step | Fill in |
|---|---|
| Question | Decision owner, choice, deadline, success shape |
| Data | Sources, grain, known gaps |
| Transform | Definitions, filters, primary metric SQL/logic |
| Answer | Finding + caveats (3 sentences max) |
| Decision | What was chosen, by whom, when it starts |
| Measure again | Metric, review date, kill criteria |
If a cell is empty when you “finish,” you know which step you skipped.
How this connects to the rest of foundations
- Part 1 makes step 1 real.
- Part 2 tells you whether you are holding data, information, or insight at steps 2-4.
- Part 4 will cover good enough vs perfect data (how hard to push in steps 2-3).
- Part 5 will cover reading numbers carefully (how not to fool yourself in steps 4 and 6).
When you implement transforms, the SQL series and Learn hub are there. The loop is the map; SQL is one of the vehicles.
Practice this week
- Pick one active analysis or dashboard request.
- Write which loop step you are on today (be honest).
- Fill the checklist table for that work.
- If step 5 is blank, schedule a 15-minute decision conversation.
- If step 5 is filled but step 6 is blank, add a review date before you open a new project.
FAQ
Is this the same as CRISP-DM or “scientific method”?
Same family of ideas: iterate, do not pretend one pass is final. The loop here is tuned for everyday business analytics, not only formal data science projects.
How long should one loop take?
From hours to a few weeks depending on risk. A social post A/B test can loop in days. A warehouse SLA pilot might loop in a month. Match the loop length to the cost of being wrong.
What if leadership wants a dashboard, not a loop?
Dashboards can support many loops if each tile has an owner and a decision. Without that, a dashboard is a museum of information. Build the museum only if someone tours it on purpose.
Where do KPIs fit?
KPIs are often the “measure again” instruments. They are information that watches a decision over time. See All About KPIs for design; use this loop to decide which KPI earns a home on the wall.
Quick recap
- Analytics is a loop: question, data, transform, answer, decision, measure again.
- Each step has a different definition of done.
- Skipping measure-again turns decisions into superstition.
- Write the loop into tickets so work cannot “finish” with empty steps.
- The next question is a feature, not a bug.
In one sentence: Good analytics does not end at the chart; it ends when you measured what happened after someone decided.
Sources
Research and further reading used for this article:
- CMC Canada: Are you solving the right analytics problem? (problem definition before methods)
- Indiana Wesleyan University: Data-driven decision-making overview (goals, quality, common pitfalls)
- AMS: What problem are we actually solving? (part 1)
- AMS: Data vs information vs insight (part 2)
- AMS: All about KPIs
- AMS: Check AI-written SQL before you ship
- AMS: SQL series
- AMS: Learn hub
Keep going
Same lessons in your feed
Short diagrams and hooks on Instagram, X, and Facebook.
Merch on Etsy
Open store → Boxplot Mouse Pad, Data Science Mouse Pad, Analytics Mouse Pad, Box Plot, Whisker Plot
View on Etsy →
Boxplot Mouse Pad, Data Science Mouse Pad, Analytics Mouse Pad, Box Plot, Whisker Plot
View on Etsy →
 Naive Bayes Mouse Pad, Data Science Mouse Pad, Analytics Mouse Pad, Bayesian Mouse Pad
View on Etsy →
Naive Bayes Mouse Pad, Data Science Mouse Pad, Analytics Mouse Pad, Bayesian Mouse Pad
View on Etsy →
 Imbalanced Classes Mouse Pad, Data Science Mouse Pad, Analytics Mouse Pad, Imbalanced Mouse Pad
View on Etsy →
Imbalanced Classes Mouse Pad, Data Science Mouse Pad, Analytics Mouse Pad, Imbalanced Mouse Pad
View on Etsy →
 You're On Mute White Ceramic Coffee Mug, Data Science Mug, Data Mug, Analytics Mug, Statistics Mug, Programming Mug, Gift Mug, Coffee Mug
View on Etsy →
You're On Mute White Ceramic Coffee Mug, Data Science Mug, Data Mug, Analytics Mug, Statistics Mug, Programming Mug, Gift Mug, Coffee Mug
View on Etsy →