
To find out whether a cheaper AI decision model is good enough, run it on a few hundred of your own past cases and compare three numbers in a spreadsheet: how often it is right, how much of the work it can take when it is sure, and what it costs. Vendor scores, including the public Decision Bench, tell you which models to try, not which one to pick.
Imagine you already use a decision model to sort incoming customer emails into teams, and this month a new one launches at less than half the price with a press post saying it beats yours. Before you switch, you want an answer you would stand behind if a customer email went to the wrong team. This post shows how to get it in an afternoon, using a spreadsheet and the same method applied to Decision Bench’s published answers.
A decision model is an AI that picks from a list of answers you give it and returns how sure it is about each one, instead of writing text. If that is new, start with Microsoft Decision-1 explained, which covers the models that launched in October 2026, and Alternatives to TypeSafe’s Jev for the earlier ones.
Why a vendor’s score is not your answer
Almost every decision model launched this autumn came with a number its maker chose. Perplexity said on X on October 9, 2026 that its pplx-decider model scored highest on Decision Bench. Subquadratic’s SubQ Snap page says it beats Jev on 13 of 16 business tests. Those can all be true and still tell you little about your emails, because your categories, your wording, and your hard cases are not in anyone’s test.
Decision Bench is useful because it publishes everything. Its site lists 1,071 rows drawn from public datasets across eleven kinds of task, from support tickets to code and legal text, with each row’s source, license, and correct answer. Its protocol says every model gets the same rows, the same instructions, and one multiple-choice question per row. It also says plainly that public datasets may have been in the models’ training data, so scores may be inflated.
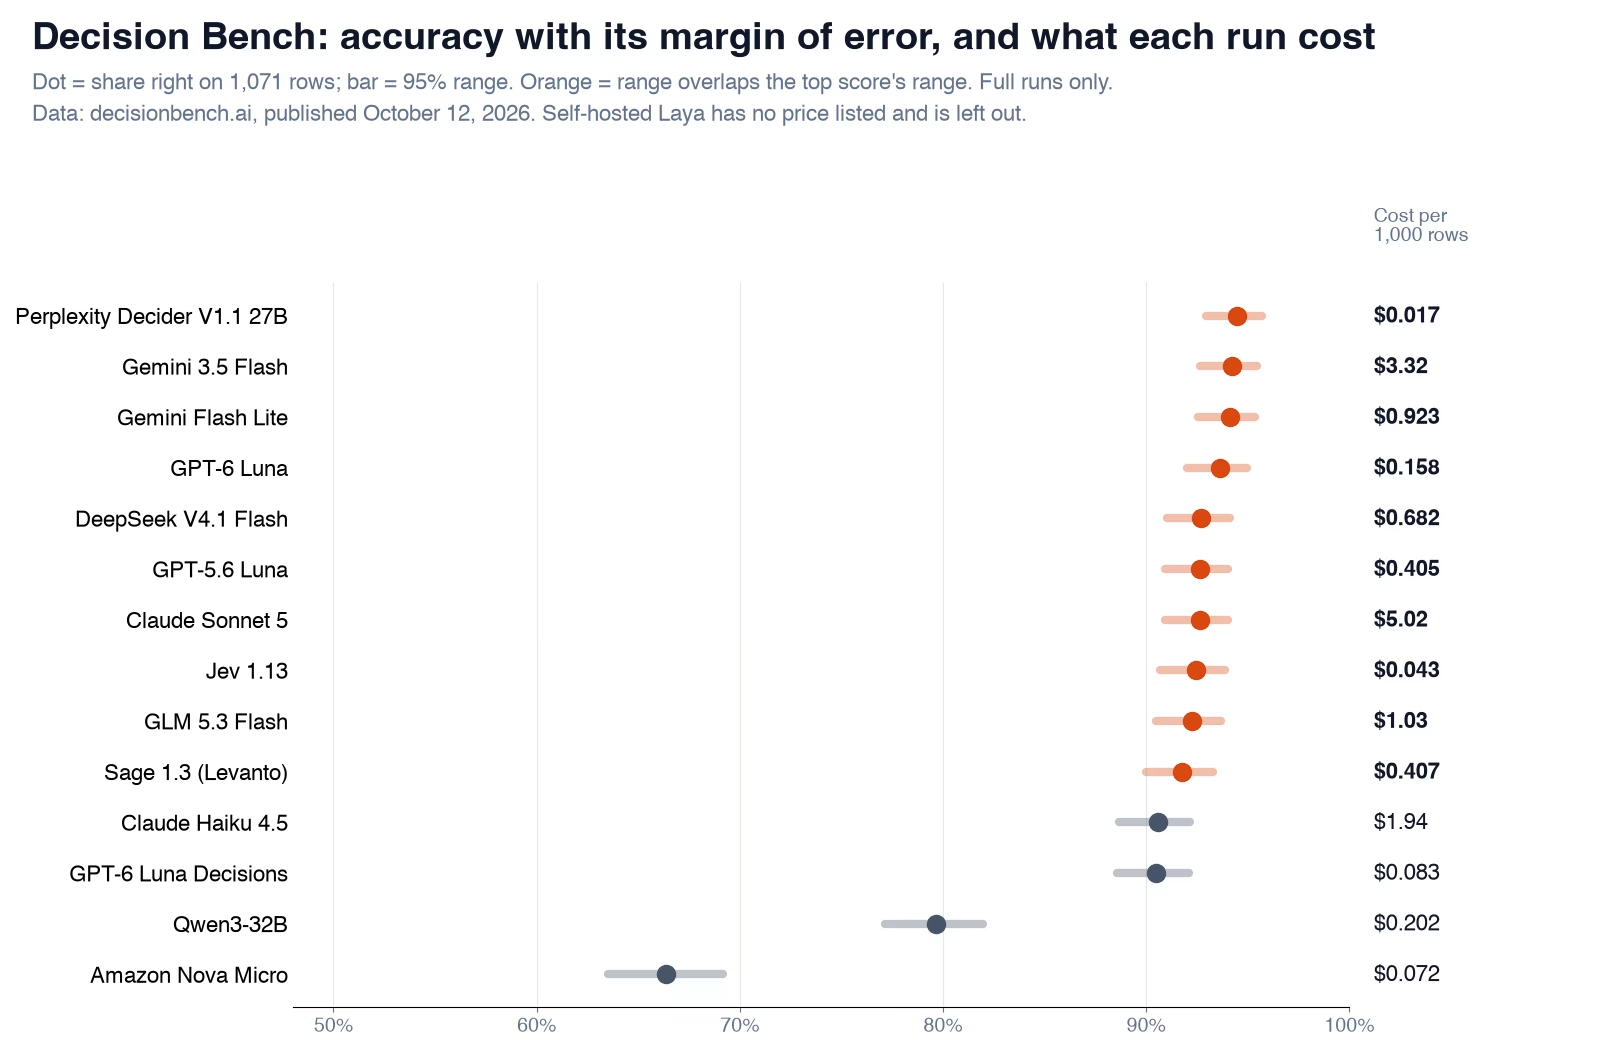
Read the chart slowly. The top score was 94.5%, but the bar around each dot is its 95% range, the span where the true accuracy probably sits given 1,071 rows. Ten of the fourteen models that ran every row have ranges that overlap the top one’s range. On this test, that group is close to a tie, and what separates them is cost: from $0.017 to $5.02 per 1,000 rows.
Build a test set from your own past cases
Your test set is a list of past cases where you already know the right answer. Nothing fancy. For the email example, that is old emails plus the team that actually handled each one. Pull 200 to 500 of them. Fewer than 200 makes the margin of error too wide to compare two good models, as the next section shows.
Pick them to look like real traffic, then add the cases that worry you:
- About four in five drawn at random from recent months, so the mix matches what really arrives.
- The rest from the hard ones: emails that were rerouted, complaints that mention two problems, and messages that fit none of your teams.
- An “other” answer in your list of choices, because a model that must pick a team for every email will force the odd ones into the wrong place.
- No customer names or account numbers in the text you send to a vendor. Replace them before the test, the same way you would before pasting into any chat tool.
Then put the cases in a spreadsheet with one row per case. Send each one to the model you have and the one you are testing, with the same instructions, and record the answer each picks and how sure it said it was. Most decision models return a probability for every option; the confidence is the probability of the option it picked.
| A: case | B: right answer | C: model picked | D: confidence |
|---|---|---|---|
| 1 | Billing | Billing | 0.97 |
| 2 | Technical | Technical | 0.91 |
| 3 | Other | Billing | 0.58 |
| 4 | Account | Account | 0.99 |
Score it with three formulas
You need three numbers per model. Accuracy is how often it was right. The handled share is how much of the work it could take on its own if you only let it act when it is very sure. The cost is what 1,000 decisions would cost at your usual email length. These formulas work in Excel and Google Sheets, assuming 300 cases in rows 2 to 301 and the columns above.
Columns: A case, B right answer, C model's answer, D model's confidence (0 to 1)

E2 (copy down):          =IF(C2=B2, 1, 0)                      1 if right, 0 if wrong

Accuracy:                =AVERAGE(E2:E301)
Margin of error (95%):   =1.96*SQRT(G2*(1-G2)/COUNT(E2:E301))    G2 holds the accuracy

Handled share at 0.9:    =COUNTIF(D2:D301, ">=0.9")/COUNT(D2:D301)
Accuracy when handled:   =AVERAGEIFS(E2:E301, D2:D301, ">=0.9")
Wrong among handled:     =COUNTIFS(D2:D301, ">=0.9", E2:E301, 0)

Cost per 1,000:          =price_per_million_tokens * average_tokens_per_case / 1000
The margin of error formula is the standard rough one for a share. With 300 cases and accuracy near 90%, it comes out around 3.4 points either way, so two models whose accuracy is two points apart are not clearly different. If the gap you care about is smaller than the margin, test more cases before you decide.
Here are the same calculations applied to four models’ published answers on Decision Bench, with 0.9 as the bar for acting alone. The costs are Decision Bench’s own, for its row lengths, so yours will differ.
| Model | Accuracy (margin) | Handled at 0.9 | Right when handled | Wrong when handled | Cost per 1,000 rows |
|---|---|---|---|---|---|
| Perplexity Decider V1.1 27B | 94.5% (±1.4) | 83% | 98.9% | 10 | $0.017 |
| Jev 1.13 | 92.4% (±1.6) | 78% | 98.2% | 15 | $0.043 |
| GPT-6 Luna Decisions | 90.5% (±1.8) | 75% | 97.6% | 19 | $0.083 |
| Gemini 3.5 Flash | 94.2% (±1.4) | 84% | 97.4% | 23 | $3.32 |
Now look at the handled column. That is where the money is. If you let Perplexity’s model act alone at 90% confidence or higher, it would have taken 83% of the rows and been wrong on 10 of them. Jev would have taken 78% and been wrong on 15. Gemini 3.5 Flash, a large general model, matched the top accuracy but cost about 195 times as much per 1,000 rows, and its typical answer took about 3.6 seconds against about half a second.
Check that its confidence means something
A threshold only works if the model’s confidence is honest. Check it. When a model says 90%, it should be right about nine times in ten. Group your rows by stated confidence and compare each group’s actual accuracy. A model that says 95% and is right 75% of the time will send confident wrong answers straight to customers.
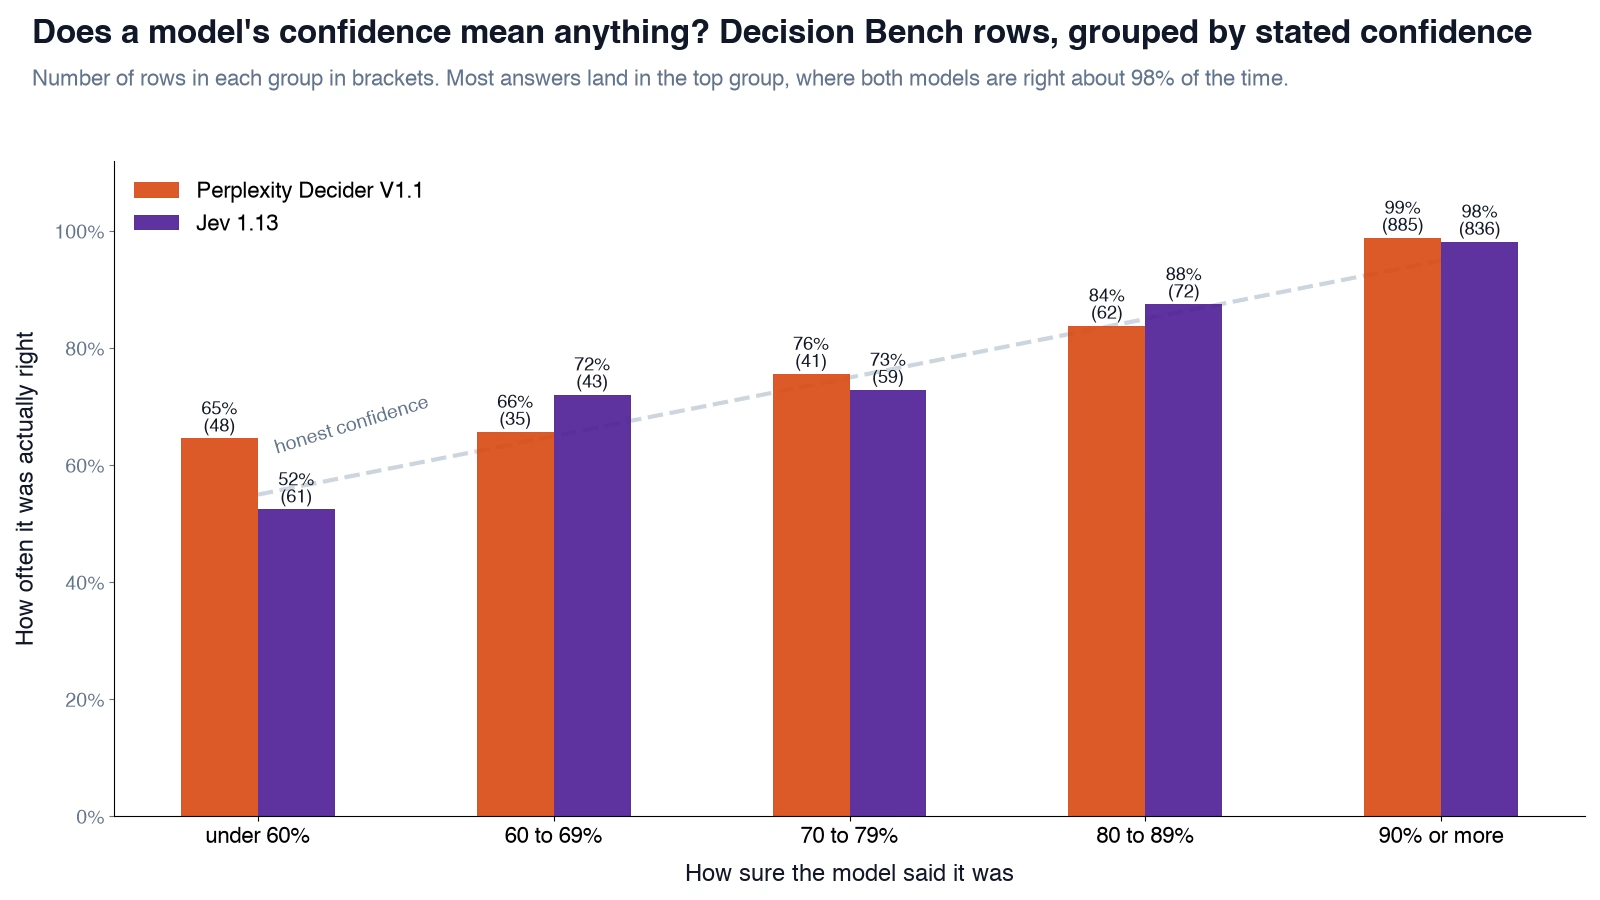
On Decision Bench, both models shown are close to honest at the top, where most answers land. The chart splits each model’s answers into five groups by stated confidence: under 60%, 60 to 69%, 70 to 79%, 80 to 89%, and 90% or more. In the top group, Perplexity’s model was right 99% of the time across 885 answers, and Jev 98% across 836. Lower down, the groups are small and jumpy, which is normal. Going from the lowest group up, Perplexity’s model was right 65%, 66%, 76%, and 84% of the time, and Jev 52%, 72%, 73%, and 88%. Run the same check on your own rows. If a model is overconfident on your data, raise its bar, or keep a person on every answer it gives.
Two kinds of case a text test misses
A spreadsheet of short emails will not tell you how a model does on two kinds of input that are becoming common. If your decisions involve either one, add a separate small test for it.
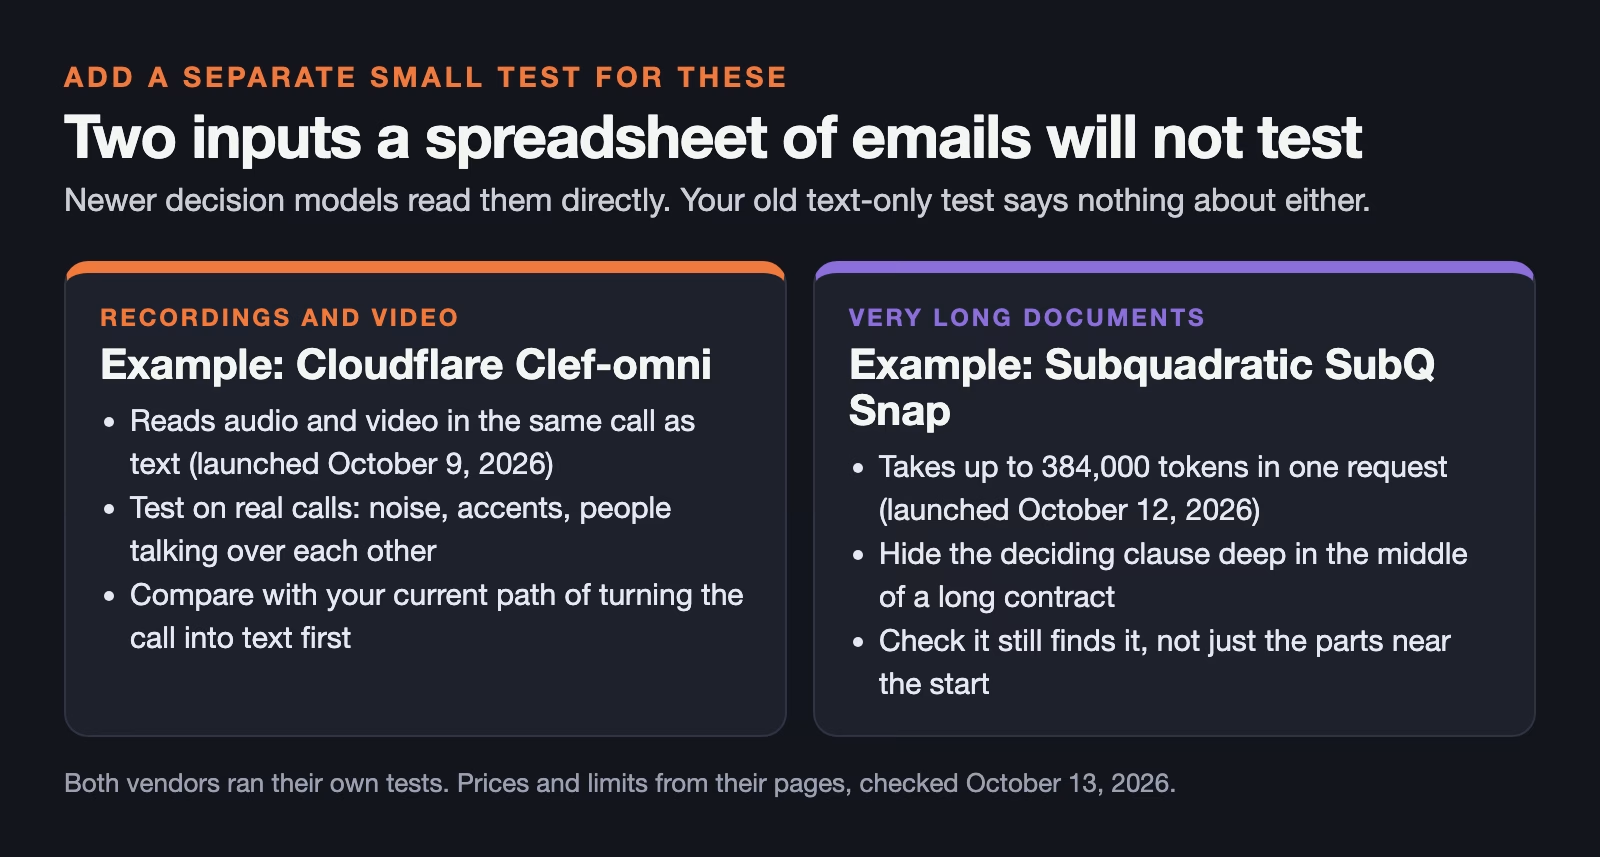
Recordings and video are the first. Cloudflare’s Clef-omni, launched October 9, 2026, reads audio and video in the same call as text, at $0.15 per million input tokens (a token is a small chunk of text, about three quarters of a word) on the Workers AI pricing page (checked October 13, 2026). If you route support calls, test on real recordings with background noise and accents, and compare against your current path of turning the call into text first. A text-only test cannot show where hearing the tone of voice helps or hurts.
Long documents are the second. Subquadratic’s SubQ Snap, launched October 12, 2026, accepts up to 384,000 tokens in one request according to its launch page, roughly the length of a long book. If your decision depends on a whole contract or a long case history, make test cases where the deciding clause sits deep in the middle. Many models do worse when the key fact is buried.
Decide with a rule you wrote down first
Write your switch rule before you look at the results. Numbers are persuasive, and a good-looking one can talk you into a switch you would not otherwise make. A rule like this works for most teams:
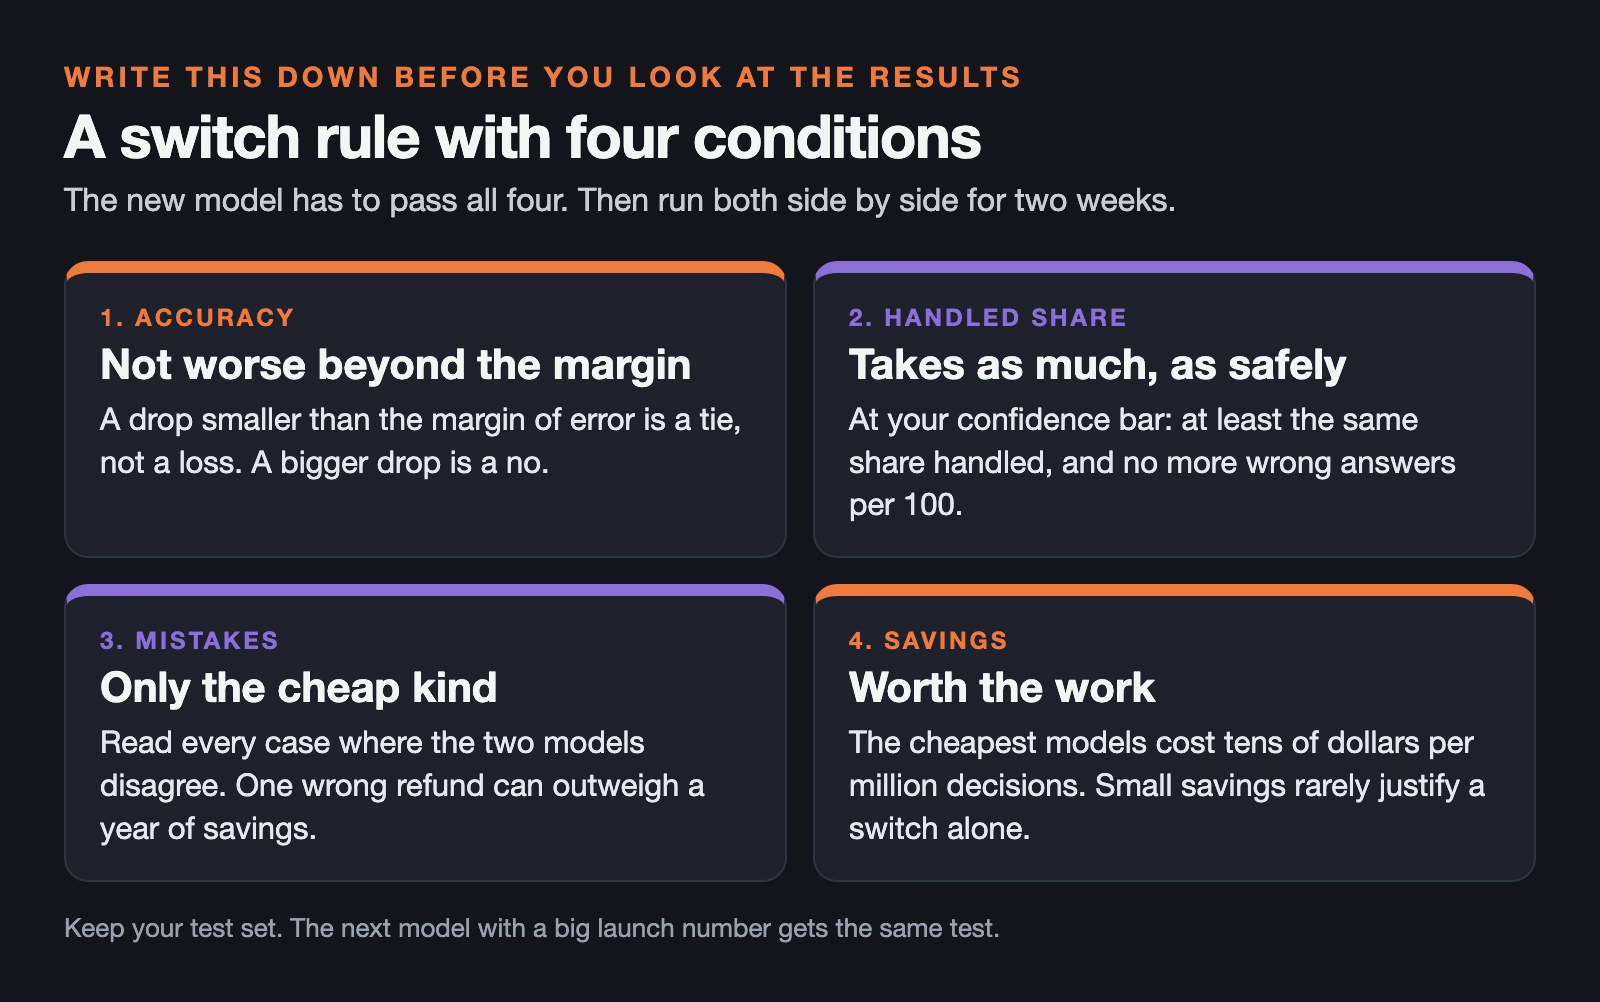
- Switch only if the new model’s accuracy is not lower than the current one by more than the margin of error, because a smaller gap could be luck in which cases you picked.
- At your chosen confidence bar, the new model must handle at least as large a share, with no more wrong answers per 100 handled.
- Its mistakes must be the cheap kind. Read every case where the two models disagree, because one wrong refund decision can cost more than a year of savings.
- The savings must be worth the work. At the prices above, a million decisions a month cost tens of dollars on the cheapest models, so a switch to save a few dollars is rarely worth the risk on its own.
When the new model passes, run both side by side on live traffic for two weeks, with the old one still making the real decision. If the live results match the test, switch, and keep the test set so you can run it again on the next model that launches with a big number.
What to do this week
Export 300 past cases with known answers from whatever system you already use for the decision, add 50 hard ones, and set up the spreadsheet columns above. Run your current model first, because its scores are the bar any new model has to clear. If you have no model yet, practice the formulas on Decision Bench’s published answers before you collect your own cases.
The guide to measuring whether AI saves your team time uses the same idea for people instead of models: decide the test before you see the result, then count.
Sources
- Decision Bench (1,071 rows, eleven task categories, published leaderboard and every model’s answers (data published October 12, 2026))
- Decision Bench: evaluation protocol (same rows and instructions for every model, one choice question per row, training-data contamination warning)
- Perplexity Developers on X (October 9, 2026) (self-reported Decision Bench result for pplx-decider-v1.1)
- Subquadratic: SubQ Snap (launch, 384,000-token requests, self-reported comparison with Jev)
- Cloudflare Workers AI pricing (Clef-omni price)
- Cloudflare blog: Introducing Clef-omni (October 9, 2026) (audio and video input)
Keep going
Same lessons in your feed
Short diagrams, hooks, and weekly tutorials on Substack, Instagram, X, and Facebook.



