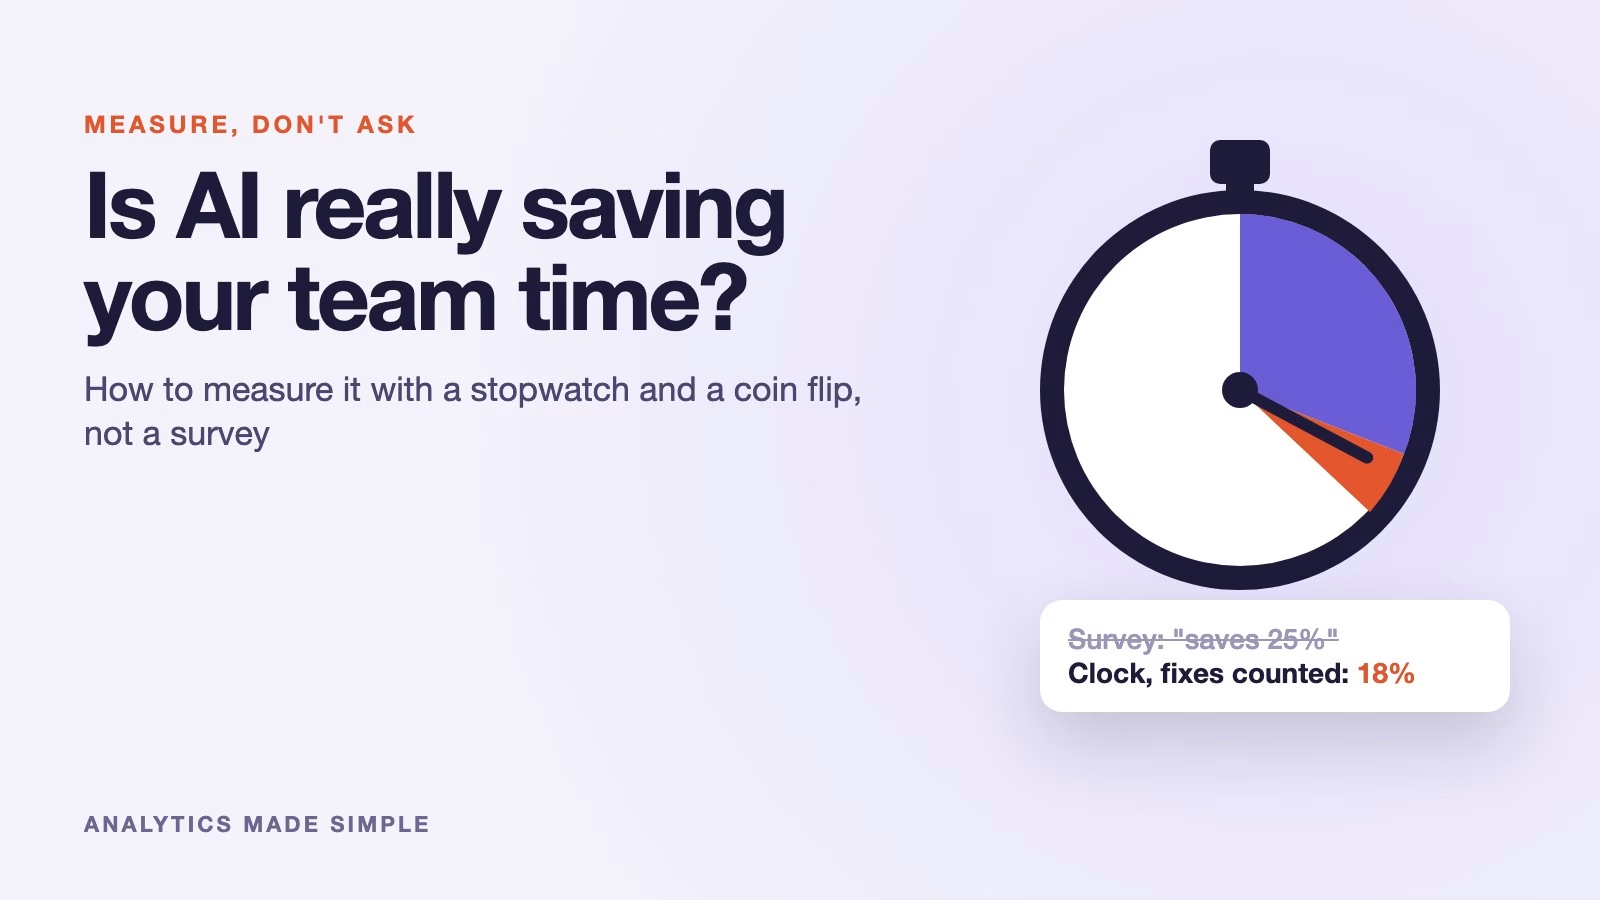
To find out whether an AI tool really saves your team time, time real work with it and without it, and count the fixes. Asking people how much faster they feel gives you a number, but it is often the wrong one. A fair test takes about five weeks and needs only a spreadsheet.
Imagine your manager asks whether to renew the AI writing assistant your team has used since spring. You send a quick survey, and the average answer says it saves about a quarter of everyone’s time. It sounds great until someone in finance asks why the team still finishes the same number of reports each week.
Why can’t you trust a survey about AI time savings?
People are poor judges of their own speed with a new tool, and a survey only measures what they believe. The clearest example comes from METR, a research group that studies AI. It ran an experiment with 16 experienced software developers on 246 real tasks from their own projects, and a coin flip decided whether AI was allowed on each task.
Before starting, the developers expected AI to make them 24% faster. After finishing, they still believed it had made them 20% faster. The clock said they took 19% longer with AI, according to METR’s July 2025 report.
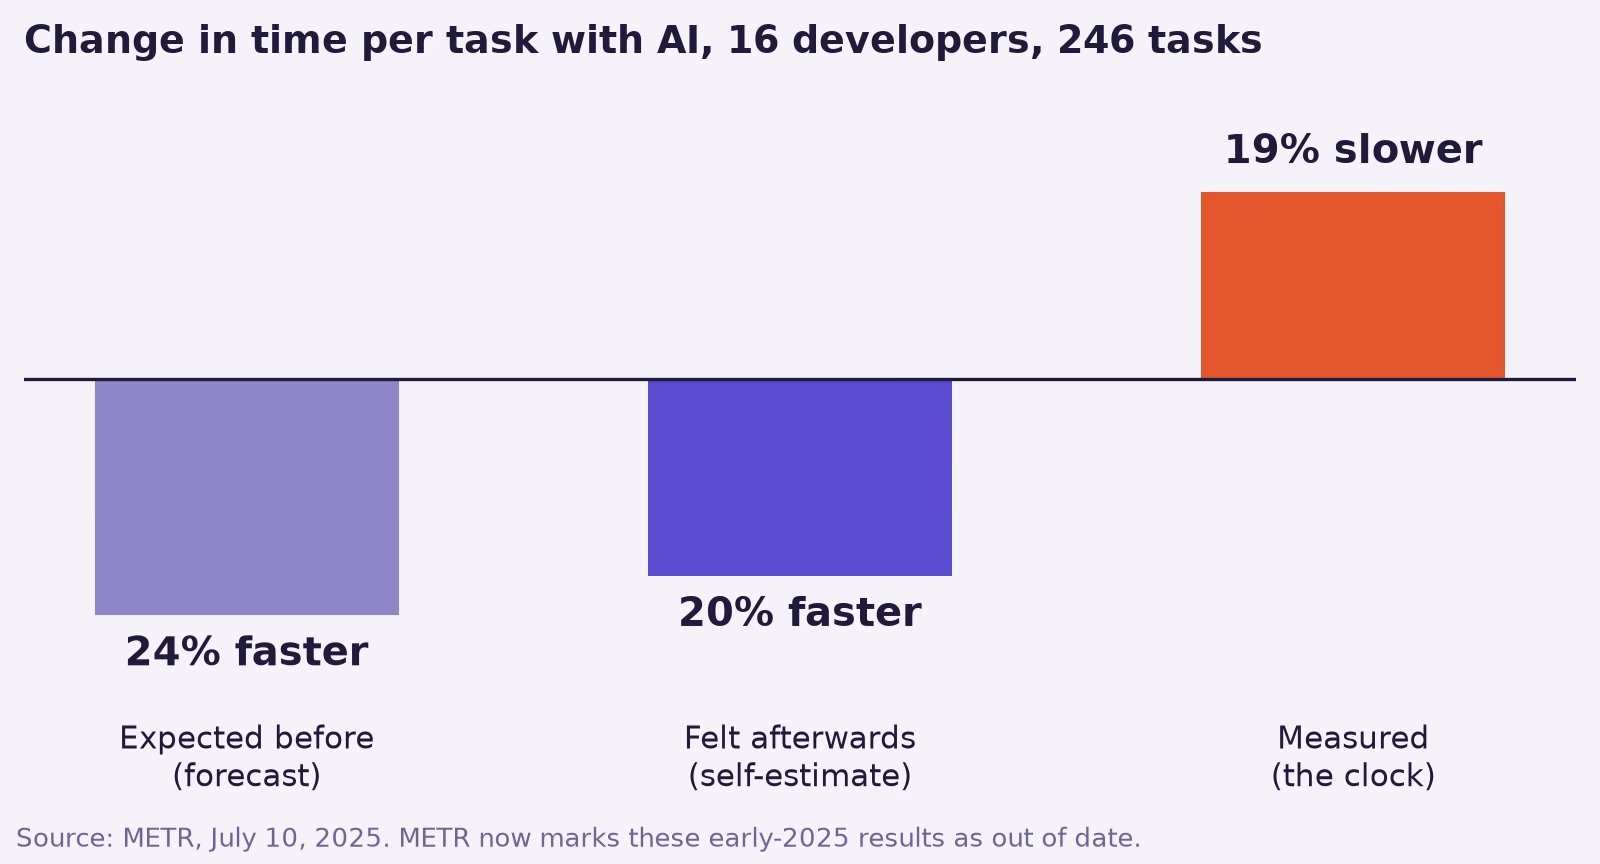
That gap is the lesson, more than the slowdown itself. Tools improve fast, and METR now marks those 2025 numbers as out of date. Its February 2026 update says newer tools probably speed developers up, but its new data cannot say by how much. The reason is useful too: many developers refused to join because they did not want to work without AI, which skews the sample.
So the feeling of speed tells you that people like the tool. It does not tell you whether the work got done faster. To learn that, you need a stopwatch and a fair comparison.
The three numbers that show real time savings
Measure three things for the same kind of task: how long each one takes, how often it comes back for fixes, and how many get finished. Time alone can fool you, because fast work that gets sent back costs the time twice.
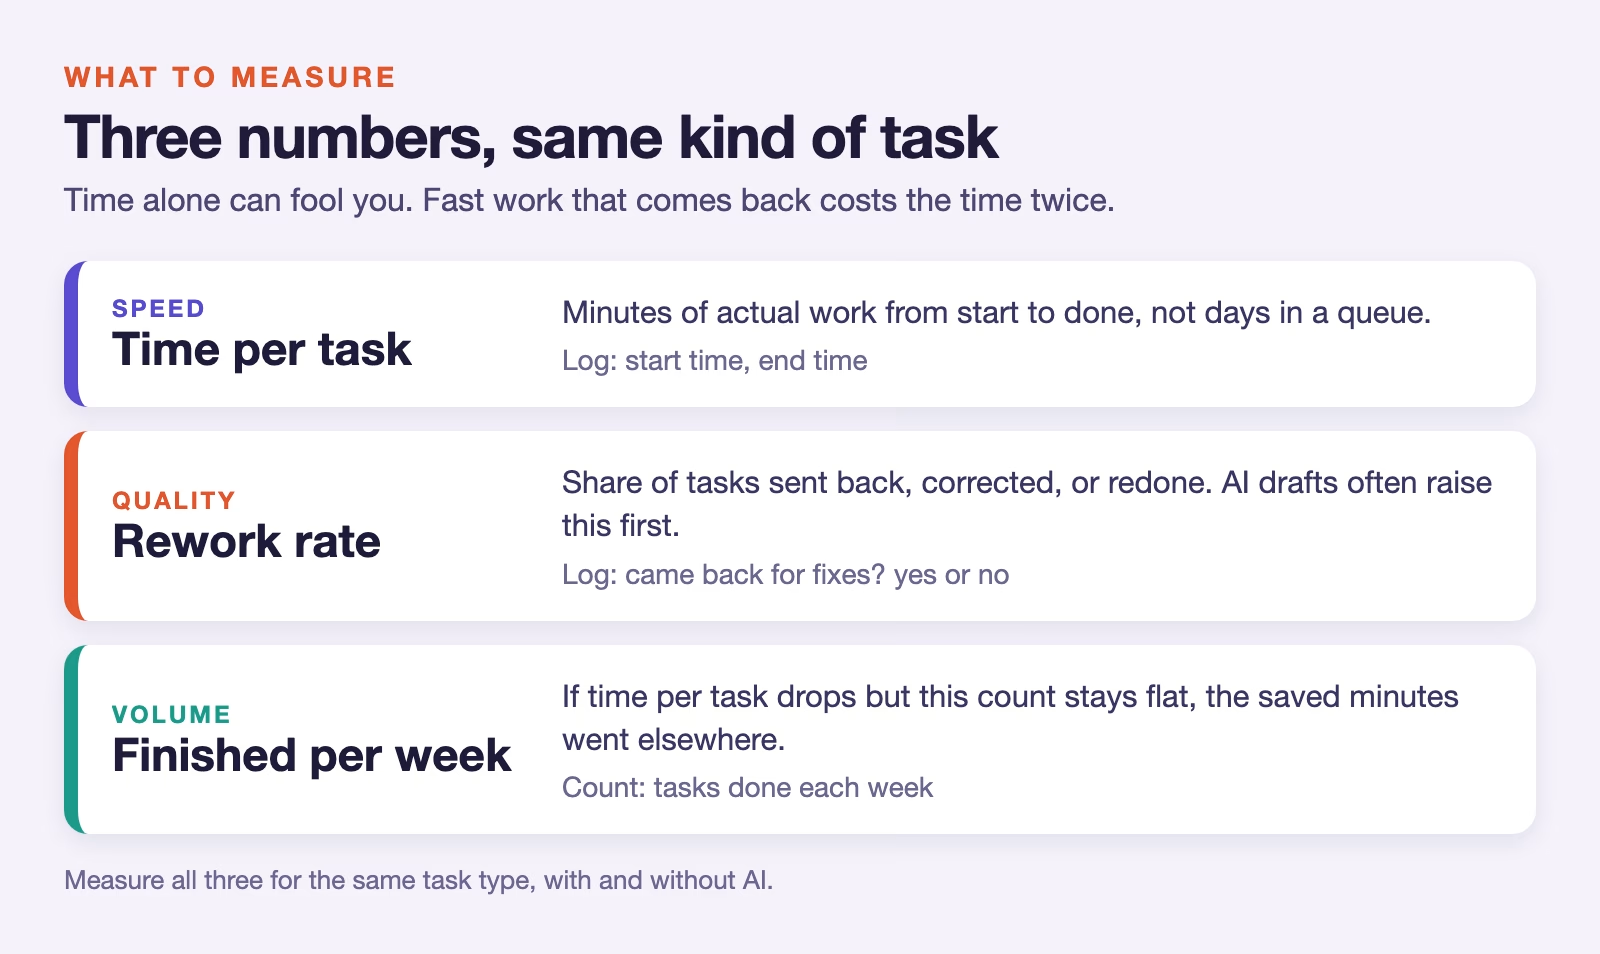
Time per task is the minutes from start to done. Use the time a person spends working on it, not the days it sits in a queue, so a busy week does not hide the effect. A simple start and stop entry in a spreadsheet is enough.
Rework rate is the share of tasks that someone sends back, corrects, or redoes. A report with a wrong number, an email a manager rewrites, or code that fails review all count. AI drafts often look finished but hide small errors, so this number tends to rise first.
Finished tasks per week is the volume. If time per task drops but the weekly count does not move, the saved minutes went somewhere else, like meetings or longer lunches. That is fine, but it is not the saving your manager is paying for.
A well-known study shows these numbers working together. Economists followed 5,179 customer support agents and measured issues resolved per hour, not opinions. Access to an AI assistant raised that by 14% on average and by 34% for new and less skilled agents, with little change for the most experienced, according to “Generative AI at Work”, a working paper published by the National Bureau of Economic Research, a US economics research group.
How to run a fair test in five weeks
A fair test compares the same people doing the same kind of task, with and without AI, and lets chance decide which tasks get AI. Chance matters because people tend to pick the easy tasks for the new tool, and easy tasks are fast anyway.
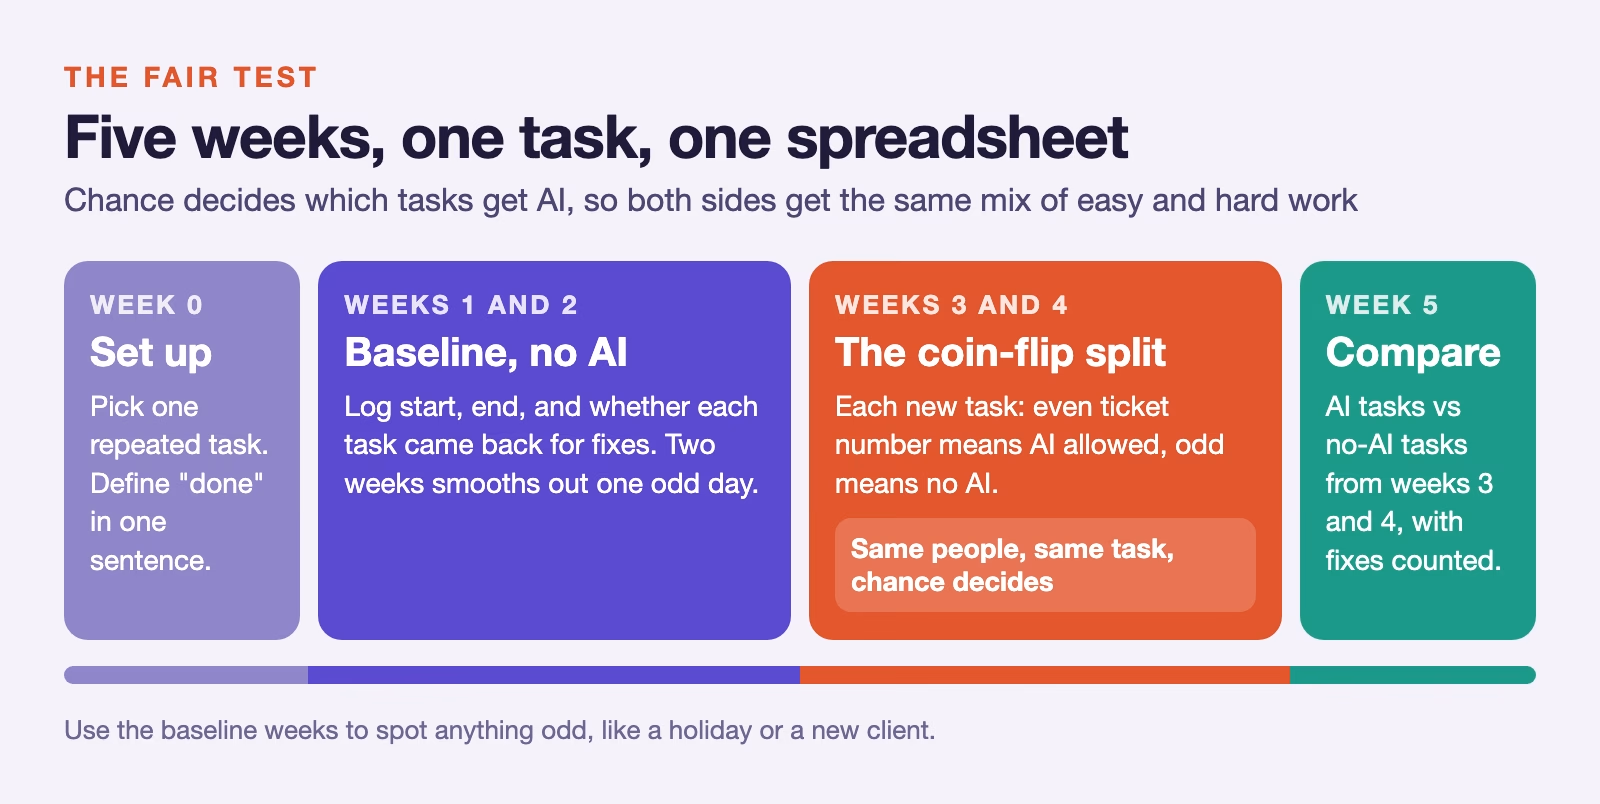
Week 0 is setup. Pick one task your team repeats often, such as weekly client reports, support replies, or data pulls. Write down what “done” means in one sentence, so everyone stops the clock at the same point.
Weeks 1 and 2 are the baseline, which means normal work with no AI on this task. Everyone logs start time, end time, and whether the task came back for fixes. Two weeks smooths out one odd Monday.
Weeks 3 and 4 are the split. For each new task, flip a coin or use the last digit of the ticket number: even means AI allowed, odd means no AI. Keep logging the same three things. Because chance decides, the AI group and the no-AI group get the same mix of easy and hard work.
Week 5 is the review. Compare averages for the AI tasks and the no-AI tasks from weeks 3 and 4. Use the baseline to check that nothing odd happened, like a holiday week or a new client.
A worked example: when the fixes eat the saving
Here is how the numbers can play out, using made-up numbers for a team that writes short client reports. In weeks 3 and 4 the coin sent 40 reports to each side. The table below shows what the log might hold.
| Made-up example, weeks 3 and 4 | Without AI | With AI |
|---|---|---|
| Reports | 40 | 40 |
| Average working time | 42 minutes | 31 minutes |
| Sent back for fixes | 3 | 8 |
| Time to fix each one | 25 minutes | 25 minutes |
On raw time, AI looks like a big win: 31 minutes against 42, which saves 11 minutes or about 26%. Now add the fixes. Each sent-back report takes about 25 minutes to correct, and the AI side had 8 of them against 3.
Spread that fix time across all 40 reports on each side. Without AI, 3 fixes times 25 minutes is 75 minutes, or about 1.9 extra minutes per report. With AI, 8 fixes times 25 minutes is 200 minutes, or 5 extra minutes per report.
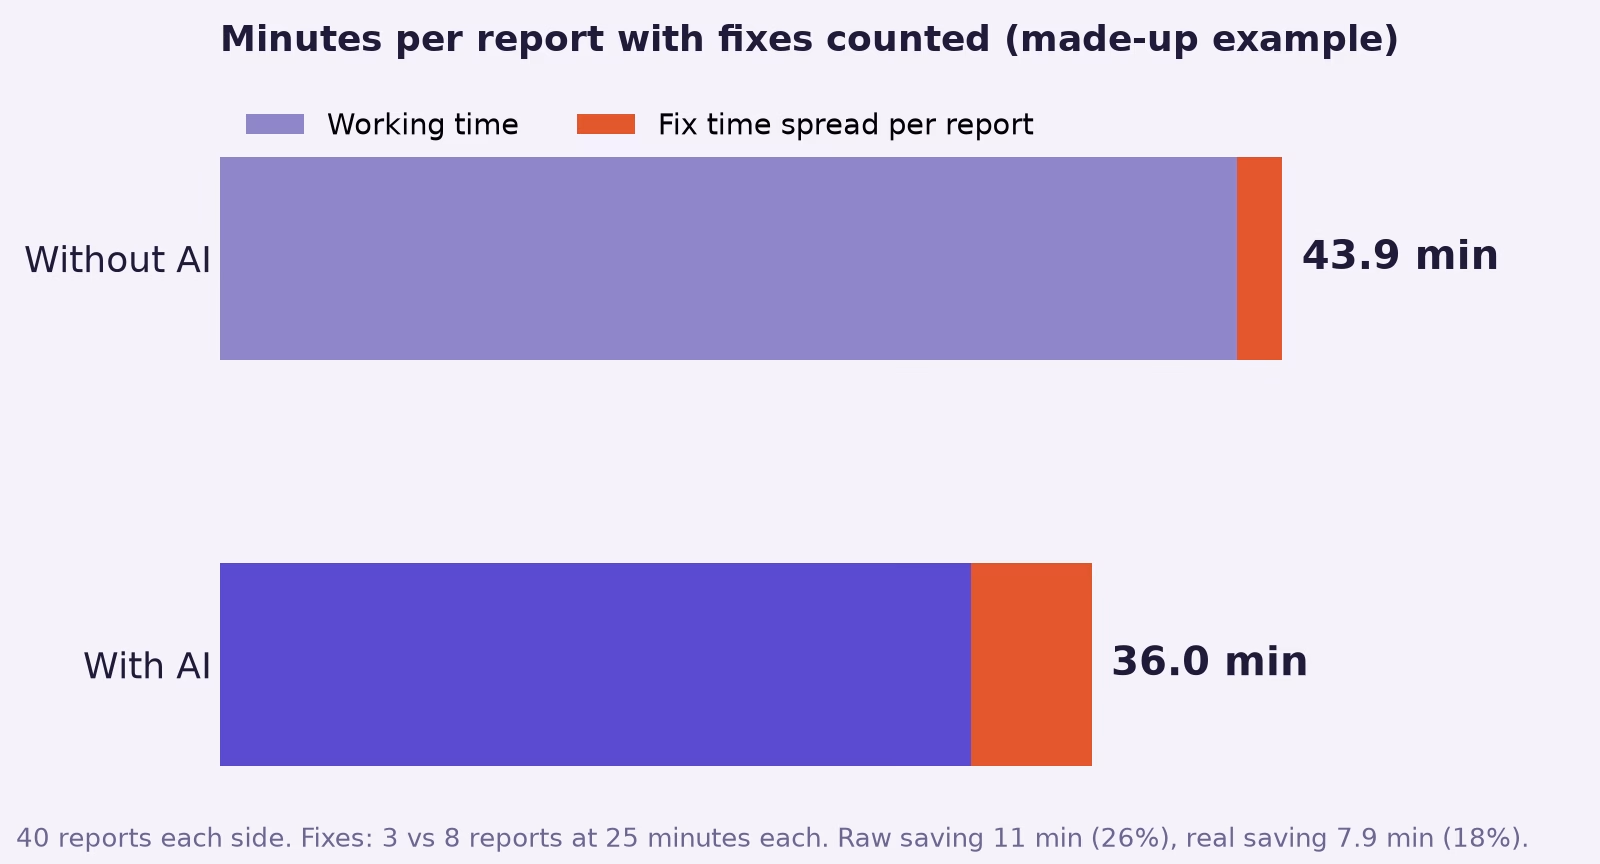
The real saving is 43.9 minus 36, about 7.9 minutes per report, or roughly 18%. That is still a good result, but it is much smaller than the raw number and far smaller than a survey would claim. It also points to the fix: most of the lost time came from AI drafts that went out with errors, so a checklist before sending could win some of it back.
Is the difference real or just luck?
Forty tasks on each side is enough to see a big difference but not a small one. Before you report a saving, check whether it holds in both weeks of the split, not just on average. If the AI side wins clearly in week 3 and week 4, you can trust the direction. If it wins one week and loses the next, keep collecting.
If the two sides end up within a minute or two of each other, call it a tie and say so. A tie is a real answer: it means the tool is not saving time on this task yet, and the renewal should rest on other reasons, like quality or how much people like it.
For a more careful answer, put a range around the difference instead of a single number. The post on uncertainty and confidence intervals explains how in plain English, and the A/B test intuition post covers the same coin-flip logic for website tests.
What if your team does many different kinds of work?
Test one kind of task at a time, because AI helps some tasks and slows others. Averaging them together hides both effects. A team that writes reports, answers client emails, and builds dashboards should pick the one it does most often and test that first.
Choose a task that repeats at least ten times a week and has a clear finish line. “Write the weekly client report” works. “Improve the onboarding process” does not, because nobody can say when it is done or compare one week with the next.
Split the results by experience too, not only by task. In the support study above, new agents gained far more than experienced ones. If your team mixes new hires and veterans, report the saving for each group. A small overall number can hide a big gain for new people and none for the experts, which changes who should get the tool first.
When a test is not worth running
A five-week test costs time, so run it only when the answer changes a decision. If the tool costs less each month than one hour of one person’s time, and people like it, the test may cost more than the answer is worth.
Run the test when the bill is large, when the work goes to clients or regulators and errors are expensive, or when someone wants to plan staffing around the saving. Those are the moments when a survey number can do real damage, because a team budget built on a 25% saving that is really 18% comes up short every month.
Six ways a test can fake a saving
Most bad AI time studies fail in the same few ways. Each one makes AI look better or worse than it is, so check for them before you report anything.
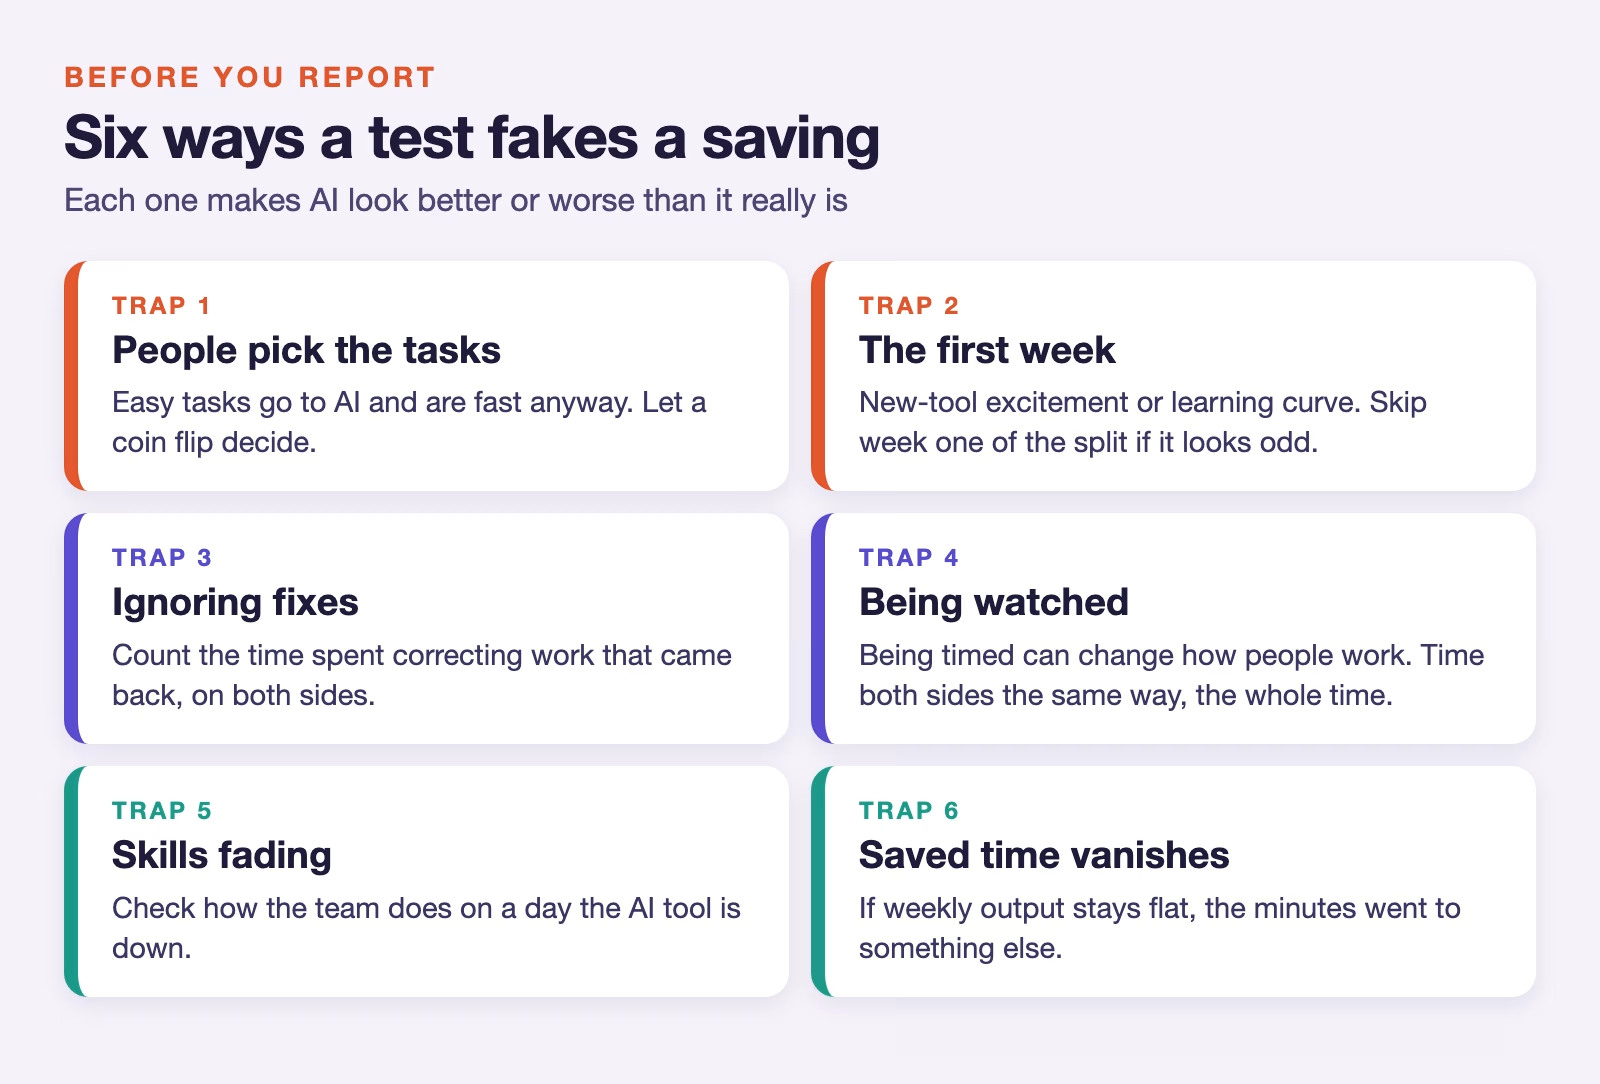
The first two are the most common. If people choose which tasks get AI, they pick the easy ones, so the coin flip is not optional. And the first week with a new tool is often unusually fast or slow, because people are either excited or still learning it.
Skills fading is the newest trap. A University of California, Berkeley study of 1,222 people, reported on October 9, 2026, found that people who had an AI helper for about 10 minutes skipped more hard problems once it was taken away. If your team leans on AI for every report, check how they do on a day the tool is down.
What to tell your manager
Report the real saving after fixes, the number of tasks behind it, and what you would change. One clear sentence beats a slide of survey charts. Here is a fill-in template. Replace each bracket with your own numbers:
- “On [number of tasks] [task type], AI cut time per task from [minutes without AI] to [minutes with AI] once we count fixes.”
- “Without counting fixes it looked like [raw saving], because AI work came back for corrections [more or less] often.”
- “We will add a pre-send checklist and measure again next month.”
That last line matters. A saving is not fixed, because tools, people, and tasks change. Running the same small test every quarter tells you whether the renewal still pays off.
Your next step this week: pick one task your team does at least ten times a week and add three columns to a shared sheet: start time, end time, and “came back for fixes”. Two weeks of that log is your baseline, and you can start the coin flips after it.
Sources
- METR: Measuring the impact of early-2025 AI on experienced open-source developer productivity (July 10, 2025) (16 developers, 246 tasks, random assignment, expected 24% faster, felt 20% faster, measured 19% slower)
- METR: We are changing our developer productivity experiment design (February 24, 2026) (2025 results out of date, newer tools likely faster, sample problems)
- Brynjolfsson, Li and Raymond: Generative AI at Work (NBER working paper 31161) (5,179 support agents, issues resolved per hour, 14% average and 34% for novices)
- UC Berkeley: Using AI for just 10 minutes erodes your ability to persist at hard things (October 9, 2026) (1,222 participants, persistence after the AI was removed)
Keep going
Same lessons in your feed
Short diagrams, hooks, and weekly tutorials on Substack, Instagram, X, and Facebook.