When a number people trust turns out to be wrong, first stop people acting on it, then work out how bad it is. That is a data incident, not a spreadsheet mistake, and handling it means checking the likely causes in order, keeping a written log, and telling the people who use the number what is going on.
Say a vice president posts a screenshot in Slack on a Thursday morning. In this made-up example, yesterday’s revenue on the executive dashboard (a screen of charts that tracks key numbers) is 18% higher than the number Finance reported when it closed the books. Three people have already forwarded the chart. Someone asks whether the board deck should change, and someone asks whether the campaign “worked.” Someone else asks whether the warehouse (the big database your reports read from) is “lying.” You own the area of data that feeds that dashboard tile, so this one is now yours.
In a bad version of this morning, your team spends forty minutes arguing about whose number is right. Nobody checks whether a join (a step that combines two tables) counted refunded orders twice. The screenshot keeps traveling while they argue. A five-line incident card would have slowed the forwards and sped up the diagnosis.
What counts as a data incident
In security teams, an “incident” usually means unauthorized access, malware, or a leak, and that meaning still stands. As the steward of a data area, meaning the person responsible for its quality and rules, you also care about a quieter kind of problem: trusted outputs that are wrong enough to drive a bad decision.
For this series, treat something as a data incident when all three of these are true.
- Material: the number, list, or export is used for decisions, money, customers, or compliance, and is not a throwaway chart in a sandbox.
- Trusted: people already treat it as “the answer,” or it is labeled as the official metric, dashboard, or export.
- Suspect or confirmed wrong: you have evidence of a mismatch, a missing load, a broken definition, a bad join, or something similar, and not only a vague feeling that it “looks high.”
A wrong dashboard number is a data incident. A leaked customer file is also a data incident, and it usually goes to Security and Legal immediately. This post focuses on the wrong-number case because stewards run into it every week and often handle the first hours alone. The same steps apply when the problem involves private data (contain it, log it, communicate, and hand it off), only with earlier escalation.
Rule of thumb: If people are already making decisions on a number, treat a material mismatch as an incident until you prove it is not. Hope is not a severity level.
The first 24 hours: a calm timeline
You do not need a war room and a branded emergency channel for every mismatch. You do need a clock and a sequence. The goal of day one is not a perfect essay about the root cause. It is to stop further harm, establish facts, communicate status, and leave a trail.
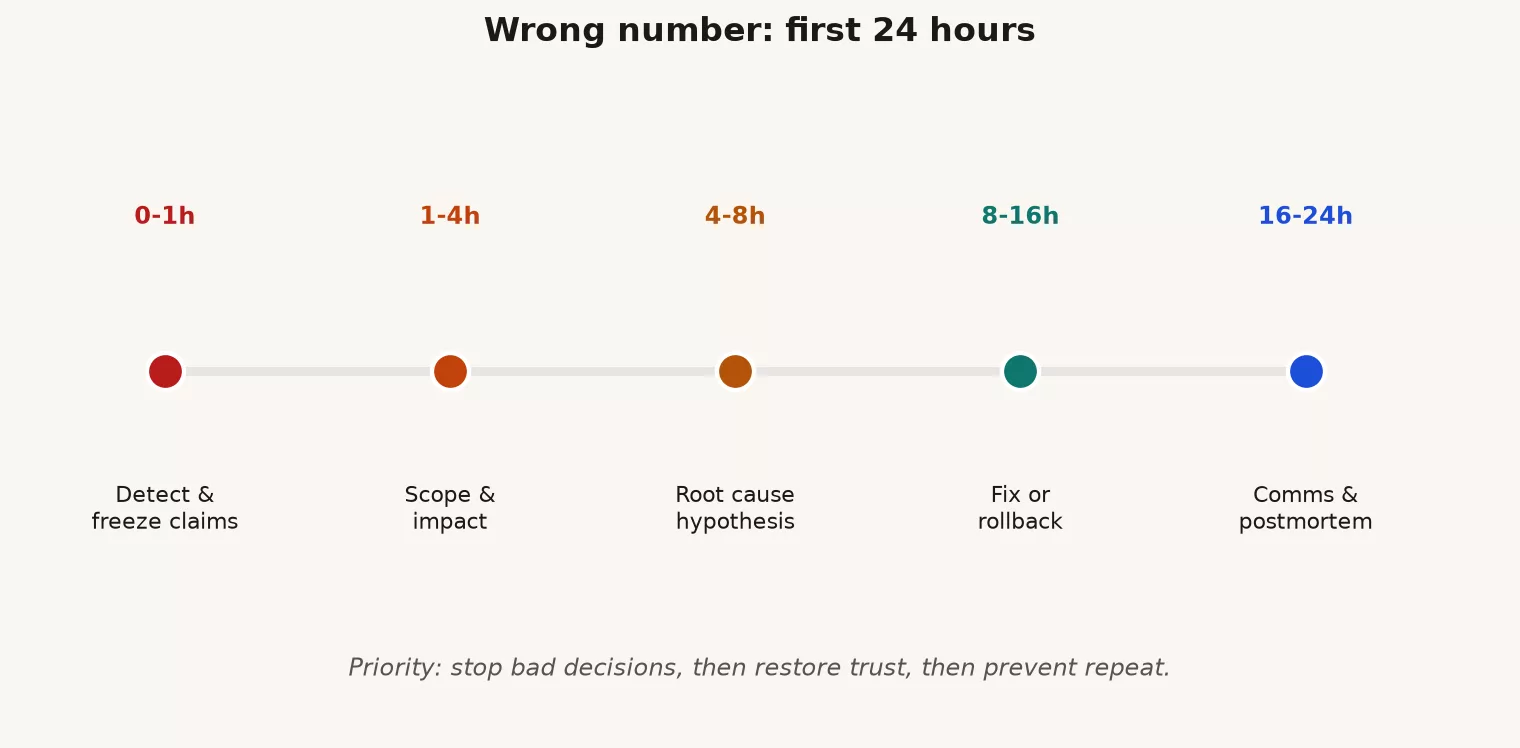
Hour 0 to 1: contain and label
Contain means limiting how many people act on the bad number while you investigate. The options scale with the impact.
- Add a clear banner or note on the dashboard: “Under review. Do not use for decisions until cleared.”
- If you control how the report is published, pause the scheduled refresh or pin the last known-good snapshot with a date stamp.
- Reply in the thread where the screenshot lives: “Acknowledged. Investigating. Do not redistribute until we post an update.”
- If the export is already in someone’s email, you cannot unsend it, but you can send a short correction notice once you know what failed.
Label means giving the incident a short name and an owner. For example, you might call it INC-2026-03-12-rev-dash-v-finance and list yourself, or whoever is on call, as owner. Open a single log in a ticket, a document, or an issue tracker. From this moment on, facts go in the log and not only in chat scrollback, because chat threads are hard to search later.
Hour 1 to 4: triage the severity and pin down the facts
Triage means sorting by how serious the problem is. It answers three questions, not twenty.
- Who is affected? Executives only, one team, outside partners, or customers?
- How bad is it if we wait? Has money moved, is a public statement or payroll run or regulatory report involved, or is this an annoying internal chart?
- How far does the damage spread? Is it one tile, one reporting table, one source system, or the whole warehouse?
Then write a one-sentence problem statement that you can still defend later.
“Today, the Executive Revenue tile for yesterday shows $1.18M while Finance close shows $1.00M for the same calendar day. The difference is about 18%, and the tile is marked under review.”
Notice what is missing from that sentence: blame, guesses about marketing, and “the dashboard tool is broken.” Facts come first, and theories come after the checks.
Hour 4 to 12: run the check board
Wrong numbers almost always come from a short list of causes. Run through them in order, so you do not jump to “redefine the metric” when the overnight load simply never finished. The check board below is the hands-on version of pipeline (the automatic steps that load the data) monitoring from the pipelines series. It looks at freshness (is the data up to date), volume (did the expected number of rows arrive), and structure (did the columns change), then tests, and only then the definition of the metric.
Hour 12 to 24: communicate, fix or escalate, hand off
By the end of day one you should have one of two things. The first is a confirmed cause and a temporary safe path. That might be a corrected number, a banner removed with an explanation, or a note saying “use the Finance source until the reporting table is back.” The second is a clear escalation with an evidence packet for the engineering, platform, or vendor team that owns the fix, plus a status message for the people who use the number.
Digging out the full root cause can continue after 24 hours. Trust in the number does not wait for a perfect postmortem, which is the written review teams do after an incident is over.
Severity without theater
Use three levels so people share a language. Adjust the names to match your company if Security already uses numbered severity levels. The point is shared meaning, not showy jargon.
| Level | When | Contain | Who to pull in | Cadence first day |
|---|---|---|---|---|
| Red | Money, customer, legal, or external reporting impact; widespread trust already damaged | Banner + pause publish if you can; notify consumers now | Steward, pipeline owner, metric owner, manager; Security/Legal if PII or breach risk | Update every 1 to 2 hours until stable |
| Yellow | Material internal decision risk; mismatch confirmed or highly likely | Banner or note; freeze redistribution | Steward + data producer for that path | Update at lunch and end of day |
| Green (watch) | Hypothesis only; sandbox; non-decision chart; small drift inside known tolerance | Optional note; no panic channel | Steward only unless it escalates | One written update if you opened a log |
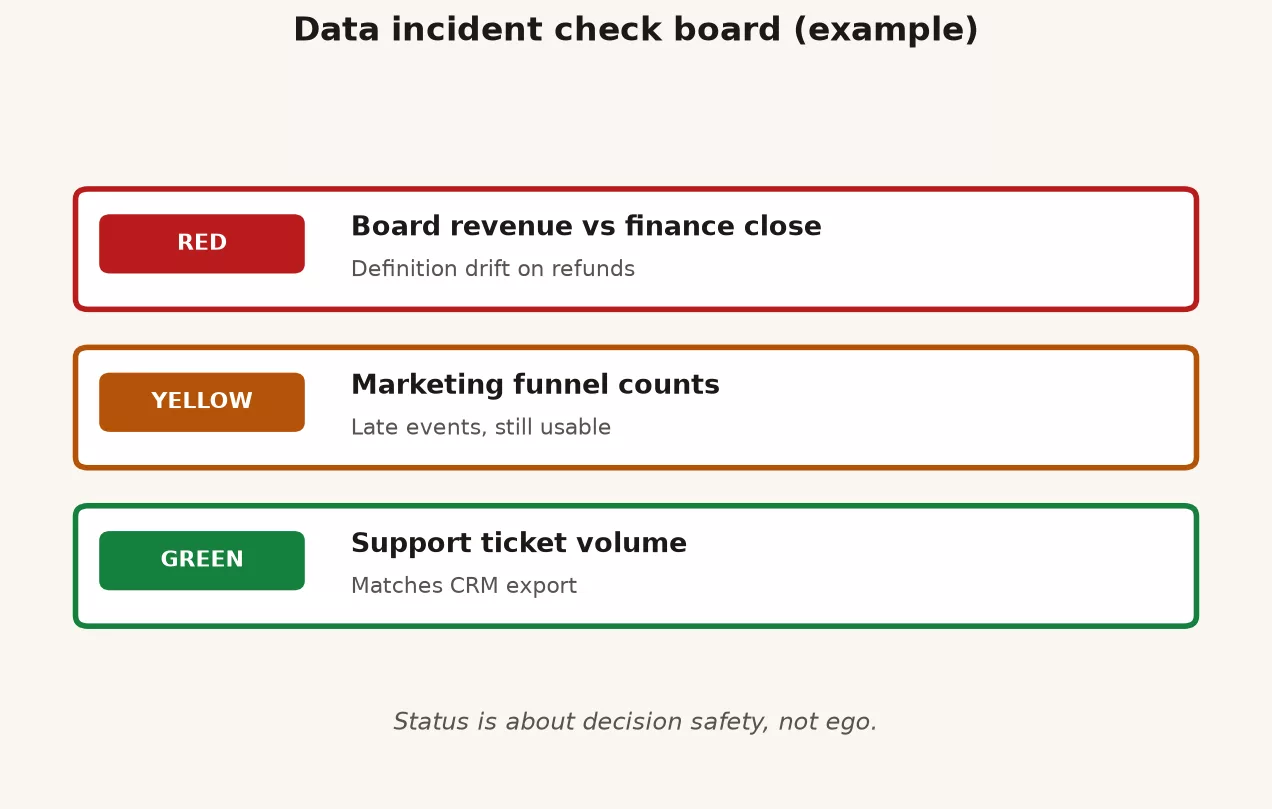
If you are unsure between yellow and red, ask yourself whether you would be comfortable if this number reached an outside partner’s inbox tonight. If the answer is no, treat it as red until proven otherwise.
The wrong-number check board
Work from the top row to the bottom. Stop when you have a confirmed cause strong enough to act on. Come back to the lower rows only if the first fix does not close the gap.
| Row | Check | How you test it | If it fails, the likely action |
|---|---|---|---|
| 1 | Freshness | Latest event or load time compared with the promised deadline (SLA); job end time compared with the “data through” date | Delay consumers; fix the extract or the scheduler |
| 2 | Volume | New rows compared with the normal range for that weekday; empty load; double load | Inspect files, filters, and late duplicates |
| 3 | Schema and types | Columns present; types; whether blanks are allowed, compared with the agreed contract | Halt the promotion to production; fix the model or push the source owner to fix theirs |
| 4 | Keys and joins | Duplicate keys; rows multiplied by a join; orphan foreign keys | Fix what one row represents or fix the join; recompute the reporting table |
| 5 | Filters and time zones | Status filters; fiscal versus calendar; UTC versus local time | Align the windows; write down the time zone rule |
| 6 | Metric definition | Spec compared with the query; gross versus net; are refunds included? | Use the documented definition; update the tile or the Finance mapping |
| 7 | Conflict between official sources | Two official systems disagree by design | Declare which system owns which decision (a topic for the post on ownership) |
Rows 1 to 4 belong to pipelines and data quality. Rows 5 to 7 belong to metrics and stewardship. Do not rewrite the metric on row 6 until rows 1 to 5 are clear or explained, because that habit alone prevents endless arguments about definitions during every scare.
Incident log template (copy this)
Keep one log per incident. Short fields beat a novel. You can paste this into a ticket description or a shared document.
# Data incident log

id: INC-YYYY-MM-DD-short-name
opened_at_local: 2026-03-12 09:14
opened_by: your.name
severity: yellow   # red | yellow | green-watch
status: investigating   # investigating | contained | resolved | false-alarm

## Problem (one sentence)
# As of ..., system A shows X while system B shows Y for ...

## Consumers / blast radius
# e.g. Exec revenue tile, weekly sales email, partner portal export

## Containment actions (with times)
# 09:20 banner on tile
# 09:25 reply in #exec-metrics: under review

## Timeline (facts only)
# 09:14 VP screenshot in Slack
# 09:18 steward confirmed 18% gap for calendar day yesterday
# 10:05 freshness check: max order_ts is T-2 (expected T-1 by 07:00)

## Checks run (link queries or paste results)
# freshness: FAIL
# volume: PASS for T-2; FAIL for T-1 (0 new rows)
# schema: PASS
# keys: not run yet
# metric def: not run yet

## Current hypothesis
# Overnight orders extract failed after 02:00; mart still shows prior day labeled as "yesterday"

## Decision for consumers (until next update)
# Do not use Exec tile. Use Finance close export for decisions.

## Next update by
# 2026-03-12 15:00 local

## Owners
# steward: your.name
# pipeline: data-platform on-call
# metric owner: finance.ops

## Close notes (fill when resolved)
# root cause:
# fix:
# prevention:
# who was notified of resolution:
The log is not for show. It keeps three people from “fixing” three different theories at once, and it lets you write a useful close note without digging through old Slack messages.
Worked example: Finance close versus the executive tile
Here is the setup, using toy numbers that are labeled as an example.
| Source | Definition (claimed) | Yesterday amount |
|---|---|---|
| Finance close export | Recognized revenue, calendar day, company TZ, refunds netted | $1,000,000 |
| Exec dashboard tile | Labeled “Revenue (yesterday)” | $1,180,000 |
In the first hour, you put a banner on the tile, post in the thread, and open the incident log, INC-2026-03-12-rev-dash-v-finance. You mark it yellow, because executive decisions are at risk but nothing external has been filed yet.
In hours 1 to 4, you pin down the problem statement, which is a gap of about 18% for the calendar day before. You do not yet say “marketing double counted.” Instead you run the check board with a few short queries against the warehouse. A query is a written question you send to a database.
-- Freshness: latest order event in the mart used by the tile
SELECT
  MAX(order_ts) AS max_order_ts,
  MAX(loaded_at) AS max_loaded_at,
  COUNT(*) AS row_count_yest
FROM analytics.fct_orders_daily
WHERE order_date = CURRENT_DATE - INTERVAL '1' DAY;

-- Expected by 07:00 local: max_order_ts through end of yesterday
-- Example result: max_order_ts is two days ago; row_count_yest = 0

-- Volume band: compare to same weekday last 4 weeks
SELECT
  order_date,
  COUNT(*) AS orders,
  SUM(net_amount) AS net_revenue
FROM analytics.fct_orders_daily
WHERE order_date >= CURRENT_DATE - INTERVAL '35' DAY
GROUP BY 1
ORDER BY 1;
In this example, the reporting table has zero rows for “yesterday,” but the tile still shows $1.18M. That is a second warning sign. You dig into the dashboard tool’s definition and find that the tile was set to show the “last non-empty day” after an old outage. It quietly redisplayed the prior day under the label “yesterday.”
The chain of causes looks like this.
- The overnight extract failed, so the pipeline row is red.
- The reporting table stayed empty for the calendar day, so freshness and volume are red.
- The dashboard fallback reused the prior day without relabeling it, so the presentation row is red.
- Finance close was correct for the calendar day before, which makes it the trusted source for close decisions.
For the rest of the day, tell people to use the Finance close number. The fix is to restore the extract, recompute the reporting table, and either remove the “last non-empty day” fallback or label it clearly as “latest available day” with the date filled in. To prevent a repeat, make a failed freshness test block the tile from publishing, and do not rely only on the job showing green. That last point is pure stewardship, because you care about the number people actually see and not only about the status light on the scheduler.
How to communicate without feeding the rumor mill
Under pressure, people fill silence with stories. You do not need a press release. You need short updates that arrive when you said they would.
First reply (minutes)
“Acknowledged the mismatch between [A] and [B] for [period], and we are investigating. Please do not redistribute the chart, because our next update will come by [time] from [name].”
Midday update
“We are still investigating. So far we know [fact] and have ruled out [fact], and until further notice the safe source for decisions is [system]. The next update comes by [time].”
Resolution or handoff
“The root cause in summary was [one or two sentences], and it affected [dates and times]. We fixed it by [what changed], and we will prevent a repeat with [check or process]. The tile is now cleared or still blocked, and the full log is at [link].”
Do not name and shame anyone in the public channel. Do not promise “never again.” Do not invent precision, such as “exactly 17.84% caused by…,” when you only know the class of failure.
When this is also a security or privacy incident
Escalate early if any of these appear. Examples are unauthorized access, personal data sent to the wrong party, passwords visible in a screenshot, a vendor asking for a full copy of the production data “to debug,” or a request to hide the issue from Legal. Wrong numbers and breaches can overlap. For example, a broken filter might expose another customer’s rows. In that case, containment includes reviewing who has access, and not only putting a banner on a dashboard. A later post in this series covers working calmly with Legal and Security. An earlier one covered giving people only the access they need, so that fewer people can cause damage like this in the first place.
Common mistakes
| Mistake | Why it hurts | Better habit |
|---|---|---|
| Silent investigation for half a day | Rumors and decisions continue on the bad number | Contain and announce within the first hour |
| Jumping to “redefine the metric” | Hides pipeline failures under policy debate | Check board rows 1 to 5 before row 6 |
| Fixing in prod with no log | Nobody can learn; issue returns next month | One incident id, written close notes |
| Blaming a person in Slack | People hide the next incident | Facts, systems, and process fixes |
| Declaring “all green” when only the job is green | Tile still wrong for consumers | Clear the decision surface, not only the scheduler |
| Scope creep mid-incident | You rebuild the warehouse during a fire | Stabilize first; schedule follow-up work |
Quick recap
- A wrong trusted number is a data incident for stewards, even when it is not a security breach.
- In the first 24 hours, contain it, log it, triage it, run the check board, communicate on a clock, and hand off with evidence.
- Severity depends on decision harm and how far the damage spreads, not on how loud Slack is.
- Check what happened in the pipeline before you rewrite any definitions, because changing a definition can hide a pipeline failure instead of fixing it.
- Fix the number people see, because a green job alone does not mean the problem is resolved.
The next post in this series covers how long to keep data and when to delete it. It takes on the tempting phrase “we might need it someday.” For program-level context, the key terms on data governance and master data management stay linked here. Pipelines still matter too, so revisit how data actually moves when you need to check the source of a failure.
How to practice this week
- Pick your top three decision dashboards. For each one, write down the safe alternate source, even if it is only a finance export or a report from the CRM (customer relationship management system, where sales keeps customer records).
- Create a blank incident log template in your team wiki. Fill one in for a past scare as a dry run, with no public drama required.
- For one critical reporting table, write the freshness and volume checks you would run in hour 4. If they do not exist yet, file them as work items with the pipeline owner.
- Agree with your manager on what separates yellow from red, in one short paragraph. Vague criteria are expensive during incidents.
- Skim your quality checks and metric definitions so that row 6 of the board is not a scavenger hunt. Useful links: data quality checks and metric definitions.
Series notes
This is Part 4 of Data stewardship at work. Previous: access. Next: retention.
Sources
Research and further reading used for this article:
- National Institute of Standards and Technology (NIST): Cybersecurity Framework (incident response and risk communication habits that transfer to operational data incidents)
- Cybersecurity and Infrastructure Security Agency (CISA): Incident Response Plan Basics (contain, eradicate, and recover sequencing, adapted here to wrong-number operations)
- NIST Special Publication 800-61 Revision 2: Computer Security Incident Handling Guide (classic handling phases; a useful structure even when the “asset” is a trusted metric)
- NIST Privacy Framework (when wrong data and privacy risk overlap, use privacy risk language early)
- Analytics Made Simple: How data actually moves (freshness, volume, schema, tests)
- Analytics Made Simple: Data quality (checks you should already have before the fire)
- Analytics Made Simple: Data governance (the program layer this series practices against)
Keep going
Same lessons in your feed
Short diagrams, hooks, and weekly tutorials on Substack, Instagram, X, and Facebook.