

Publishing a report in Power BI, Microsoft’s reporting tool (BI stands for business intelligence), does not mean people will trust it. Trust comes from a few plain habits: one official place to find the report, a named owner, numbers that refresh on a schedule, and clear limits on who sees what. Say you publish a report on Friday. By Monday three people have forwarded different links, one person has changed a calculation in a personal copy, and your finance team is still using last month’s PDF because the live one feels risky. This post walks through those habits and ends with a launch checklist you can actually run.
Shared is not the same as trusted
People treat a Power BI link as the source of truth the moment it appears in a chat channel. That is flattering, and it is also dangerous. Trust needs five things.
- A known owner who can change definitions and answer the question “why did this number move?”.
- A known refresh schedule so timestamps mean something.
- A known audience so sensitive rows do not leak out through curiosity.
- A known home so people stop making their own personal copies.
- A known definition for each metric on the landing page.
If any of those are missing, the report can still be useful in private. It should not become the company’s default link yet.
Rule of thumb: Do not put a report in the official app until you can name the owner, the refresh schedule, the sensitivity level and the one metric people will argue about first.
Workspaces, apps, and who can do what
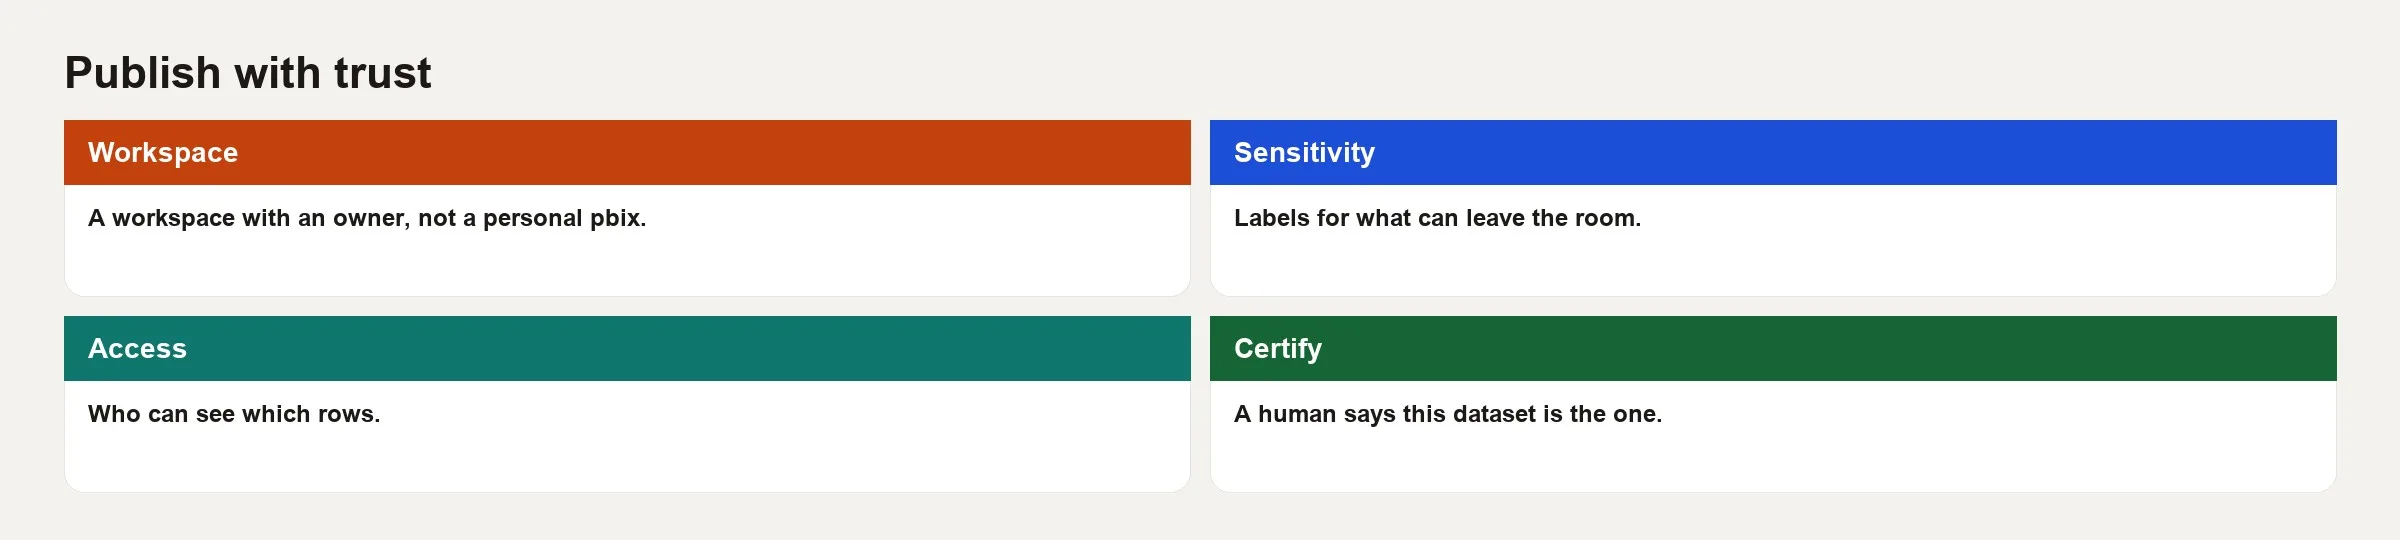
A workspace is a shared container for datasets, reports, dashboards and more. Roles usually include Admin, Member, Contributor and Viewer. Microsoft changes the exact names and rights over time, so check your organization’s current table on Microsoft’s help pages. In practice the roles work like this.
- Viewers read reports. They should not be your entire plan for who can do what, but they are the default for broad audiences when you use an app.
- Contributors and Members build and publish content, so keep this group small in official workspaces.
- Admins handle access and settings, and they clean up when someone leaves the company.
A Power BI app is a packaged version of a workspace that you hand to a broader audience. An app gives readers stable navigation while the builders keep working in the workspace behind it. Many teams share the workspace itself too widely and then wonder why experimental pages start to look official. A better setup puts builders in the workspace and readers in the app, when your license and process support apps.
Also keep the dataset, which is the data model behind the report, separate from the report itself. Several reports can sit on one certified dataset. That works well when the measures live in one place, and it becomes painful when every report carries its own private copy of conflicting logic. Aim for one owned model for each business area, with as many thin reports on top as you need.
Before you click Publish
Run this short preflight in Power BI Desktop before you publish, because problems caught before publishing never reach your readers.
- In the model view, the relationships between tables look deliberate, with no surprise many-to-many links.
- Every measure has a clear name and a number format, and a text box explains what each one means.
- Hidden keys and junk columns are removed from the report view.
- The landing page answers one main question in under ten seconds.
- An “About this report” page lists the owner, what one row means, when the data refreshes and the known limits.
- Sensitivity labels are applied if your company uses them, following your information security policy.
- The file name and report name match the words people will search for six months from now.
Publish to the correct workspace on purpose. Publishing to “My workspace” trains you to email PBIX files (the Power BI file format) later on. Personal workspaces are for experiments, and official metrics belong somewhere else.
Refresh: the quiet trust killer
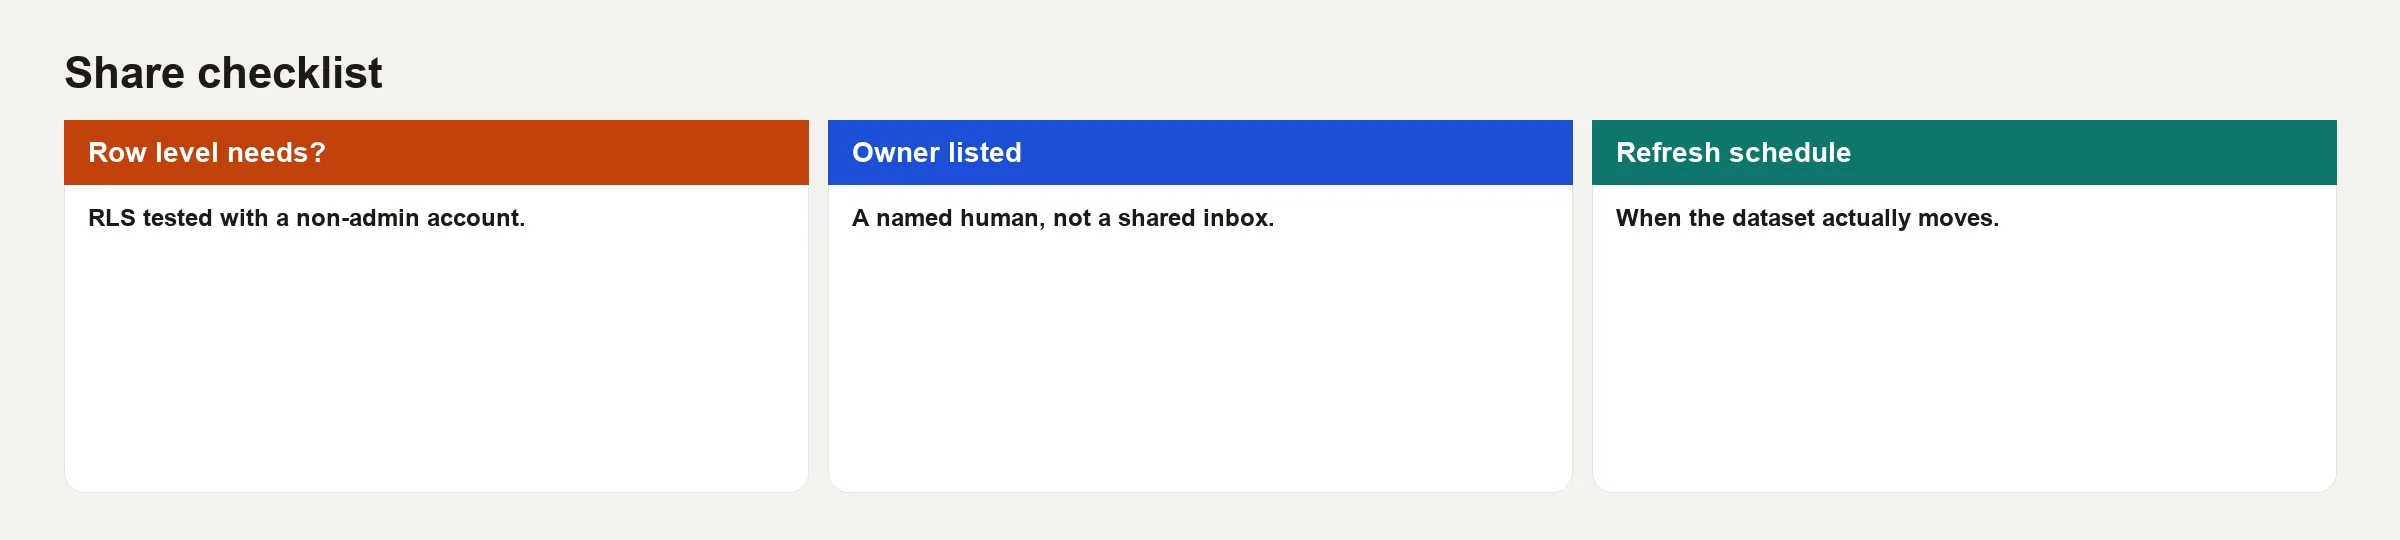
Import models copy data into Power BI, so they need a scheduled refresh. They may also need an on-premises data gateway, which is a small program that lets Power BI reach data sources inside your company network. Trust dies when a banner says the data is from last Tuesday during a Monday operations meeting and nobody owns the failure.
Set expectations in the UI
Show the last refresh time on the landing page, using a card or text that comes from a measure or from dataset details your organization supports. If you cannot automate it, write the schedule in plain language, such as “Refreshes every weekday morning.” People can plan around honesty, but they cannot plan around silence.
Failure alerts and ownership
Send refresh failure notifications to a real mailbox or channel that a person reads, because a shared inbox that nobody checks does nothing. Write down who restarts a failed refresh, who fixes the credentials and who tells stakeholders when numbers will be late. This is careful ownership, and it is not glamorous work.
Credentials and gateways
The login details for the data sources should not live only in one analyst’s head. When that person is on leave, the dataset goes stale and the company goes back to passing Excel files around. Keep a short runbook next to the workspace description that lists the source systems, the gateway name and who can change the passwords.
Row-level security when “everyone” is not everyone
Row-level security (RLS) filters the rows a person can see based on who they are or which role they hold. Use it when one report should show different slices to different people, such as regional managers or account owners, without you shipping twenty copies of the file.
The basic pattern has four steps.
- Define roles in Desktop, for example
RegionManager. - Write a filter on a lookup table, such as
dim_customer[region] = USERPRINCIPALNAME()matched through a permissions table, or use a simpler fixed filter for a pilot. - Publish the report, then assign users or groups to the roles in the Power BI service.
- Test as a role before you celebrate.
RLS does not replace a legal or compliance review when the data is highly sensitive, and it does not switch itself on. People with high workspace rights may still see more than readers do. Know who can bypass RLS and keep that group tiny.
A worked example: the launch checklist for Sales Performance v1
Say you have finished the star-shaped data model and the measures from the earlier posts in this series. Your stakeholders now want a shared “Sales Performance” view for the East and West managers, plus a rollup for leadership.
Decisions to write down
| Decision | Example answer |
|---|---|
| Workspace | Finance Analytics - Official |
| Dataset name | Sales Starter Model |
| Report name | Sales Performance v1 |
| Owner | The analytics lead, with a named backup analyst |
| Refresh | Weekday mornings through the gateway HQ-GW-01 |
| Audience | App for Sales Leadership; RLS for regional managers |
| Primary metric | Net Revenue (excludes tax; see About page) |
| Known limit | No returns module yet; do not use for net-of-return P&L |
Launch sequence
- Publish the Desktop file to the official workspace and not to My workspace.
- Set up the dataset credentials and the gateway if needed, then run one manual refresh, so you see a refresh succeed before you rely on the schedule.
- Check the three sanity measures against a known extract or a warehouse query, so you catch a broken refresh before your readers do (a written request for data).
- Assign the RLS roles and use “Test as role” for sample East and West users.
- Add a workspace description, and copy the About page content into the team wiki, so people can find what a report is for without asking you.
- Create or update the app navigation with Landing, Trends, Customers and About pages, so people land on the summary first.
- Share the app link in the announcement, and not a stray report URL, so everyone lands on the same organized version.
- Schedule a 20-minute open help session for the first week and collect any definition problems.
Announcement template you can steal
Sales Performance v1 is live in the Sales Leadership app.

Use for: net revenue and orders by region and category.
Do not use for: returns-adjusted P&L (not in model yet).
Refreshes: every weekday morning. If stale, ping #analytics-ops.
Owner: the analytics lead (backup: a named analyst).
Feedback: one thread this week, then we batch changes on Tuesdays.
That message does more for trust than another color fade on the title page ever will.
Certification, endorsement and “official” labels
Many organizations can endorse or certify datasets in Power BI. Use those labels only when a real process stands behind them, which means someone reviewed the measures, an owner is documented and the refresh is monitored. A certified badge on a weekend experiment teaches people to ignore badges. If your company has no formal process yet, start with clear names, such as an Official workspace versus a Sandbox, and with announcements from a real person before you lean on badges.
Versioning without chaos
Power BI does not keep a version history the way git does, although deployment pipelines (a Power BI feature for moving reports from a test workspace to the one people use) exist for more mature setups. Here is a simple starting discipline.
- Keep the PBIX file in a known library such as SharePoint or Teams, or use deployment pipelines when you have them, so there is one copy everyone edits and a history you can roll back to.
- Update a visible version number on the About page whenever measures change.
- Prefer changes that only add things during the first month, and announce any definition change that breaks old numbers.
- Retire old app pages instead of leaving three “final” reports alive.
When someone asks for a one-off field, resist copying the entire model into a personal version. Either add the field properly or give them an export with an expiration date.
Common mistakes
- Publishing to My workspace and emailing links. This creates unofficial shadow IT inside the reporting tool.
- No refresh owner. Stale data behind a modern screen is still stale data.
- A workspace open to the whole company as Members. Experiments turn into production by accident.
- RLS untested. Saying “we added roles” is not the same as proving that East cannot see West.
- Silent metric changes. Net Revenue changes its definition on Tuesday without a note.
- Ten report URLs and no app. People bookmark the wrong page and keep using it forever.
- No stated limits. Users invent uses the model cannot support, and then blame the analytics team.
Series wrap
The Power BI starter comes down to three moves. Build the model before the visuals, write measures that match the question, and publish with the machinery that earns trust. The tool rewards speed, while organizations reward boring reliability. If you keep only one habit from the series, keep the sanity page and the About page, because they prevent more pain than any new custom visual.
Quick recap
- Trust needs an owner, a refresh schedule, an audience, a home and a definition, and a share link alone is not enough.
- Builders work in workspaces, and readers should preferably use apps with stable navigation.
- Refresh failures need people and runbooks, and hope is not a plan.
- RLS must be tested as each role, because high-privilege builders may bypass it.
- Announce limits and version changes, and retire old links on purpose.
How to practice this week
- Day 1: List every Power BI link your team uses and mark each as sandbox, personal or official, honestly.
- Day 2: Write an About page for one report that lacks one, including the owner, the refresh schedule, what one row means and the limits.
- Day 3: Confirm the scheduled refresh and the failure alerts for that dataset, and fix the notes on credentials.
- Day 4: If RLS applies, test as two roles and take screenshots of the different totals.
- Day 5: Draft the announcement template for your next publish, and remove one obsolete report link from the team channel topic.
Series notes
This is Part 3 of Power BI starter, and it closes the series. The previous post covered measures that match the question.
Sources
- Microsoft Learn: Workspaces in Power BI.
- Microsoft Learn: Apps in Power BI.
- Microsoft Learn: Configure scheduled refresh.
- Microsoft Learn: Row-level security (RLS) with Power BI.
- Microsoft Learn: Endorse your content.
Keep going
Same lessons in your feed
Short diagrams, hooks, and weekly tutorials on Substack, Instagram, X, and Facebook.



