When someone says a dashboard must be “real time,” they usually mean they are tired of answering questions with yesterday’s export. What they sometimes get instead is a streaming project that takes months, adds three new ways to fail, and still refreshes every fifteen minutes. Real time is a delay you agree to in advance, which people call a latency budget, and it is not a status symbol.
Say four teams ask you for “live” numbers in the same week. Support needs figures fresh to within five minutes, while finance needs a correct daily close. Marketing needs campaign counts by lunchtime, and your executives want a morning snapshot. Someone proposes one streaming platform (a system that moves each record the moment it happens) for all four, yet three of them only need a nightly or hourly refresh. How fresh the data must be is a requirement you agree on, not a badge of honor.
Two ways data can travel (and a third that many people pretend is temporary)
Forget product names for a minute and think about mail. There are three ways to move it, and each one matches a way data moves between systems.
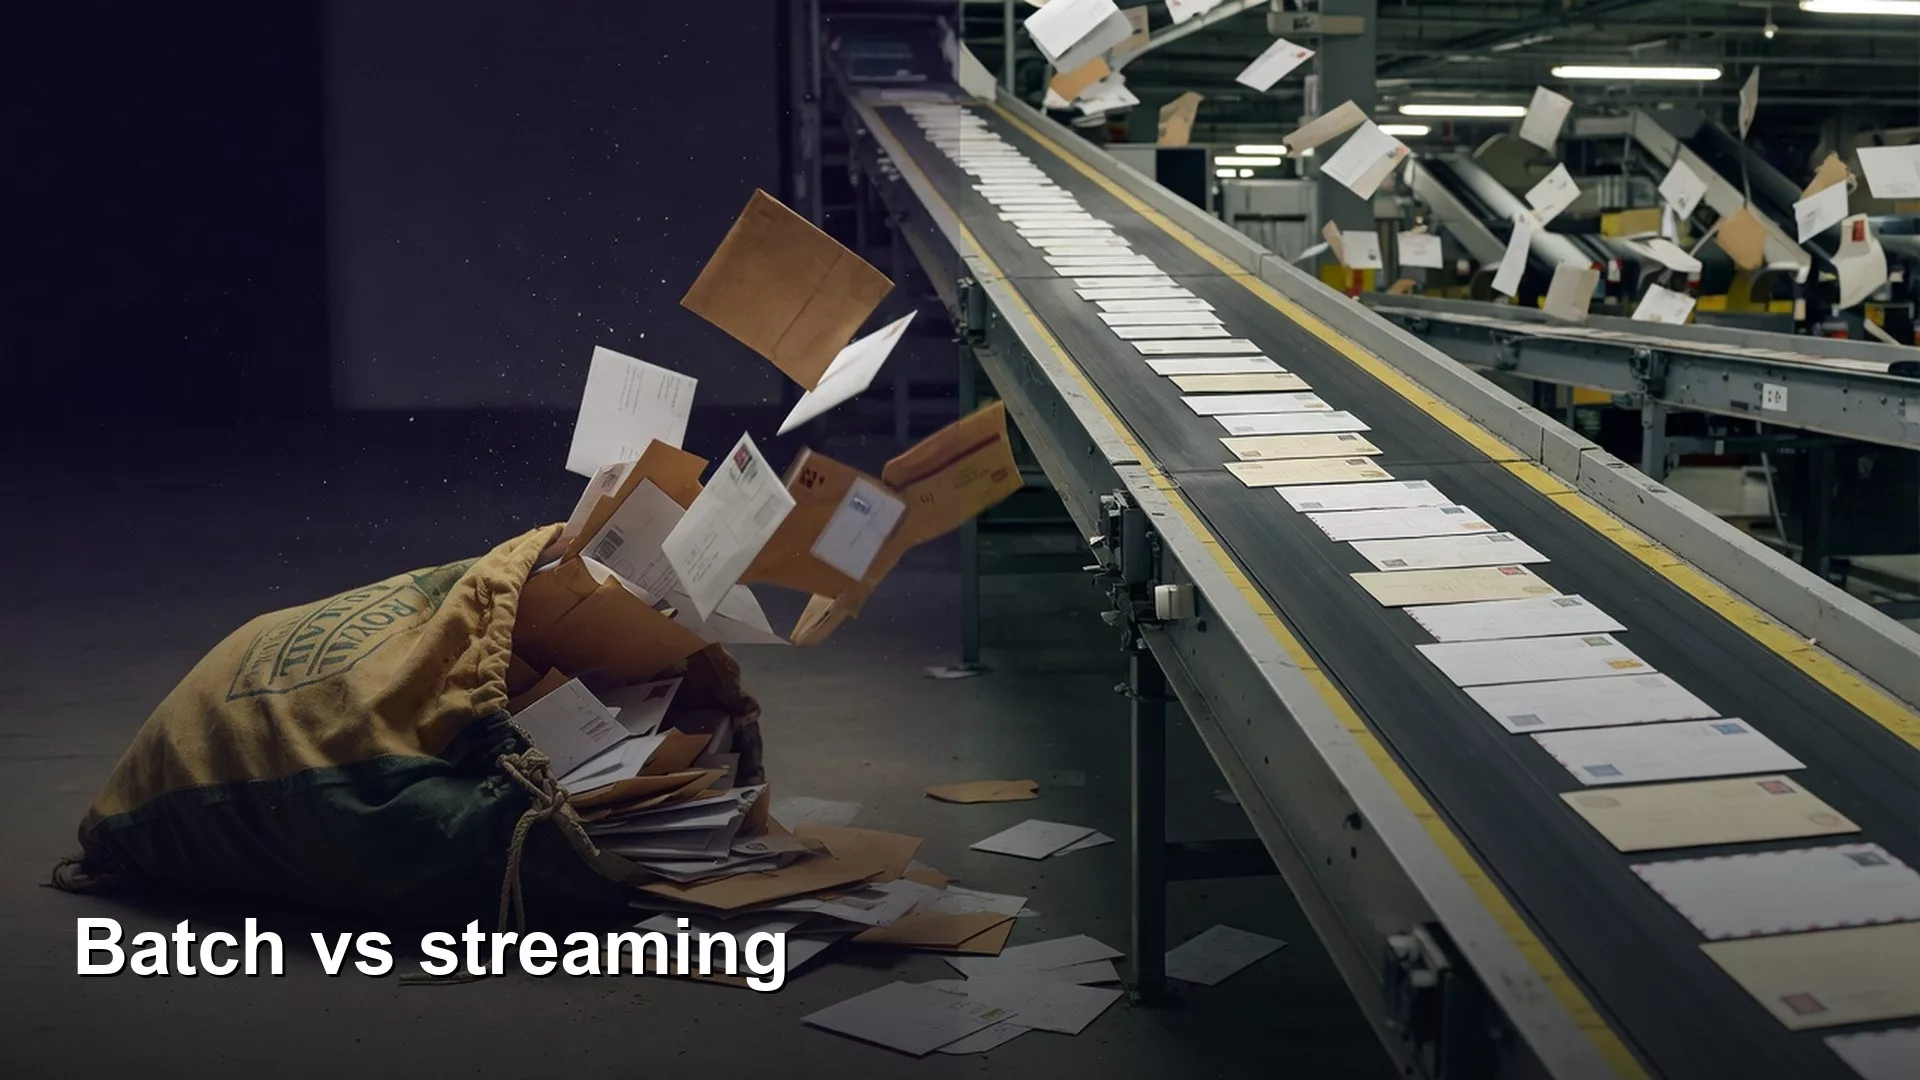
- Batch is the mail truck. Letters pile up, and at a scheduled time the truck leaves with a full bag. That is efficient, but it is not instant.
- Streaming is the courier who runs each letter over as soon as it is written. You get faster feedback, but you also need more coordination, and one slow stop can hold everything up.
- Micro-batch is a truck that leaves every few minutes. It is batch on a short schedule, and many slides that say “streaming” in real companies are really micro-batch wearing a hoodie.
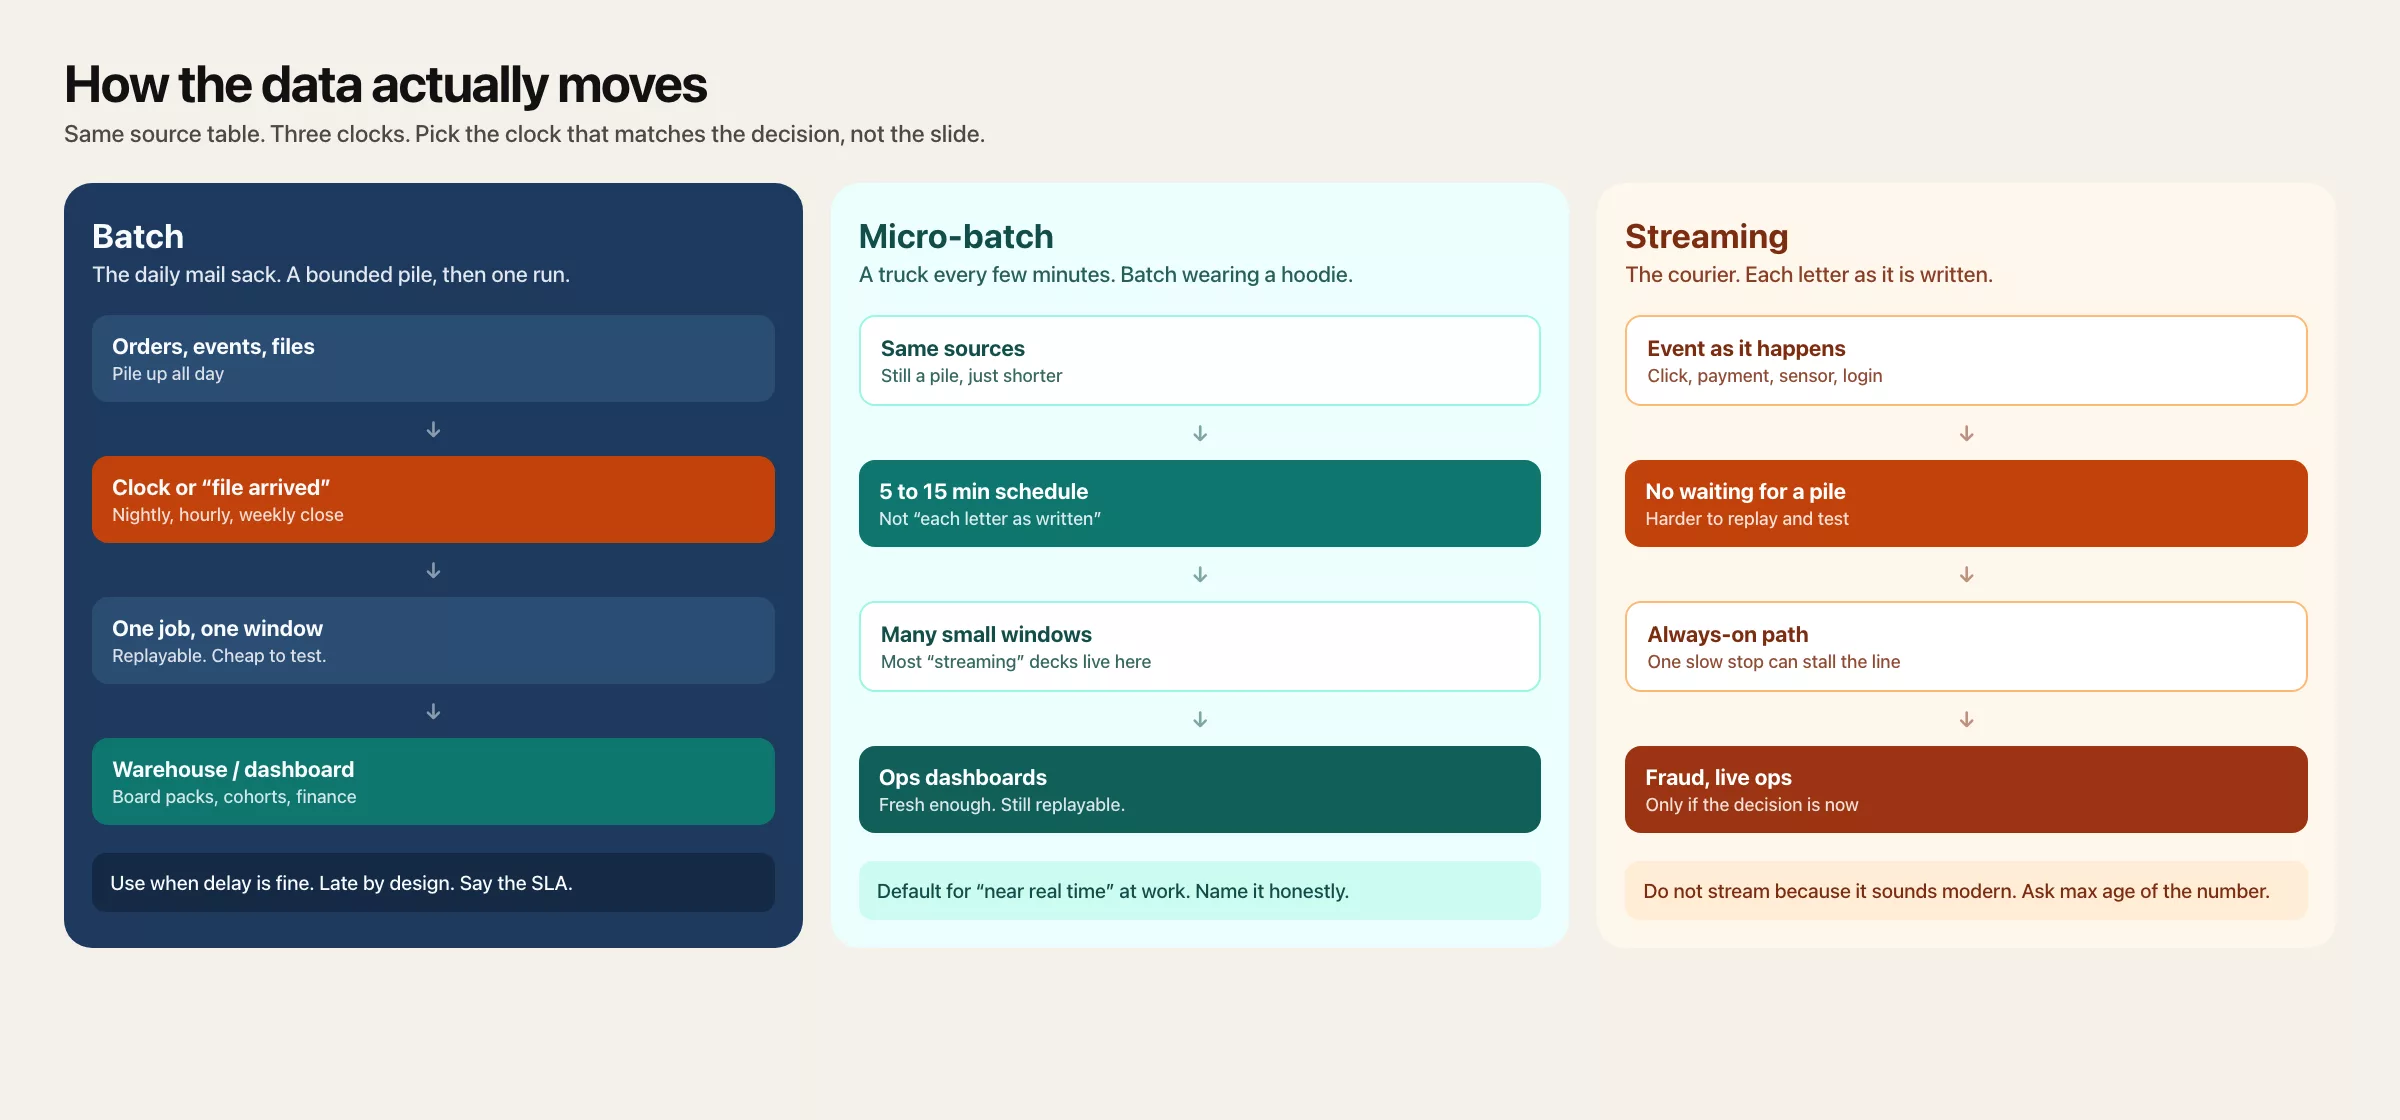
The earlier post in this series described a four-stage path for data: sources, land, transform, and serve. Batch versus streaming is mostly about how often data from the sources arrives in your storage (the land stage), and sometimes about how the cleanup steps run after that. The serve stage, meaning dashboards and exports, can refresh on its own schedule even when data lands continuously. That mismatch is why a “streaming” data flow can still feed a dashboard that updates every fifteen minutes, even though the data itself flows in continuously. The network was fast, but the product was never designed to be continuous.
Rule of thumb: Ask for the maximum acceptable age of the number at the moment someone decides. If nobody can answer in minutes, hours, or days, you do not have a streaming requirement. You have a vibe.
Batch in plain English
Batch processing collects a window of data and then processes that window as one unit. Classic examples are a nightly warehouse load, an hourly rollup of events, a weekly finance extract, and a monthly close file. Two things define it: a schedule (or a trigger such as “the file arrived”) and a fixed set of records for each run.
Batch still dominates analytics for four reasons:
- Business clocks are batchy. Board packs, payroll, inventory counts, and cohort analyses often need complete days or periods, not the last second.
- Reprocessing is easier to reason about. “Rerun March 12” is a clear operation, while “rerun the stream from a saved position while other systems are still reading it” is a specialty skill.
- Cost and complexity stay lower for many data volumes, because you pay for a job window instead of always-on processing of every event.
- Quality checks fit naturally. Row counts, uniqueness, and comparisons against the source totals are straightforward once a load finishes.
Batch is not old-fashioned. It is still how most decision-ready numbers are made. If your metric needs a full day of refunds before it is honest, then streaming the partial day into a board tile is not sophistication. It is a faster wrong answer.
What “late” means in batch
Meetings mix up two different ideas of lateness in batch:
- Schedule lag: the job is designed to finish by early morning with yesterday’s data, so that gap is intentional.
- Failure lag: the job should have finished by early morning and is still running at midday, so that gap is an incident.
Analysts often feel both as “the data is late,” so your ticket should say which one you mean. Schedule lag is a product choice that you can challenge with a latency budget. Failure lag is an operations problem for whoever owns the loading or cleanup step.
Streaming in plain English
Streaming processes events continuously, or close to it, as they arrive. Think of payment authorizations, clicks on a website, sensor readings, fraud scores, and inventory reservations. The system does not wait for the end of the day to start work. It keeps a running state, such as counts, time windows, lookups against slowly changing reference tables, and alerts.
Streaming earns its complexity when the decision cannot wait for the next batch and acting on fresher data changes an outcome. Fraud blocks, live inventory, alerts about outages, and personalization inside a product sometimes clear that bar. “I want the KPI (key performance indicator, a number tracked to judge progress) tile to feel modern” usually does not.
Streaming also changes how things fail. Instead of one big job failing, you get readers that fall behind, bad events that jam the line, records that arrive out of order, and the endless debate about whether each event is delivered “exactly once.” You do not need to master those terms on day one. You do need to accept that a continuous system needs continuous ownership, because a nightly batch with one on-call rotation is a very different staffing model from an event path that runs around the clock.
Event time versus processing time
This is the trap that catches analysts who first meet streams. There are two clocks:
- Event time is when the thing happened in the world, such as when a user clicked or a payment was captured.
- Processing time is when your data system saw and handled the record.
A mobile app can hold events while the phone is offline and upload them hours later, so your stream for “today” may contain event times from yesterday. Batch jobs hit the same problem with late files, but streaming dashboards make the mismatch more visible, because people expect “now” to mean “now in the world.” When you define a metric on a stream, say which clock you use. The metrics series insists on clear definitions, and that matters even more when time itself has two meanings.
Micro-batch: the compromise that runs the business
Many warehouses and scheduling setups run every 5, 15, or 60 minutes. That is still batch, because each run handles a fixed window on a short schedule. The delay is measured in minutes and not milliseconds, and the complexity stays close to plain batch. For a huge share of analytics and operational reporting, micro-batch is enough.
Micro-batch often wins in cases like these:
- Support volume dashboards for team leads
- Marketing spend pacing through the day
- Warehouse pick rates for shift supervisors
- Product funnels that do not drive automated actions for users
If a stakeholder says “real time” and then accepts “within fifteen minutes,” write that down and stop the architecture spiral. You just saved a quarter of engineering work.
Build a latency budget before you build a pipeline
A latency budget is just a short form you fill in before anyone builds anything:
Decision: ________________
Consumer: ________________
Max age of data at decision time: ______ minutes / hours / days
Cost of being wronger but faster: ________________
Cost of being righter but slower: ________________
Action taken on fresh data: automated / human / none yet
Fill it in with real answers. “The CEO might glance at it” is not a budget. “The on-call engineer is paged if the error rate exceeds 5% for 10 minutes” is a budget, and so are “finance closes the books two days after month end” and “the sales manager plans calls each morning with yesterday’s list of open deals.”
Notice the last line of the form, which asks about the action. Streaming without an action is entertainment infrastructure. If the only action is a person reading a chart in a weekly meeting, a daily batch is usually the right answer.
Worked example: four stakeholders, four latencies
Take one company with one set of order events and four different needs. The table below shows how you stop a single “platform real-time initiative” from eating every use case.
| Use case | Decision timing | Max useful age | Mode | Why |
|---|---|---|---|---|
| Board monthly revenue | Reviewed at the monthly meeting | A few days after month end is fine | Batch (a daily run plus the month-end close) | Needs complete refunds and accounting rules |
| Sales pipeline stand-up | Read each morning before calls | Under 12 hours old is fine | Batch nightly or micro-batch | A person plans the day, and nothing is routed automatically |
| Warehouse pack station screen | Watched continuously during a shift | Under 2 minutes old | Micro-batch or stream | Operators act on the screen all shift long |
| Card fraud block | At the moment of authorization | Under 1 second old | Stream or an online service | The decision is automated inside the product path |
| need | prefer |
|---|---|
| Daily exec report | Batch |
| Fraud alert < 2 min | Streaming |
| Nightly ML features | Batch |
| Ad-hoc SQL | Warehouse SQL |
Suppose engineering only has budget for one path this quarter. Do not start with the board pack “going real time.” Start where a delay changes outcomes in the product or in operations. Board packs can stay batch forever and still be excellent.
A tiny schedule sketch (batch or micro-batch)
Scheduling tools, which the later post on orchestration (scheduling data jobs in the right order) covers, usually express batch as a schedule plus a list of steps that depend on each other. Here is the idea in a few lines:
# conceptual only (not a full Airflow install)
schedule: "0 * * * *"          # hourly micro-batch
tasks:
  - extract_orders             # land
  - build_orders_clean         # transform
  - refresh_ops_dashboard      # serve
sla_minutes: 45                # fail the run if older than this
This is what that design promises the people who read the dashboard:
| Moment in the run | Data through | Notes |
|---|---|---|
| Job starts at the top of the hour | The previous hour’s window | The edges of the window depend on how late the source is |
| About 20 minutes in, a typical finish | The same window, checked and certified | Within the 45-minute SLA (service-level agreement, the promised freshness) |
| 50 minutes in and still running | The dashboard is stale for readers | Page the on-call engineer and do not fail silently |
A table like this is far more useful in a stakeholder meeting than a slide that says “event-driven architecture.”
When delay is fine (a longer list than people admit)
A delay is fine in these situations:
- The decision happens on a human cadence, such as daily, weekly, or monthly.
- Completeness matters more than speed, as with refunds, chargebacks, and late adjustments.
- The metric compares full periods, such as week over week or the first month of a cohort.
- You need heavy joins and rebuilds that are cheaper to run as batch SQL (the standard language for asking a database for data).
- Regulatory or finance processes already lock the numbers on a calendar.
- Nobody is automated on the number yet, so freshness cannot change outcomes today.
A delay is not fine in these situations:
- An automated system blocks, routes, prices, or alerts based on the data.
- Operators work continuously, and stale screens would cause physical or customer harm.
- Fraud, safety, or abuse signals lose their value within minutes.
- You already promised a freshness guarantee in an analytics product that customers use.
Most internal analytics work sits in the first list. That is not a failure of ambition, because it simply matches the speed of the decision to the speed of the data.
Talking to stakeholders without starting a platform war
Latency conversations go wrong when they turn into arguments about identity, such as “we are a real-time company.” Keep them practical with a few questions:
- Replace “real time” with a number and a unit.
- Ask what decision changes at that freshness.
- Ask whether the action is automated or done by a person, because a person reading a report rarely needs second-by-second data.
- Ask what completeness you give up if you speed things up.
- Offer a trial of micro-batch for two weeks with an explicit success measure, such as fewer escalations or faster operations response, instead of a vibe check.
You will still lose some arguments to fashion. Write down the budget you recommended anyway. When the streaming project stalls, that written budget is how the team gets back to something it can ship.
How this sits on the four-stage path
Streaming and batch are not separate paths that skip stages. They change the rhythm of each stage:
- Sources: databases can be copied on a schedule (batch) or watched for changes (stream-like), and apps can send out events.
- Land: data arrives as nightly file drops, or as continuous append-only logs.
- Transform: cleanup runs as scheduled SQL models, as continuous processors, or as both (stream for operations, batch for finance).
- Serve: people read live APIs (connections one program uses to ask another for data) or refreshed dashboard extracts, or both with clear labels.
A hybrid is normal: fraud streams, finance batches, and marketing uses micro-batch. Your job is to label which number comes from which rhythm, so nobody compares a 2-second fraud metric to a next-day revenue metric and declares a “data inconsistency” as if the clocks were the same.
Quality still applies. Late data, duplicate events, and changing table layouts do not become rare because you bought a streaming logo. They become different shapes of the same problems covered in the data quality series. SQL skill still matters for batch tables built for reporting (SQL series), and Python still shows up in jobs and analysis notebooks (Python series). Find more paths on the Learn hub instead of assuming every freshness problem needs a new pattern.
Common mistakes
- Treating real time as a status symbol. Speed that nobody acts on is wasted.
- Using one latency for the whole company. The board and fraud detection do not share a budget.
- Streaming the incomplete day into period metrics. For closed periods, completeness beats speed.
- Ignoring event time. “Now” in the pipeline, the chain of steps that moves your data, is not always “now” in the world.
- Calling micro-batch streaming in executive slides. You then understaff the always-on promise you implied.
- Setting no freshness promise for the serve stage. Consumers invent their own expectations and feel let down every day.
- Debugging only the dashboard clock. The tile may refresh every minute while the land stage is still nightly.
- Skipping the plan for reprocessing. If you cannot rebuild a bad hour, you do not have analytics. You only have a stream of data.
Quick recap
- Batch moves fixed windows on a schedule, streaming processes ongoing events, and micro-batch is batch on a short schedule.
- Latency is a budget tied to decisions and actions, and it is not a brand value.
- Most analytics can be late by design when completeness and human cadence dominate.
- Streaming earns its complexity when delay changes automated or continuous outcomes.
- Event time and processing time are different clocks, so say which one a metric uses.
- Hybrid rhythms are normal, and labeling them keeps comparisons honest.
How to practice this week
- Pick three numbers you use: one strategic, one operational, and one used in an automated or nearly automated way if you have it.
- Write a latency budget sentence for each one, with the maximum age and the type of action.
- Find the actual refresh times: when the source extract runs, when the cleanup step runs, and when the dashboard cache (a saved copy kept so it loads faster) updates. Note the slowest stage.
- Label each number batch, micro-batch, or stream based on reality and not aspiration.
- In the next “we need real time” conversation, ask only this: “What decision changes if this is 15 minutes old instead of 24 hours old?”
- Optionally, document one metric that must stay batch for completeness reasons, such as refunds, adjustments, or late events.
The next post in this series compares warehouses, lakes, and “just a database,” with a decision tree for non-architects.
Series notes
This is Part 2 of How data actually moves. The previous post covered the four-stage path. The next one compares warehouses, lakes, and a plain database.
Sources
- Apache Flink documentation. “Event Time” and “Processing Time” (clear intro to time semantics). https://nightlies.apache.org/flink/flink-docs-stable/docs/concepts/time/
- Apache Kafka documentation. “Introduction” (event log mental model for streaming systems). https://kafka.apache.org/intro
- Apache Airflow documentation. The “DAGs” page and the scheduling concepts it introduces. https://airflow.apache.org/docs/apache-airflow/stable/core-concepts/dags.html
- Google Cloud. “Batch and stream data processing” overview (vendor-hosted, useful contrast language). https://cloud.google.com/dataflow/docs/concepts/beam-programming-model
- dbt Labs. “About dbt” (batch-oriented transform workflows most analytics teams still run). https://docs.getdbt.com/docs/introduction
Keep going
Same lessons in your feed
Short diagrams, hooks, and weekly tutorials on Substack, Instagram, X, and Facebook.