
Churn and retention are not the same thing, and mixing them up is how two smart people argue about one company and never agree. Logo churn counts the customers who left, while revenue churn and net retention count the recurring dollars, including extra money from customers who bought more. The fix is to write down your definitions before anyone opens a dashboard (a screen of charts that tracks key numbers).
Say you sit in a meeting where your head of sales says “churn is fine,” and your head of support says “we are bleeding customers.” Both are looking at real dashboards, and both are being honest. One is looking at revenue kept after upsells. The other is counting customers who cancelled. Because the room treats the two words as the same, nobody notices that the numbers answer different questions.
Retention is a family of metrics, not one number
In everyday speech, retention means “they stayed.” In analytics, you always have to say what stayed: the customer, the paid seat, the recurring dollar, or the person who opened the app this week. Product teams usually mean activity retention, which asks whether the user came back. Finance teams usually mean commercial retention, which asks whether the subscription continued. Both are legitimate, and confusing them is how a product team celebrates weekly active users while finance watches monthly recurring revenue (MRR, the subscription money you expect to collect each month) walk out the door.
This post stays with commercial retention, the kind that sits next to annual recurring revenue (ARR, which is MRR multiplied by twelve). Activity retention still matters for product work, and it can warn you before customers cancel, but a board pack usually wants subscription and revenue language. If you want the wider habit of defining metrics cleanly, the series on writing metric definitions pairs well with this post.
Rule of thumb: Never say “retention is 92%” until you can say who was counted, what “kept” means, over what time window, and under which rules.
The four decisions behind any retention number
Before you touch a formula, settle four decisions. If you skip even one, two honest analysts will build two different numbers from the same data, and each will be able to defend theirs.
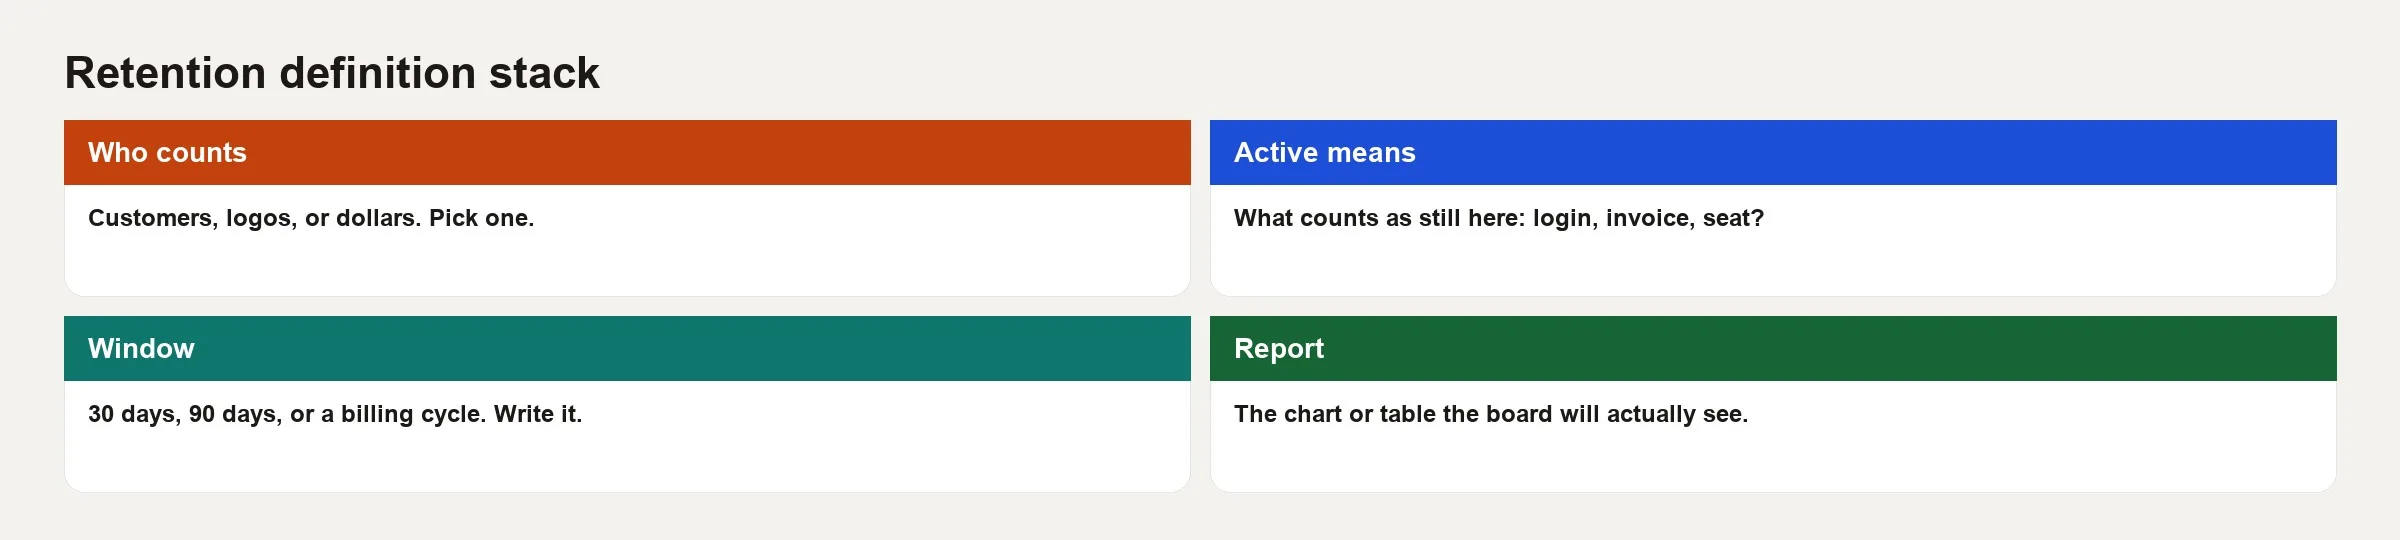
1. Who counts
Decide whether the unit is a person, a company account, a billing parent, a subscription, or a contract. Business-to-business companies often want retention at the account level, even when one account holds five subscriptions, because the relationship is what they care about. A marketplace may want to track sellers and buyers separately. Internal “customers,” such as another department in your own company, are usually left out of external subscription metrics.
Write the unit in one sentence: “A logo is a distinct paying company account with at least one active recurring subscription.” If you cannot write that sentence, you are not ready to report logo churn, because nobody will agree on what a logo is.
2. What active means
Active might mean paying, or simply not cancelled, or not more than some number of days late on a bill. It might also mean still inside the contract even though a payment failed. Paused subscriptions are the classic trap. Some teams count a pause as retained, some count it as churned, and some invent a third status and leave pauses out of both the top and bottom of the fraction. Any of those choices can be fine. Quietly using different ones in different reports is not fine, because the numbers will stop matching and nobody will know why.
3. Window
Monthly, quarterly, and yearly windows tell different stories. Churn of 3% per month is a very different business from 3% per year, yet people drop the time unit when they talk. Cohort windows (customers who joined in January, measured three months later) also differ from portfolio windows (everyone who was active at the start of the quarter). The next post in this series goes deep on cohort charts. For now, put the window in the title of every slide.
4. Report shape
Decide whether you will report a rate, a count, a dollar amount, a bridge, or a curve. Decide whether the starting base sits under the fraction. Also decide whether you will annualize a monthly rate, meaning stretch it to a full year. A simple annualizing formula can mislead when churn is not steady from month to month, so it is safer to show the raw rate for the period along with a label for the window.
Logo churn versus revenue churn
Logo churn (also called customer churn) counts the customers who stopped being customers under your definition. If you started the month with 100 logos and lost 5, and you gained none, logo churn is 5%. New logos do not normally lower the rate in the classic version, because they show up in growth metrics instead. Confirm whether your company divides by the starting base, the average base, or something else. The starting base is common, and it is the easiest to audit.
Revenue churn looks at the recurring dollars lost from the customers you had at the start of the period. It usually includes cancellations, and sometimes downgrades, depending on whether your company counts shrinking accounts inside “churn” or next to it. A company can lose few logos and lots of revenue if one large account leaves. It can also lose many small logos and little revenue if the big customers stay and spend more.
Both metrics answer useful questions, just different ones:
- Logo churn asks whether we are keeping our relationships with customers.
- Revenue churn asks whether we are keeping the recurring dollars from the base we already had.
Gross retention and net retention
These two are board favorites, and they are also where definitions most often go wrong.
Gross revenue retention (GRR, sometimes just “gross retention”) measures how much of your starting recurring revenue you kept after cancellations and downgrades. It does not let extra sales to existing customers rescue the number. In simple form, for one period:
GRR ≈ (starting MRR − churned MRR − contraction MRR) / starting MRR
Contraction means a customer who stays but pays less. Because expansion is left out, GRR cannot go above 100% in the standard version.
Net revenue retention (NRR, also called net dollar retention or NDR, or just “net retention”) lets expansion offset the losses:
NRR ≈ (starting MRR − churned MRR − contraction MRR + expansion MRR) / starting MRR
NRR can go above 100% when upsells outweigh losses. That can be excellent news. It can also hide a hole, because a few large customers buying more can paper over an exit of small ones. Healthy companies usually track NRR, GRR, and logo churn together so the story cannot hide inside one number.
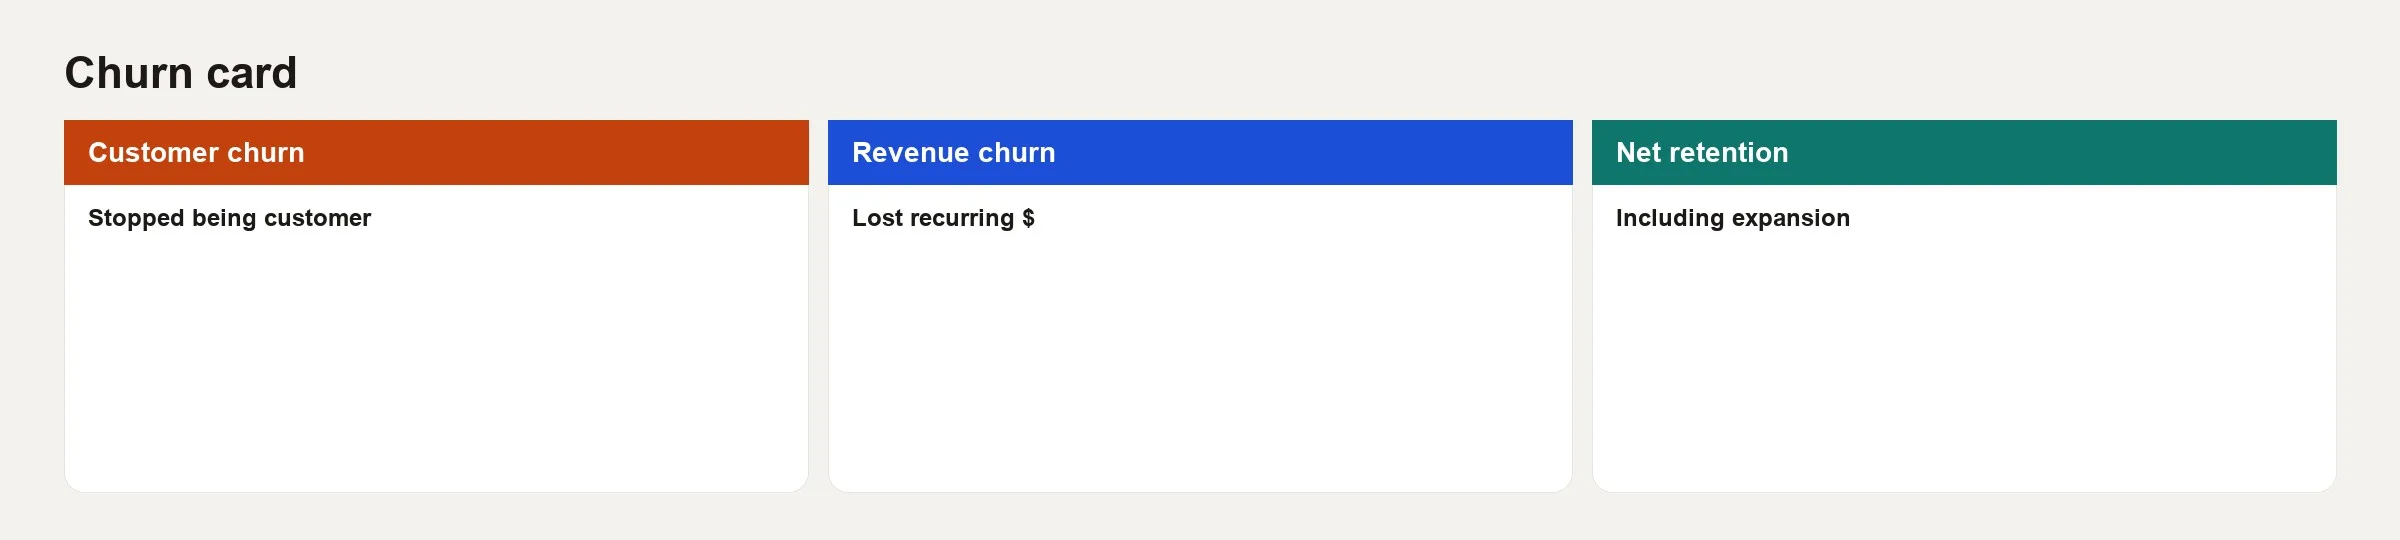
Keep a churn card like the one above next to your ARR definition. If someone quotes only net retention, ask for logo churn and gross retention in the same breath.
A small example where the story splits
Picture a toy company with five accounts, and look at monthly recurring revenue at the start and end of April:
| Account | Start MRR | End MRR | What happened |
|---|---|---|---|
| Acme | $10,000 | $14,000 | Expansion |
| Beta | $2,000 | $0 | Churned |
| Coral | $1,500 | $1,000 | Contraction |
| Delta | $500 | $500 | Flat |
| Echo | $1,000 | $0 | Churned |
You started with 5 logos, and 3 of them stayed (Acme, Coral, and Delta). So logo churn is 2 out of 5, or 40%, for the month. That is rough, and the tiny sample makes it noisy, which is useful here because it makes the point obvious.
Now the dollars. Starting MRR is $15,000, and the pieces break down like this:
- Churned MRR = $2,000 + $1,000 = $3,000
- Contraction MRR = $500
- Expansion MRR = $4,000
GRR ≈ ($15,000 − $3,000 − $500) / $15,000 = $11,500 / $15,000 ≈ 76.7%
NRR ≈ ($15,000 − $3,000 − $500 + $4,000) / $15,000 = $15,500 / $15,000 ≈ 103.3%
Net retention looks fine for a toy month, while logo churn looks alarming and gross retention looks weak. If your summary said only “NRR 103%,” you would miss half the story, and that is exactly why you carry several definitions side by side instead of treating them as rivals.
Here is a query sketch that forces each piece into its own column:
SELECT
  SUM(start_mrr) AS start_mrr,
  SUM(CASE WHEN end_mrr = 0 THEN start_mrr ELSE 0 END) AS churned_mrr,
  SUM(CASE WHEN end_mrr > 0 AND end_mrr < start_mrr
           THEN start_mrr - end_mrr ELSE 0 END) AS contraction_mrr,
  SUM(CASE WHEN end_mrr > start_mrr
           THEN end_mrr - start_mrr ELSE 0 END) AS expansion_mrr
FROM account_mrr_snapshot
WHERE cohort_month = DATE '2026-04-01';
Real systems have to handle mid-month changes, partial months, and accounts that belong to a parent company. Treat this sketch as a teaching scaffold. Its job is to keep the loss pieces separate from the expansion piece until the moment you combine them into NRR.
Voluntary, involuntary, and paused customers
Not every exit needs the same response. Voluntary churn means the customer chose to leave. Involuntary churn means a payment failed, a card expired, or the reminder emails about it never got a response. Product and customer success teams want the voluntary reasons, while the payments and email teams own most of the involuntary recovery. If you lump both into one “churn” number without tags, the wrong team ends up owning the fix.
Pauses and seasonal subscriptions need a written rule too. A landscaping app whose customers pause every winter is a different case from a core product pause that usually ends in a cancellation. If pauses are large, report them as their own state in your bridge (the chart that walks from starting revenue to ending revenue) instead of shoving them into retained or churned on a hunch.
How this connects to ARR movement
The earlier post in this series on ARR and MRR vocabulary built a bridge, and retention metrics are a second view of the same machine. New customers and expansion grow the base, while contraction and churn shrink it. NRR looks at the net change in the customers you already had, and logo metrics count relationships. When you debug a miss against plan, ask which piece moved: too few new customers, too little expansion, or too much lost. A retention miss then splits again into logos, dollars, and involuntary payment failures.
Data ownership matters here too. If finance, the customer success (CS) tools, and your data warehouse (the central database that holds company data for reporting) disagree on cancel dates, your churn rate is really a data quality problem in disguise. The series on data quality is a good companion when the cancel dates refuse to line up.
Common mistakes
- Quoting NRR alone. Expansion can mask lost customers and weak GRR.
- Changing denominators quietly. Starting base, average base, and “customers who could have churned” produce very different rates.
- Calling activity retention commercial retention. A login last week is not a paid subscription.
- Annualizing monthly churn with a formula that sounds precise. Show the rate for the period and the window instead.
- Ignoring involuntary churn. You will staff the wrong recovery effort.
- Letting customer success keep definitions in a private spreadsheet. Official retention metrics need a definition in the warehouse and a named owner, the same discipline you give ARR.
- Comparing your NRR to a blog benchmark (a standard test used to compare results) that uses a different definition. Without a matched method, a benchmark only gives you a direction.
How to practice
- Write your company’s retention definitions on one page: who counts, what active means, the window, and the report shape, so every team computes the same number.
- Compute logo churn, GRR, and NRR for one recent month on a sample of accounts. Even 20 rows will teach you more than a vague dashboard.
- Tag last month’s cancellations as voluntary or involuntary if the data exists. If it does not, file a data request so it starts to.
- Add a footnote under every retention chart that states the definition in one sentence, because readers compare charts that may use different definitions.
- Get ready for the next post: take one month of new customers and sketch their retention at months 1, 2, and 3 by hand before you build a pretty heatmap.
The next post in this series covers cohort retention charts without lying, including axes, sample size, and lining up time periods. For learning paths across analytics topics, use the Learn hub. If your customer stages are messy before they ever reach finance metrics, the material on funnels and cohorts will help you connect product events to commercial outcomes without pretending they are the same table.
Quick recap
- Retention and churn are families of metrics, so name what you are counting and the window.
- Logo churn tracks relationships, while revenue churn tracks recurring dollars.
- Gross retention leaves out expansion, and net retention includes it and can pass 100%.
- Settle four things first: who counts, what active means, the window, and the report shape.
- NRR can look healthy while customers leave, so carry more than one view.
- Voluntary and involuntary churn point to different owners and different fixes.
Your next step
Write your team’s retention definition in four lines: who counts, what active means, the window, and the report shape. Ask two people who use the number to read it. If they disagree, settle it now, because a churn figure with two meanings causes more arguments than no figure at all.
Series notes
This is Part 2 of Finance analytics for non-finance. The previous post covered ARR and MRR vocabulary.
Sources
- ChartMogul. “Net revenue retention” and related SaaS metric explainers. https://blog.chartmogul.com/net-revenue-retention/
- Paddle / ProfitWell. SaaS metrics resources on churn and retention definitions for operators. https://www.paddle.com/resources/saas-metrics
- Stripe. Subscriptions and customer lifecycle billing docs (status and cancellation behavior that feed churn pipelines). https://docs.stripe.com/billing/subscriptions/overview
- Tomasz Tunguz. Essays on net dollar retention and SaaS retention patterns (practitioner commentary; pair with your own definitions). https://tomtunguz.com/
- Bessemer Venture Partners. Cloud and SaaS metric frameworks used widely in board conversations (context for why NRR appears so often). https://www.bvp.com/atlas
Keep going
Same lessons in your feed
Short diagrams, hooks, and weekly tutorials on Substack, Instagram, X, and Facebook.