
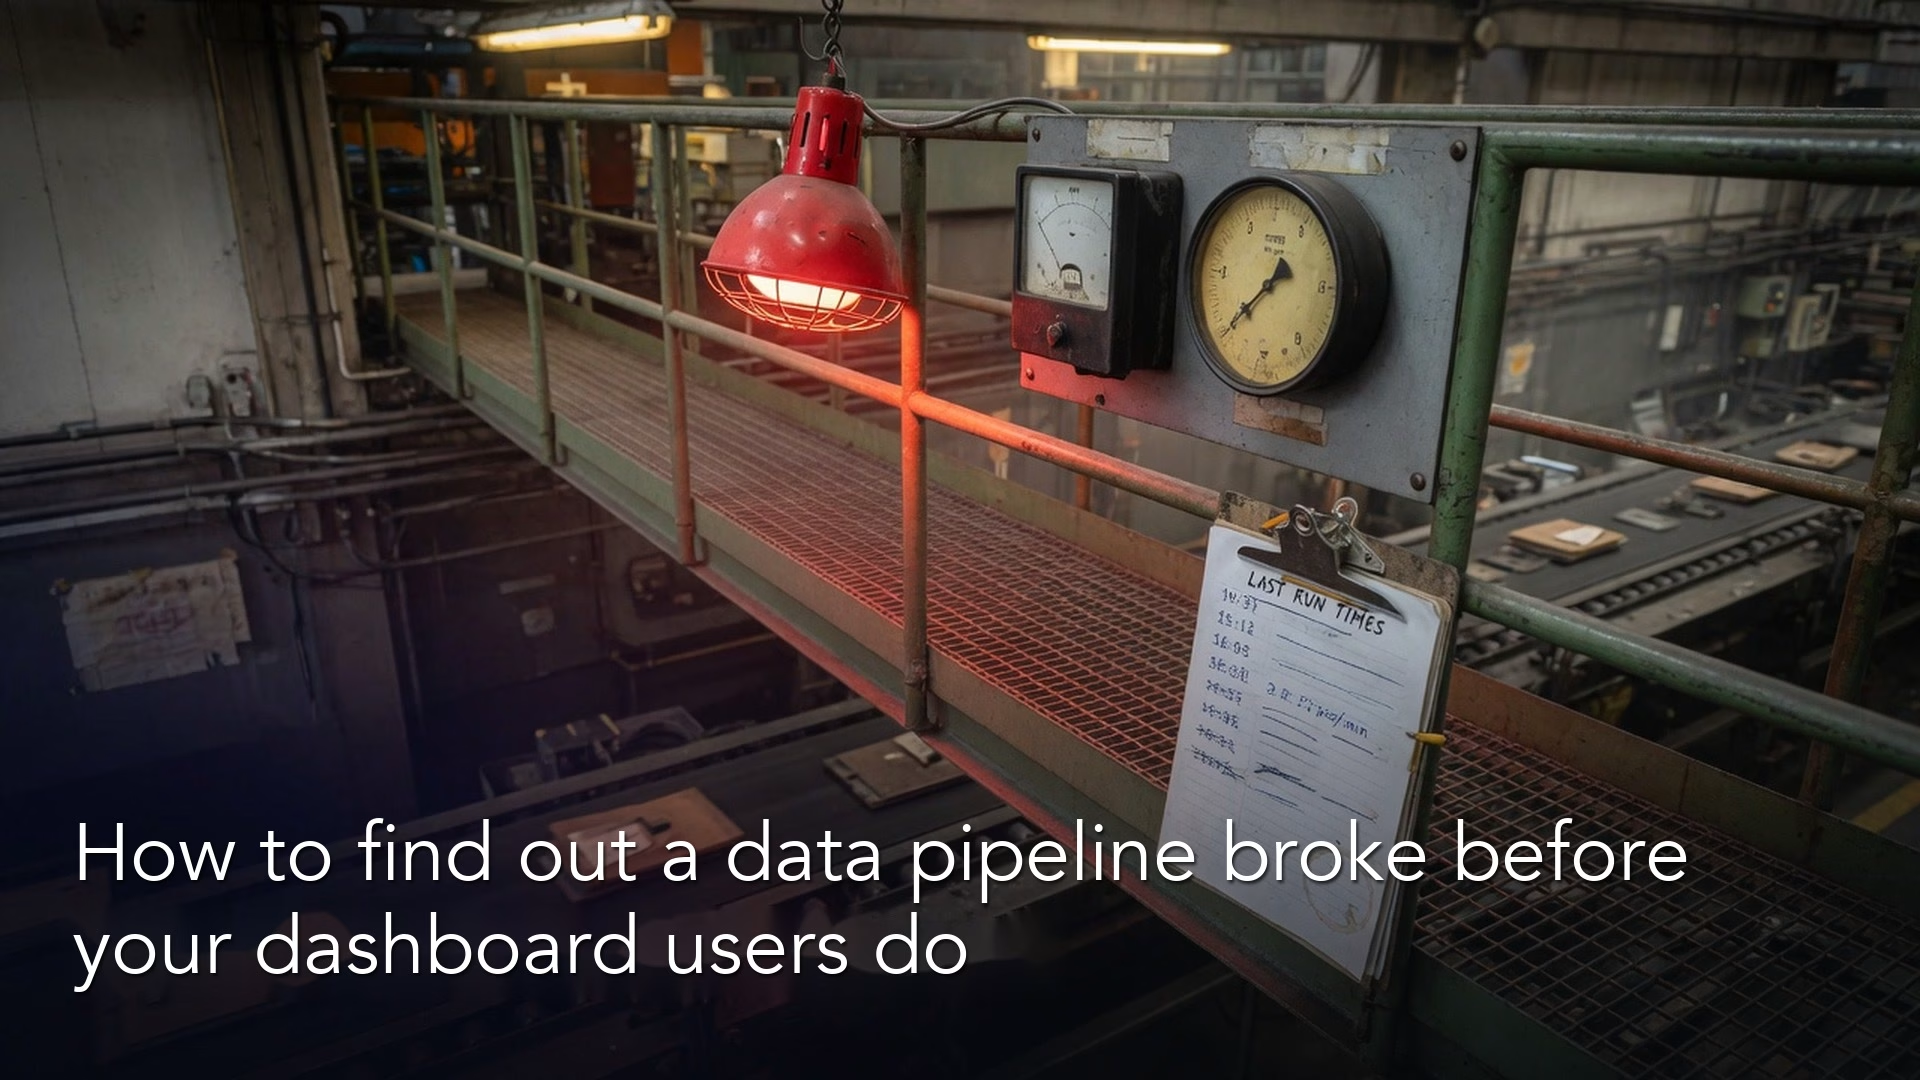
Observability means getting early news that something on the path from source to dashboard (a screen of charts and numbers that updates on its own) has gone wrong, instead of learning it when a green job light gets questioned by an executive. The four things worth watching are freshness, volume, schema (the layout of a table’s columns) changes, and tests, and each one can flag a problem before a dashboard starts to mislead people.
Say your pipeline (the automatic steps that load your data) is “fine.” The job is green and the dashboard opens. Then a vice president asks why yesterday’s orders look like a long weekend in the middle of the week. You dig in and find that the load wrote zero new rows for six hours, a column type changed upstream, and the only alert went to a chat channel that was retired months ago.
Observability is early news about the path
Observability for pipelines means you can answer a few questions without digging through old logs. Did the data arrive on time? Is the amount of data believable? Did the shape of the data change? Did our tests pass? And who owns the next step if something failed?
It is related to data quality but it is not the same thing. Quality asks whether a dataset is fit for use, while observability asks whether the system that produces datasets is behaving as expected right now. You need both, because a perfect cleanup of last year’s history does not help if today’s load never ran.
You do not need a six-figure platform on day one. You need a few honest signals on the tables people already argue about, a place to look at them (a simple board), and a named person on rotation so the plan is not “whoever notices first in chat.”
Rule of thumb: If a broken pipeline can only be discovered by a surprised human reading a chart, you do not have observability. You have hope.
Four signals that catch most fires

1. Freshness
Freshness answers a simple question: how old is the newest data we care about? You compare the latest event time or load time to a promised deadline, which teams call an SLA (a service-level agreement). “The orders table should include data through yesterday by 7:00 a.m. local time” is a freshness promise. “The job finished” is not the same thing, because a job can finish after writing nothing useful.
Warehouse platforms and schedulers often show last-modified times or job end times. Where you can, prefer a timestamp the business understands, such as the latest order_ts in the reporting table, rather than only a note that the dbt run completed (dbt is a tool that runs your SQL, the standard language for asking a database for data, in order).
2. Volume
Volume asks whether we loaded a believable amount of data. A fixed minimum catches empty loads, while a relative band around the usual amount catches half-finished files and double loads. Weekdays and seasons matter, since a Saturday drop may be perfectly normal. When you can, measure volume at the same level of detail as the table people actually read.
3. Schema drift
Schema drift is what happens when columns appear, disappear, get renamed, or change type upstream and your transformations do not notice in time. A new rule about empty values, or a piece of text where a number used to be, can quietly turn revenue into zero after an automatic conversion. You catch drift by comparing the database’s own catalog of columns (the information schema) or a set of contract tests to what your models expect. Fail loudly on changes that break things, and log harmless additions so someone can review them later.
4. Tests
Tests are the checks you already met in the earlier post on transforms and in the data quality series, such as unique keys, no missing values, accepted values, matching relationships, and custom SQL sanity checks. The job of observability is to show test results on a board with a history, so they do not sit in an automated build log that nobody opens until Friday.
| Signal | Plain question | Example fail | Typical first response |
|---|---|---|---|
| Freshness | Is data recent enough? | Max order date is two days old at 9 a.m. | Check extract and orchestrator; delay dependent dashboards |
| Volume | Is row count plausible? | 0 new rows; or 3× yesterday without promo | Inspect load files, filters, late duplicates |
| Schema drift | Did shape change? | amount became string; column dropped | Halt promote; fix model or push back on source |
| Tests | Do assertions hold? | Duplicate order_id; null revenue | Block mart consumers; patch logic or source |
Red, yellow, green without theater
A simple severity scale keeps people sane, because everyone knows what each color asks of them.
- Green: the data is within its deadline, tests pass, and volume is in the normal band. Nothing to do beyond normal watching.
- Yellow: an early warning. Freshness is late but recoverable, volume is slightly out of band, a harmless column was added, or a flaky test is under investigation. Tell the owners during business hours, and do not wake anyone at 2 a.m. unless the business runs around the clock on that number.
- Red: stop the line for anyone who depends on the data. This means an empty critical table, a broken primary key (the column that uniquely identifies each row), freshness past the hard deadline for executive reporting, or a schema change that corrupts amounts. Page the on-call person or named owner right away, and consider a banner on dashboards that says “data delayed.”
Colors without thresholds are decoration. Write the threshold next to the light, for example “Red if the latest order_ts is older than 26 hours on weekdays.”
Decide too what green does not mean. Green says the pipeline signals look fine, which is different from saying the business strategy is correct or that every metric definition is perfect. Keep arguments about definitions in metric reviews, and keep them off the operations board.
Who gets paged
Paging is expensive, so save it for red lights on tables that matter.
- Primary owner: the person or rotation who can restart jobs, read the scheduler’s logs, and open a proposed fix.
- Backup and escalation: the platform or engineering lead, if the primary owner misses the window.
- Consumer lead (notify, not always page): the finance or operations partner who may need a delay banner on a dashboard or a meeting moved.
- Do not page: the whole company chat, every analyst “for awareness,” or the CEO over a yellow volume blip on a sandbox table.
Write a tiny who-does-what chart for your top five tables, listing who is responsible, who approves, and who just needs to be told. If the owner is listed as “data team,” that is not a name. Put a rotation on the calendar even if the rotation is only two people trading weeks.
Analysts often sit next to the on-call rota and do not hold the pager themselves. You should still learn the board. When you see yellow, you can stop building a story on half the data, and when you see red, you can delay the deck instead of inventing an explanation. That is professional, and it is not passive.
A worked example with a simple check board
Below is a morning board for a made-up commerce analytics setup. It has three critical datasets, four signals, and traffic-light status. A board like this can live in a spreadsheet, a wiki table, a small internal page, or a proper observability tool later. The design matters more than the vendor.
| check | status | value |
|---|---|---|
| freshness_hours | PASS | 4h |
| row_count_band | WARN | +12% vs 7d |
| schema_hash | PASS | unchanged |
| null_rate_amount | PASS | 0.3% |
| Dataset | Freshness SLA | Volume rule | Schema | Tests | Overall | Owner |
|---|---|---|---|---|---|---|
fct_orders_daily | By 07:00, data through yesterday | New rows within 60-140% of 28-day same-weekday median | Contract match | unique order day key; amount not null | Red / Yellow / Green | DE rotation |
dim_customer | By 07:30 daily | Row count not below prior day minus 5% without ticket | Contract match | unique customer_id | R/Y/G | DE rotation |
fct_marketing_spend | By 09:00 (vendor lag) | Channels present ≥ baseline set | Contract match | spend >= 0 | R/Y/G | Marketing analytics |
Here is an example SQL sketch for freshness and volume on the orders table. Run it after the load and log the result:
WITH bounds AS (
  SELECT
    MAX(order_date) AS max_order_date,
    COUNT(*) AS rows_yesterday
  FROM analytics.fct_orders_daily
  WHERE order_date = DATE_ADD(CURRENT_DATE(), INTERVAL -1 DAY)
),
baseline AS (
  SELECT APPROX_QUANTILES(day_rows, 100)[OFFSET(50)] AS median_same_weekday
  FROM (
    SELECT order_date, SUM(order_count) AS day_rows
    FROM analytics.fct_orders_daily
    WHERE order_date BETWEEN DATE_ADD(CURRENT_DATE(), INTERVAL -56 DAY)
                        AND DATE_ADD(CURRENT_DATE(), INTERVAL -8 DAY)
      AND EXTRACT(DAYOFWEEK FROM order_date)
          = EXTRACT(DAYOFWEEK FROM DATE_ADD(CURRENT_DATE(), INTERVAL -1 DAY))
    GROUP BY 1
  )
)
SELECT
  max_order_date,
  rows_yesterday,
  median_same_weekday,
  CASE
    WHEN max_order_date < DATE_ADD(CURRENT_DATE(), INTERVAL -1 DAY) THEN 'RED_FRESHNESS'
    WHEN rows_yesterday = 0 THEN 'RED_VOLUME'
    WHEN rows_yesterday < 0.6 * median_same_weekday
      OR rows_yesterday > 1.4 * median_same_weekday THEN 'YELLOW_VOLUME'
    ELSE 'GREEN'
  END AS status
FROM bounds CROSS JOIN baseline;
Wire the status column into your board or alerting tool. Tune the bands after two weeks of false yellows, because the first version will be slightly wrong and a noisy threshold you improve beats silence.
Optionally, you can send lineage and run events to an open standard such as OpenLineage, so several tools can share what ran and what it produced. Even without that setup, keep a simple run log with the job name, start time, end time, rows written, and status.
Lineage, incidents, and the human runbook
When a red light comes on, people need a short runbook, which is a written list of steps to follow:
- Confirm the signal, so you know it is not a flaky query (a written request for data from a database) against the wrong schema.
- Check upstream: the extract job, the API (the way one program asks another for data) quota, the file drop, and the scheduler queue, which the earlier posts on sources and orchestration (the tool that runs data jobs in order on a schedule) covered.
- Check the transforms: the dbt or SQL job logs and any failed tests, because a failed job upstream is the most common reason a number looks wrong.
- Check the environment, since someone may have deployed to the wrong target.
- Communicate with a banner, a note to the consumer leads, and an estimated time of arrival for the fix if you know it.
- Fix the problem, confirm the board is green again, and write a three-bullet incident note the same day.
Habits around ownership, incidents, and access grow in the next phase of the roadmap on this site. For now, remember that observability without a runbook is just expensive anxiety.
Mistakes that come up again and again
- Only monitoring job success. The job is green, the table is empty, and an executive is unhappy.
- Alerting on everything. People get tired, and then a real red light gets ignored.
- No owner on the board. A light without an owner helps nobody.
- Thresholds that never get tuned. A permanent yellow teaches people to look away.
- Ignoring schema drift until the dashboards break. By then the slide deck is already wrong.
- Hiding status from analysts. People keep publishing from bad data because nobody told them.
- No link to quality tests. Observability and validation should cover the same critical tables.
- Paging people about sandbox toys. Protect the on-call person’s focus for approved production tables.
How to practice this week
- Pick three tables that would embarrass you if they were wrong in a leadership meeting.
- Write one freshness promise and one volume rule for each, in plain English, so anyone can tell when a table is late or short.
- Build a one-page board (a spreadsheet is fine) with red, yellow, green, and an owner for each table.
- Run a manual freshness query three mornings in a row, and note any false alarms.
- Find where test results already live (dbt, your build system, or scripts) and link them from the board.
- Agree on who is the primary owner for one red scenario this month, and put the name on the calendar.
Quick recap
- Observability gives early news through four signals: freshness, volume, schema drift, and tests.
- Red, yellow, and green need written thresholds and restraint about who gets paged.
- Owners and runbooks turn lights into action.
- Start with a simple board on your critical tables, and buy tools later if you need them.
- Data quality checks and pipeline signals reinforce each other.
Where to go next
This series was written for analysts who inherit pipelines and need a mental model rather than a vendor certification. Together the posts answer where data comes from, how fast it moves, where it lives, what runs it, how transformations are structured, how changes get promoted, and how you know the path is healthy. To keep building, try these:
- Data quality for profiling, validation, and scorecards on the tables you just learned to watch.
- SQL series for the queries behind models, checks, and reporting tables.
- Python for analytics when exploration, light automation, or charts sit beside the warehouse.
- Metrics that matter so the tables you protect map to decisions and not to vanity tiles.
- Learn for the full path map on this site.
The next practice layer on this site’s roadmap is stewardship, which covers ownership, catalogs, access, incidents, and working with your legal team without panic. Pipelines move data, and stewards make sure the right people care for it after it lands. You do not need a fancy title to start acting like one, because you can name owners on your board, write down what one row means on your tables, and refuse to ship a number you cannot rebuild.
If you remember one thing from this series, make it this. Data work is a path with stages, schedules, environments, and signals, so when a chart looks wrong you should walk the path before you invent a business story. That habit alone will save you years of confident, elegant mistakes.
Series notes
This closes How data actually moves (Part 7, codes G1 to G7). The seven posts cover the path from sources to dashboards (G1), batch versus streaming (G2), warehouses, lakes, and plain databases (G3), orchestration (G4), dbt in concept (G5), development, staging, and production environments (G6), and this post on observability (G7).
Sources
- dbt Labs: Source freshness (freshness as a first-class check on upstream data)
- dbt Labs: Data tests (assertions that belong on the observability board)
- OpenLineage documentation (open standard for job and dataset lineage events)
- Great Expectations documentation (conceptual validation expectations and data docs mindset)
- Snowflake: LAST_CHANGE_COMMIT_TIME and related freshness ideas (warehouse-side ways to reason about when data changed)
- Google Cloud: BigQuery JOBS information schema (inspecting what ran and when for operational debugging)
- Analytics Made Simple: Data quality (dimensions, validation, scorecards)
- Analytics Made Simple: SQL series (query foundation for checks and marts)
- Analytics Made Simple: Learn (series map and next paths)
Keep going
Same lessons in your feed
Short diagrams, hooks, and weekly tutorials on Substack, Instagram, X, and Facebook.



