
Pick one clock for every date in a report, and write it down, before anyone compares numbers. Otherwise a number on a dashboard can change without any customer doing anything different, simply because two people counted the same sales against different clocks.
Say you open the regional sales dashboard on a Monday and see a 12% drop for Sunday. The team chat starts out friendly and ends in blame. Operations swears the weekend promotions went fine, and finance says the week is incomplete. Someone in Europe points out that the chart rolls over at midnight UTC (Coordinated Universal Time, the world’s shared reference clock), while stores in the US still ring up sales at 8 p.m. local time. Nobody changed a KPI, which is just a number the business tracks. The clock did.
This post is the fifth in the data quality series for people who ship numbers. The earlier posts covered what bad data means, how to profile a table before you polish it, how to remove duplicates without erasing history, and how to standardize categories. Here we deal with the clock layer on top. If you already think in tables from the SQL (the standard language for asking a database for data) tutorials or tidy exports from Python for analytics, this will feel familiar. It also helps to know the decision before you argue about hours, which the analytics foundations series covers. Spreadsheet date numbers and confusing cells like “3/4/24” from the series on moving from spreadsheets to real data show up here too.
Three clocks, one chart, and why charts mislead
Most date bugs are not bugs in the code. They are mismatched clocks pretending to be one clock. When people say “by day,” they might mean any of three things.
- Event time is when something actually happened in the world, such as a purchase, a click, or a package scan.
- Record time is when your system wrote the row, for example when a load job (ETL, short for extract, transform, load) copied it in or when someone saved the spreadsheet.
- Business day is the day leadership wants to claim for reporting, such as the store’s local day, a fiscal day, or a campaign day.
If you group only by record time, late-arriving events jump to the wrong days. If you group only by UTC midnight for a US retail chain, West Coast evenings fall into the next calendar day. And if finance closes its books on a fiscal calendar that starts in February, a “January trend” on a normal calendar axis will disagree with the profit and loss report even though nobody lied.
Quality here is not polish. It is being explicit about which clock each column uses. Put the definition next to the metric, and your future self will thank you the next time a room full of people asks why two charts disagree.
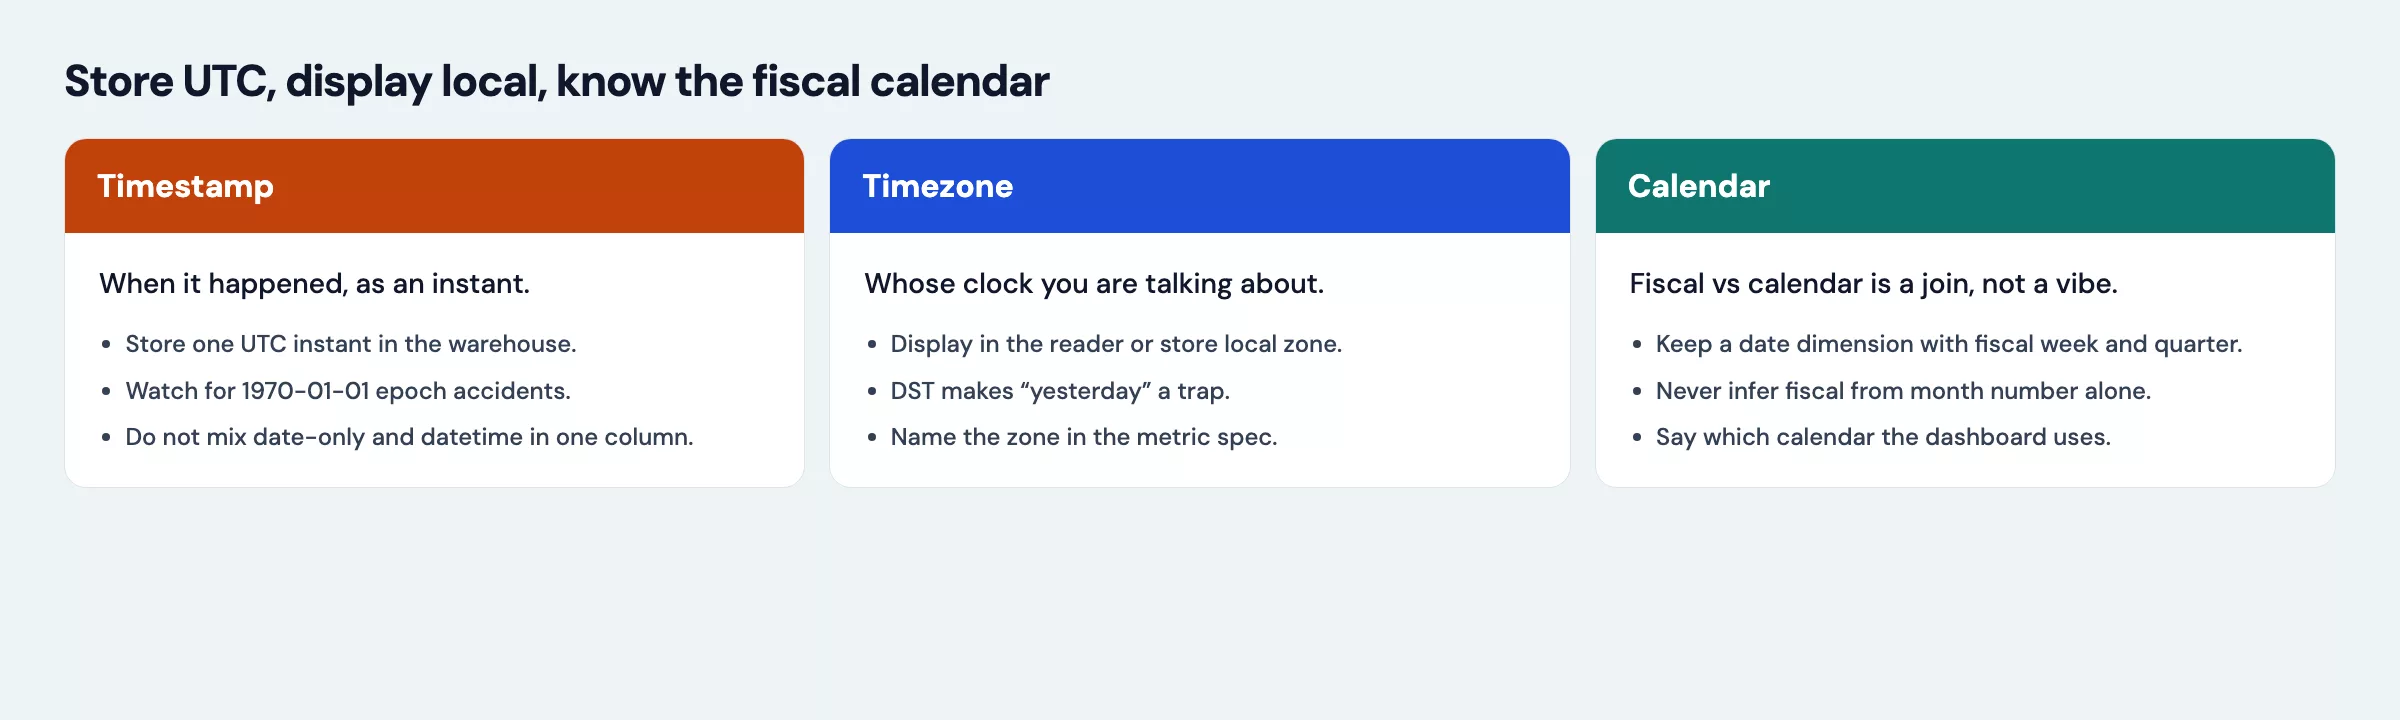
Store in UTC, show local time: the default contract
UTC is a stable reference clock that never observes daylight saving time. Because it never shifts, it makes a safe place to keep timestamps. A common contract for analytics teams has three parts.
- Store event timestamps in UTC, or as a true instant that can convert to UTC without guessing, because one shared clock keeps events in the right order across time zones and daylight-saving changes.
- Store the time zone or location context you need for local business rules, such as a store ID, a region, or a zone name from the time zone database, because you cannot work out a store’s local business day from a UTC time alone.
- Convert to local time only at the edges, in dashboards, emails, and “today for this store” filters.
Prefer zone names such as America/Los_Angeles or Europe/London over fixed offsets like -08:00. An offset describes one moment, while a zone name describes the rules over many years, including every daylight saving switch. These names come from the IANA Time Zone Database (IANA stands for the Internet Assigned Numbers Authority), which most software libraries ship with.
Timestamps written in the ISO 8601 style (ISO is short for International Organization for Standardization) travel better between systems than something like 03/04/2024 5pm, which could mean March or April. A clear offset or a trailing Z, which means UTC, removes the guessing. When you export for humans you can format the time prettily, but when you store it for machines, keep it unambiguous.
What goes wrong with local-only storage
Some teams store “server local” or “office local” times with no zone attached. That works fine until one of four things happens.
- The server moves to another region, or a cloud default changes.
- A second office opens, and “local” now means two things.
- Daylight saving springs forward, and an hour of events has nowhere to land.
- Daylight saving falls back, and one local hour happens twice.
You do not need a degree in civil time. You need one habit: never assume the database session time zone is the business time zone.
Calendar months are not fiscal months
A calendar month runs from the first to the last day of January, February, and so on. A fiscal period is whatever finance uses to close the books, and it often does not line up with the calendar. The table shows the common patterns and what goes wrong when people mix them.
| Label | What it usually means | Risk if you mix them |
|---|---|---|
| Calendar month | The 1st to the last day of Jan, Feb, and so on | Operations charts disagree with finance reports |
| Fiscal month | Set open and close dates that may not match the calendar | “March” in a slide deck is not March |
| Fiscal quarter | Quarters 1 to 4 counted from the fiscal year start | Year-over-year comparisons line up the wrong quarters |
| 4-5-4 retail calendar | Quarters split into weeks of 4, 5, and 4 | Week 1 of a “month” is not day 1 |
| ISO week | Weeks start on Monday, and week 1 holds the first Thursday of the year | A US week that starts on Sunday will not match |
Do not invent fiscal logic inside every chart filter. Build a date dimension instead, which is a small calendar table with columns such as calendar_date, fiscal_year, fiscal_period, fiscal_week, and is_period_close. Join your sales data to that table once. When finance changes a rule, you update one place and not twelve dashboards.
If all you have today is a spreadsheet calendar, treat the fiscal map as a mapping table, the same way you treated category maps in the earlier post on standardizing names. Version it, and know who owns it. That ownership question comes back in a later post on documenting quality so others can trust it.
Date types and casting: stop treating strings as times
Bad casts, meaning conversions from one data type to another, create silent quality failures. A string sorts alphabetically, while a proper timestamp sorts by time. A date with no time is a day label and not an instant. Mixing them in a single column is how you end up hearing that half of a chart is blank.
SQL casting patterns
The exact functions differ by database, but the ideas carry over. Parse with an explicit format when the source is sloppy text. Use timestamp-with-time-zone types when your engine supports them and your team understands its session zone rules. Always document what one row means (analysts call this the grain), for example whether a column is a day key or an instant.
-- Example style (adjust types to your warehouse dialect)
-- Goal: parse messy text, store UTC-ish instants, derive local business day

WITH raw AS (
  SELECT * FROM (
    VALUES
      (101, '2024-03-10 01:30:00', 'America/New_York', 42.50),
      (102, '2024-03-10 03:15:00', 'America/New_York', 18.00),
      (103, '2024-03-10 23:45:00', 'America/Los_Angeles', 90.00),
      (104, '03/11/2024 9:05 AM', 'America/Chicago', 12.00)
  ) AS t(order_id, ordered_at_text, store_tz, amount)
),
parsed AS (
  SELECT
    order_id,
    store_tz,
    amount,
    -- Prefer a single parsing strategy in real pipelines; shown as illustration
    CASE
      WHEN ordered_at_text LIKE '____-__-__%'
        THEN CAST(ordered_at_text AS TIMESTAMP)
      ELSE TO_TIMESTAMP(
        -- US-style text needs an explicit format (Postgres, Snowflake, Redshift, Oracle)
        ordered_at_text, 'MM/DD/YYYY HH12:MI AM'
      )
    END AS ordered_at_naive
  FROM raw
)
SELECT
  order_id,
  store_tz,
  amount,
  ordered_at_naive,
  -- Business day in the store's zone (engine-specific convert)
  -- CAST(ordered_at_utc AT TIME ZONE store_tz AS DATE) AS local_business_date
  CAST(ordered_at_naive AS DATE) AS naive_date_key
FROM parsed
ORDER BY order_id;
In production you will use your warehouse’s own function, such as CONVERT_TIMEZONE or AT TIME ZONE. The quality rule stays the same. Parse once, convert on purpose, save the business day you will sort rows by before totaling, and never re-parse free text in every dashboard extract.
Python casting patterns
In pandas, the to_datetime function helps a lot when you respect time zones. Python 3.9 and later also include zoneinfo in the standard library, which reads the same zone names described above.
from datetime import datetime
from zoneinfo import ZoneInfo

import pandas as pd

rows = [
    {"order_id": 101, "ordered_at": "2024-03-10 01:30:00", "store_tz": "America/New_York", "amount": 42.50},
    {"order_id": 102, "ordered_at": "2024-03-10 03:15:00", "store_tz": "America/New_York", "amount": 18.00},
    {"order_id": 103, "ordered_at": "2024-03-10 23:45:00", "store_tz": "America/Los_Angeles", "amount": 90.00},
    {"order_id": 104, "ordered_at": "2024-03-11 09:05:00", "store_tz": "America/Chicago", "amount": 12.00},
]
df = pd.DataFrame(rows)

# Source times are "wall clock at the store" without offset.
# Localize per row using the store zone, then convert to UTC for storage.
def to_utc(row):
    local = datetime.fromisoformat(row["ordered_at"]).replace(
        tzinfo=ZoneInfo(row["store_tz"])
    )
    return local.astimezone(ZoneInfo("UTC"))

df["ordered_at_utc"] = df.apply(to_utc, axis=1)
df["local_business_date"] = df.apply(
    lambda r: r["ordered_at_utc"].astimezone(ZoneInfo(r["store_tz"])).date(),
    axis=1,
)
df["utc_calendar_date"] = df["ordered_at_utc"].dt.date

print(df[["order_id", "store_tz", "ordered_at_utc", "local_business_date", "utc_calendar_date"]])
Here is what that code prints, shown as an image.
| event_local | event_utc | fiscal_week |
|---|---|---|
| 2026-03-08 01:30 EST | 2026-03-08 06:30 UTC | 10 |
| 2026-03-08 03:00 EDT | 2026-03-08 07:00 UTC | 10 |
Notice the two date keys. local_business_date answers which store day a sale belonged to, while utc_calendar_date answers which UTC day the instant fell on. Both can be valid, and shipping both without labels is how arguments start.
A worked example: the missing Sunday and the fiscal week
Imagine four orders around the weekend when US clocks spring forward, at a company whose fiscal week starts on Monday. Leadership wants revenue by local store day and a separate report by fiscal week.
| order_id | store_tz | local wall time | amount | note |
|---|---|---|---|---|
| 101 | America/New_York | 2024-03-10 01:30 | 42.50 | Before the clocks spring forward |
| 102 | America/New_York | 2024-03-10 03:15 | 18.00 | After the clocks jump, because the 2 a.m. hour was skipped |
| 103 | America/Los_Angeles | 2024-03-10 23:45 | 90.00 | Still Saturday local time, but already Sunday in UTC |
| 104 | America/Chicago | 2024-03-11 09:05 | 12.00 | Monday morning, local time |
Suppose you naively run GROUP BY DATE(ordered_at_utc) for a “US sales by day” chart. Order 103 can then land on a different day than the store actually lived. And if you ignore fiscal weeks and only show calendar weeks that start on Sunday, finance’s Monday-start report will not match your chart. Neither chart is wrong on its own, because they answer different questions.
import pandas as pd
from datetime import date

# Build on the UTC conversion from above (df already has local_business_date)
# Toy fiscal calendar: fiscal_week starts Monday (ISO-like for this example)

def fiscal_week_start(d: date) -> date:
    # Monday = 0 in date.weekday()
    return date.fromordinal(d.toordinal() - d.weekday())

summary = (
    df.assign(fiscal_week_start=df["local_business_date"].map(fiscal_week_start))
    .groupby(["local_business_date", "fiscal_week_start"], as_index=False)
    .agg(revenue=("amount", "sum"), orders=("order_id", "count"))
    .sort_values("local_business_date")
)
print(summary)

# Compare with a misleading UTC-day rollup
misleading = (
    df.assign(utc_day=df["ordered_at_utc"].dt.date)
    .groupby("utc_day", as_index=False)
    .agg(revenue=("amount", "sum"))
)
print(misleading)
Run both summaries side by side in a notebook (a document that mixes code and its results) once. The gap between them is your best training material for stakeholders. You are not being picky, because you are preventing a 12% “drop” that was really a time zone boundary.
Late data, revisable days, and a “final” number that is not final
Even perfect zone conversion fails if you pretend every day closes at midnight. Shipments get scanned late, mobile apps hold events while offline, and payment processors settle in batches. If yesterday’s dashboard number can change when late facts arrive, say so, because quality includes how stable a number is expected to be, and not only how accurate the first draft was.
Many teams use a three-stage pattern.
- Preliminary day: shown the same day or next morning, with a banner that says the number is subject to late events.
- Soft close: one or two days later, and used for most operations reviews.
- Hard close: lined up with a finance or operations freeze, and changed only through a documented restatement.
Store both event_time and available_at (or the load time) when you can. That lets you rebuild what you knew on Tuesday morning, which is a different question from what truly happened on Monday in local store time. Incident reviews care about the first question, and strategy reviews need the second. Mixing them up is how two smart people can both defend correct queries and still disagree.
Cross-region rollups without a fake company clock
Global companies often pick their headquarters (HQ) time zone and call it “company time.” That can work for a single executive view if everyone agrees. It breaks when regional managers are measured on their local day and the HQ chart moves their evening sales to another day. Reporting on two clocks is usually better.
- Regional dashboards use the local business day and local fiscal rules where they exist.
- The global dashboard uses the UTC day or the HQ day, labeled loudly, and is never presented as the regional truth.
- Always-on operations views use trailing 24-hour windows that do not pretend to be calendar days.
If you must pick one default for an executive report, write the choice in the chart’s subtitle and not in a footnote three clicks away. People read subtitles, but footnotes only get discovered during arguments.
Dashboard rules that survive contact with leadership
Write these rules into the metric definition, and not only into a team wiki that nobody opens.
- Default grain sentence: “One row is one order.
ordered_at_utcis the event instant. Charts labeled Local day use the store zone.” - Partial day banner: If today is incomplete in any zone you care about, show “in progress” instead of a fake full-day total.
- Compare like with like: Week over week should use the same clock and the same fiscal map on both sides.
- Late data policy: State whether yesterday’s number can change when late events arrive.
- Export honesty: CSV date columns should use ISO
YYYY-MM-DDor full timestamps with offsets, and never locale-ambiguous strings (see the export habits in the Python tutorials).
Rule of thumb: If two teams can compute “yesterday” differently without changing a filter, you do not have a date field. You have a rumor.
Common mistakes
| Mistake | What you see | Better habit |
|---|---|---|
| Mixing timestamps that carry a zone with ones that do not | Odd shifts of 5 to 8 hours | Use one storage convention and convert at the edges |
| Using an offset instead of a zone name | Daylight saving weeks break year-over-year charts | Store America/Chicago, not only -06:00 |
| Grouping on load time | Late facts jump between days | Keep separate event time and load time columns |
| Fiscal labels on calendar axes | Finance and operations fight | Use a date dimension that holds both calendars |
| Spreadsheet date numbers left as plain numbers | Five-digit numbers like 45321 show up as “dates” in charts | Parse with the right starting date and unit, and check the earliest and latest years |
| Hiding incomplete days | Fake drops at the end of the series | Mark partial periods explicitly |
Parsing with a silent errors='coerce' everywhere | Spikes of empty values with no alarm | Count failed parses as a quality metric |
Excel serial dates deserve a special callout. When a spreadsheet export arrives with 45321 instead of a date string, you need to know the starting point (often 1899-12-30 for Excel) and whether the value holds only a date or a date and time. Look at the earliest and latest values, because a latest year of 2099 usually means a bad cast and not a visionary forecast. The same lesson from the spreadsheet series applies here: pretty cells are not a contract, but typed timestamps are.
Quick answers you will need in a meeting
Should every column be a timestamp with a time zone?
No. Birthdays, hire dates, and fiscal period keys are often true dates with no time of day. Instant events like clicks, payments, and shipments want timestamps you can place on a timeline. Stuffing a date key into a timestamp column with midnight added is a common source of off-by-one bugs when someone later converts zones.
What if the source system only sends local wall time?
That is normal. Capture the zone from the store, the user, or a region reference table, convert carefully, and then store UTC. If the source sometimes gets the zone wrong, keep the raw string column for later investigation. Treat the converted timestamps as derived fields, and add a quality check for conversions that fail.
How do I explain a daylight saving day to a non-technical stakeholder?
Here is an example of the kind of chart that helps.
| event_ts_raw | tz_assumed | utc | dst_note |
|---|---|---|---|
| 2026-03-08 01:15 | America/New_York | 2026-03-08 06:15 | EST |
| 2026-03-08 03:00 | America/New_York | 2026-03-08 07:00 | EDT spring forward |
Try saying: “Once a year the local clock skips an hour, and once a year an hour repeats. If we chart by the local clock without care, that day is not comparable to a normal 24-hour day. We still report it, and we label it.” Then show one annotated chart, because people remember the picture. Daylight saving time (DST) is the name for this yearly clock shift.
How to practice this week
- Pick one dashboard you own. Write one sentence naming the clock for its main date axis, whether that is the UTC day, the store local day, or a fiscal period.
- Add or find columns for event time and load time. If you only have one timestamp, document which it is and what that means for late data.
- Build a 20-row toy table that crosses a daylight saving boundary. Group it by UTC day and by local day, then screenshot both results for your team channel.
- Ask finance where the official fiscal calendar lives. If it is a spreadsheet, import it as a mapping table and put an as-of date in the file name.
- Add one automated check that you will expand later. Count rows where the business date is empty after casting, or where the year falls outside 2000 to 2100.
If you want more context on where this fits, the Learn hub maps SQL, Python, spreadsheets, and foundations alongside this quality series.
Quick recap
- Date bugs are usually mismatched clocks, because event time, record time, and business day are different fields.
- Store UTC (or true instants), keep the zone name, and show local time at the edges.
- Fiscal calendars need a date dimension, and improvised filters in every chart do not work.
- Cast explicitly in SQL and Python, measure failed parses, and never let silent empty values pass as clean data.
- Label the day key on every shipped chart so that “yesterday” means one thing.
The next post turns these ideas into automated checks such as row counts, matching keys, freshness, and “yesterday versus last week” sanity tests you can run before anyone opens the dashboard. The one after that closes the series with a light scorecard, so others can trust the clock rules you just made explicit.
Series notes
This is Part 5 of Data quality for people who ship numbers. Related: Analytics foundations, From spreadsheets to real data.
Sources
Research and further reading used for this article:
- IANA Time Zone Database: https://www.iana.org/time-zones
- Python
zoneinfodocumentation: https://docs.python.org/3/library/zoneinfo.html - pandas date/time functionality: https://pandas.pydata.org/docs/user_guide/timeseries.html
- ISO 8601 overview (Wikipedia): https://en.wikipedia.org/wiki/ISO_8601
- Coordinated Universal Time (Wikipedia): https://en.wikipedia.org/wiki/Coordinated_Universal_Time
- Tinybird, timestamps and time zones in databases: https://www.tinybird.co/blog/database-timestamps-timezones
- Analytics Made Simple, Learn hub: https://analyticsmadesimple.com/learn/
- Analytics Made Simple, Analytics foundations: https://analyticsmadesimple.com/series/analytics-foundations/
- Analytics Made Simple, From spreadsheets to real data: https://analyticsmadesimple.com/series/spreadsheets-to-data/
- Analytics Made Simple, SQL series: https://analyticsmadesimple.com/series/sql/
- Analytics Made Simple, Python for analytics: https://analyticsmadesimple.com/series/python/
Keep going
Same lessons in your feed
Short diagrams, hooks, and weekly tutorials on Substack, Instagram, X, and Facebook.