

When your analysis is done, hand it over as a clean file with a short note about what one row means, not as a screenshot. Say you cleaned the data in Python, checked that each row means what you think, and even re-ran everything from scratch to prove the numbers hold. Then you emailed a screenshot of your table, and Finance rebuilt it by hand in a new spreadsheet. A sloppy handoff leaves the work unfinished.
This post picks up right after the post on building a simple cleaning pipeline (the chain of steps that turns raw data into clean data). Now you save the results so people and other tools can trust them. That means writing a clean CSV file (a plain spreadsheet-style text file), loading tables into a database, where people pull data with SQL (the standard language for asking a database for data), saving Parquet files, and writing a short note that answers questions about row meaning before they start.
Export is a product, not just a save
Example:
| destination | include | avoid |
|---|---|---|
| CSV | clean types | index junk col |
| Parquet | same + compression | mixed objects |
| SQL table | grain + owner note | silent truncate |
| Chart PNG | claim title | default Figure_1 |
Your notebook is for you. Your export is for strangers with calendars. They will open it in tools you do not control, sort it, join it, and paste it into slides. The file has to carry enough structure to survive that trip: stable headers, honest types, and no decorative totals row. It also needs a short explanation of the grain, meaning what one row of the file actually represents, plus any filters you applied.
This is the same handoff discipline as the spreadsheets series, From spreadsheets to real data, just with pandas writing the file instead of clicking Save As. The foundations habit still matters here too. If you can’t state the decision the file supports and who it covers, a prettier file won’t help, and the Analytics foundations series covers that groundwork.
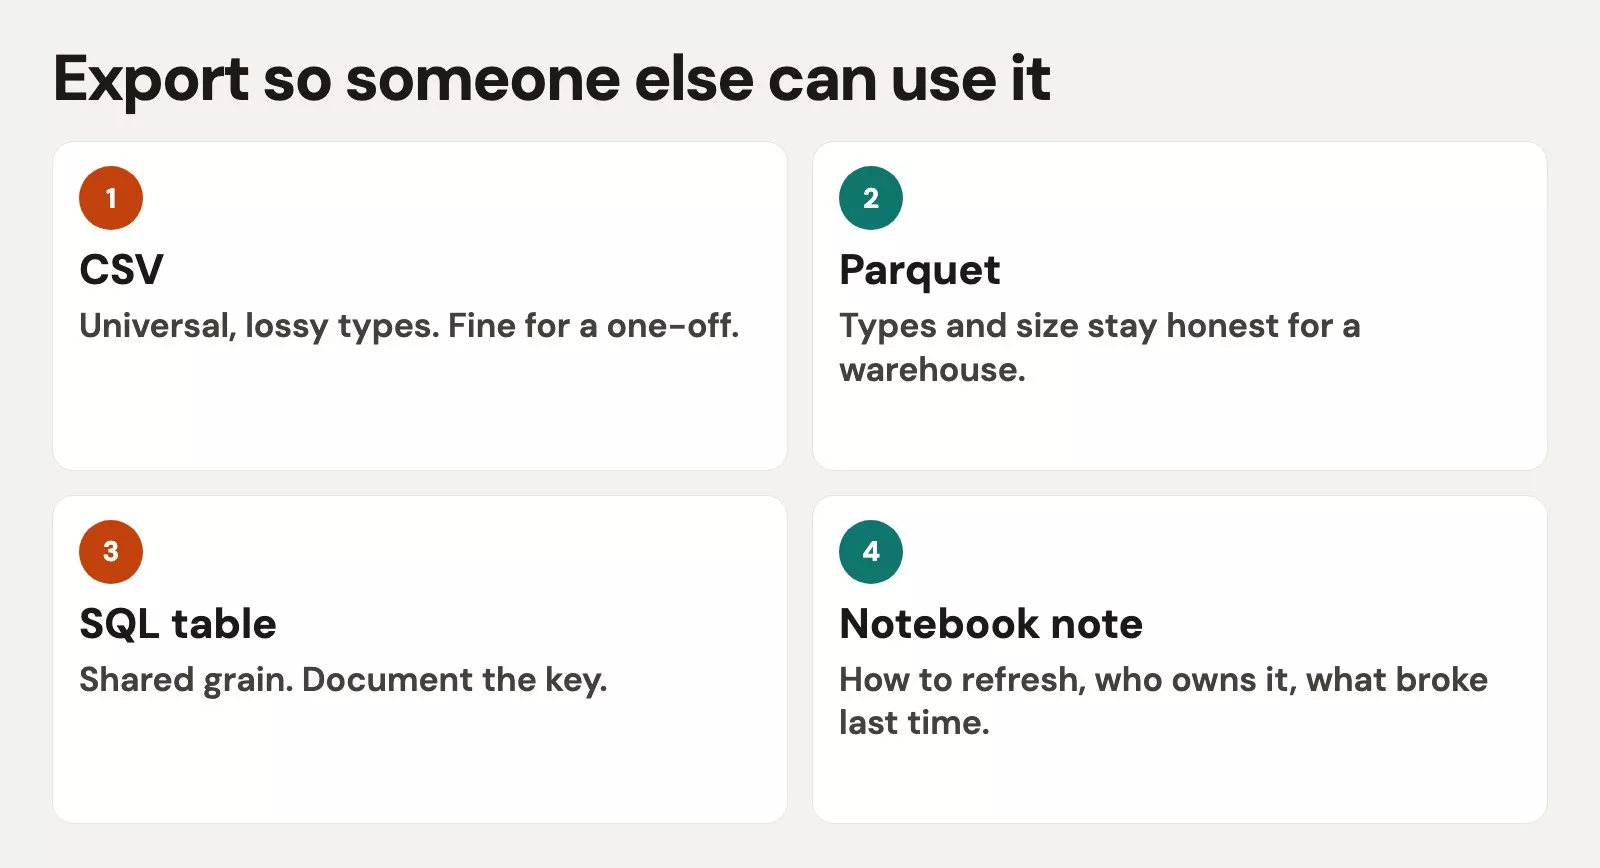
Three different readers will open this file. One is a person skimming numbers in Sheets, another is a business intelligence tool (BI, the software that updates dashboards) refreshing on a schedule, and the third is a future pipeline reading your output as its next input. A good export serves all three. It does that without you building three separate “special” files, because one well-described table usually does the job.
CSV: still the universal adapter
CSV is imperfect, but it’s everywhere. A partner can open it without installing anything from your stack. Use it on purpose, choosing each option deliberately instead of accepting whatever pandas assumes by default.
import json
from datetime import datetime, timezone
from pathlib import Path

import pandas as pd

# Assume clean_df came from your Part 8 pipeline
clean_df = pd.DataFrame(
    {
        "order_id": [101, 102, 103],
        "customer_id": ["1", "2", "2"],
        "order_date": pd.to_datetime(["2024-06-01", "2024-06-15", "2024-06-20"]),
        "amount": [40.0, 12.5, 30.0],
        "region": ["East", pd.NA, "West"],
    }
)

out_dir = Path("outputs")
out_dir.mkdir(exist_ok=True)

csv_path = out_dir / "orders_clean_2024-06-30.csv"

# Good defaults for analytics handoffs
clean_df.to_csv(
    csv_path,
    index=False,           # avoid a mystery index column
    encoding="utf-8",      # play nice across locales
    date_format="%Y-%m-%d",
    na_rep="",             # or "NULL" if your warehouse load prefers a token
)

print("wrote", csv_path, "rows", len(clean_df))
Example output:
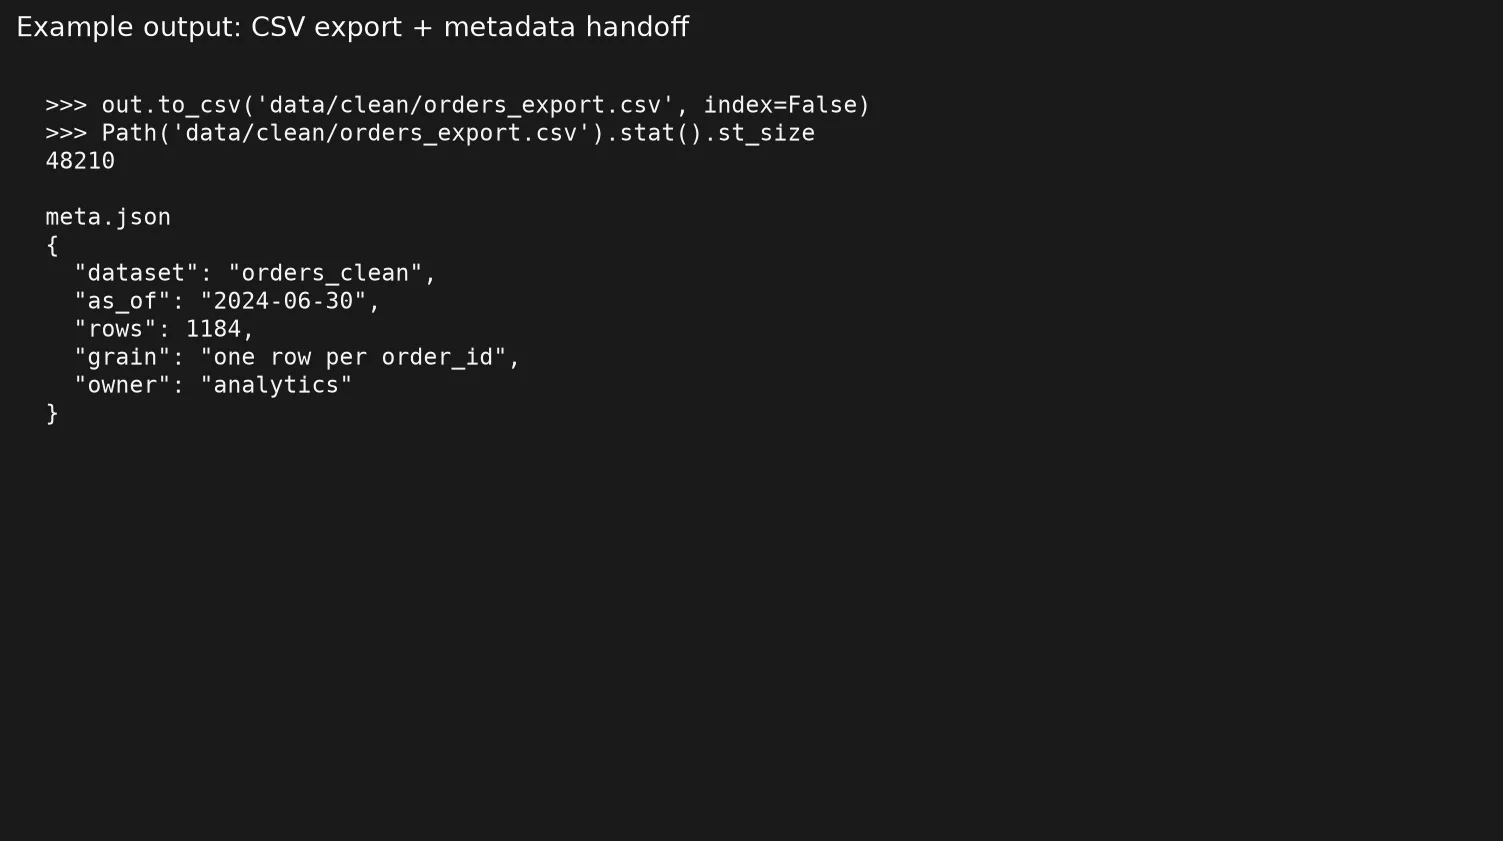
Each setting above earns its place:
index=Falsestops pandas from adding an extra, unnamed first column, the kind that breaks the next person’s assumptions about which column is which.- Saving the file as UTF-8 (UTF, the standard way computers encode text) keeps accented names and non-Latin scripts readable. Otherwise, special characters turn into garbled text, sometimes called mojibake.
- Writing dates in ISO order (ISO, a shared year-month-day format) means Excel and SQL loaders read them the same way, instead of guessing at month-first or day-first.
- Skip the totals row. Keep it out of the data file itself. Totals belong in a separate summary table, or in the BI tool where the viewer can see how they were calculated.
If a partner lives entirely in Excel and just wants to double-click and go, you can also write .xlsx with to_excel. Keep a CSV or Parquet as well whenever you can, because that’s the file a machine can trust. Excel formatting is a presentation layer, dressed up for reading, not a dependable copy of the underlying numbers.
Metadata beside the file
A clean CSV without any context turns into a rumor: everyone has an opinion about what a row means, and no one can check. Ship a small companion note next to the file. JSON (a plain-text format for structured data) is easy to generate automatically, and Markdown (plain text with simple marks for headings and lists) is easy for a person to read, so pick one format and stay consistent across your exports.
meta = {
    "dataset": "orders_clean",
    "as_of": "2024-06-30",
    "generated_at_utc": datetime.now(timezone.utc).isoformat(),
    "grain": "one row per order",
    "filters": [
        "dropped rows missing order_id, customer_id, order_date, or amount",
        "excluded spreadsheet total rows",
    ],
    "columns": {
        "order_id": "unique order identifier (string-safe)",
        "customer_id": "customer key as text to preserve leading zeros",
        "order_date": "order date, UTC calendar day, ISO format in CSV",
        "amount": "order amount in USD, null if unknown (not zero-filled)",
        "region": "sales region; null means unknown (not 'Other')",
    },
    "row_count": int(len(clean_df)),
    "source_pipeline": "run_pipeline() in analyze_orders.py",
    "contact": "analytics-team@example.com",
}

meta_path = out_dir / "orders_clean_2024-06-30.meta.json"
meta_path.write_text(json.dumps(meta, indent=2), encoding="utf-8")
print("wrote", meta_path)
That small file answers the questions a dashboard (a screen of charts that updates on its own) can’t: what one row means, what got excluded, when the numbers were pulled, and who to ask if something looks wrong. Paste a shortened version into the pull request, ticket, or Slack thread when you deliver the work. The person who reopens this file in six months is also someone you’re delivering to, and that person is often you.
Parquet in plain language
Parquet is a binary file format built for analytics work, arranged by column instead of by row. It keeps each column’s data type much more faithfully than CSV does, whether a field is text, a whole number, or a decimal. It also compresses well and plays nicely with tools like DuckDB, Spark, and cloud data warehouses. For files that stay inside a data team, Parquet often beats CSV.
# Requires pyarrow or fastparquet installed in the environment
parquet_path = out_dir / "orders_clean_2024-06-30.parquet"
clean_df.to_parquet(parquet_path, index=False)
print("wrote", parquet_path)

# Round-trip check
back = pd.read_parquet(parquet_path)
print(back.dtypes)
This saves the cleaned table as a Parquet file, a compact format that keeps each column’s type, and then reads it back and prints the column types. The read-back is a quick check that dates and numbers survived the trip.
If the person on the other end is non-technical and only has Excel open, CSV still wins for that final step. Plenty of teams keep Parquet for machines and CSV for people, and that isn’t wasted effort as long as each file has a clear job.
to_sql conceptually
pandas can also write straight to a database through SQLAlchemy or a similar library, using DataFrame.to_sql. Underneath, you are really doing three things. First, you name the table clearly. Second, you decide whether to replace or append rows. Third, you ensure data types land properly in the database.
# Conceptual pattern (needs a real SQLAlchemy engine and network access)
# from sqlalchemy import create_engine
# engine = create_engine("postgresql+psycopg2://user:pass@host:5432/analytics")
#
# clean_df.to_sql(
#     name="orders_clean",
#     con=engine,
#     if_exists="replace",  # or "append" for incremental loads
#     index=False,
#     method="multi",
#     chunksize=1000,
# )

print("Prefer staging tables + warehouse tests over silent replace in production.")
In production analytics, running to_sql(..., if_exists="replace") straight against a shared table is risky, because it can silently wipe out a table other people depend on. Write to a staging table first, run row-count and null checks, then swap it in, or use your team’s existing load tool instead. The plain pandas call is fine for your own sandbox and early prototypes, but a shared warehouse table deserves an agreed process, not a surprise drop.
If you are already comfortable with SQL, push heavy filtering upstream into the database. Treat your Python exports as curated products rather than a second, ungoverned warehouse. The SQL series covers the query (a written request for data) side of that partnership.
Handoff notes for BI
Example:
Dashboard tools such as Looker, Power BI, Tableau, and Metabase all reward the same boring, well-behaved kind of table:
- Use one header row with stable, snake_case-style labels, and never merge cells.
- Keep one grain per table, so you’re not mixing daily rows and monthly rows in the same file.
- Make the categories and numbers clear enough that nobody has to build a calculated field just to reinvent a metric you already defined.
- Leave a null as a null instead of encoding a missing value as zero, unless the metric’s own definition says zero.
- State when the numbers were pulled and how often they refresh, for example “daily by 9:00 local time” or “updated manually after the pipeline runs.”.
If you deliver both a detail table and a summary table, name them so nobody unions the two by mistake. orders_clean and orders_by_region tells the reader more than final and final2 ever could.
Destination by what to include
| Destination | Primary artifact | Must include | Usually skip |
|---|---|---|---|
| Email to a human | CSV or XLSX + short note | Grain, as-of, filters, owner | Full code dump |
| Shared Drive folder | Versioned CSV/Parquet + meta.json | Stable filename pattern, row count | Ad-hoc “final_final” names |
| BI import | Tidy table, one grain | Clean headers, typed dates, no totals rows | Pivot-shaped presentation tables |
| Warehouse table | Staging load + tests | Schema, uniqueness, null rules | Silent replace on prod tables |
| Next Python job | Parquet preferred | Preserved dtypes, partition if large | Screenshots |
| Slide deck | Chart + one sentence grain | Caveats that change the decision | Raw dumps as tiny unreadable tables |
A short note that travels with the file
A one-paragraph readme note is enough for many teams:
Example handoff blurb: orders_clean_2024-06-30.csv is one row per order, as of 2024-06-30. It was built by run_pipeline() from data/orders_raw.csv, and it already dropped incomplete rows and spreadsheet totals. Amounts are in US dollars; a null amount means unknown, not zero, and a null region also means unknown. Contact analytics-team to regenerate it.
If legal or security rules apply, for example customer emails or health data, write the redaction rules into that same note. Handing off a file is a privacy moment as much as a formatting one.
Filename and version habits that save weekends
Pick one filename pattern and stick to it, even under deadline pressure. That crunch time is exactly when people improvise and regret it later. A simple scheme works fine:
# dataset_asof_status.ext
# orders_clean_2024-06-30.csv
# orders_clean_2024-06-30.meta.json
# orders_by_region_2024-06-30.csv
Put the as-of date in the filename itself, not only in a cell inside the file, because people forward files around without opening them first. Avoid final, latest, and USE_THIS in the base name; none of them tell the next person anything useful. If a BI tool needs a fixed “latest” filename because it can’t handle dates in a path, keep the dated file as your archive copy, and point a controlled step in your pipeline at orders_clean_latest.csv instead of hand-renaming things yourself.
When legal holds or audits matter, store the commit hash or script version that generated the file inside the metadata file. You don’t need a full data catalog on day one. You need just enough of a trail that next quarter’s version of you can regenerate the file, or defend the number in a meeting.
Common mistakes
These repeat often.
- Leaving the pandas index in the CSV, so every reload adds a mystery extra column.
- Writing IDs as floating-point numbers, which destroys leading zeros or exact precision.
- Using locale-dependent dates that quietly swap month and day depending on where the file is opened.
- Putting filters only in a chart title instead of in the data and the metadata note.
- Overwriting the same filename with no as-of date, so nobody can reconstruct what last week’s numbers looked like.
- Shipping only a pivoted “report shape” table, which looks nice but is painful for anyone to join or reuse later.
Practice this before you call the handoff done
Take the clean data frame from the pipeline you already built. Export it to CSV with the options above, write a meta.json file next to it, and send both to a teammate, or to yourself on another machine. Ask that person to state the grain without asking you what it means. If they can’t, the handoff failed even if every byte in the file is perfect.
Quick recap
- An export is a product: stable headers, honest nulls, ISO dates, and no decorative totals row.
- Use CSV for people, Parquet when you want data types to survive the trip, and load to SQL carefully.
- Ship a metadata note with the grain, the as-of date, the filters applied, the row count, and an owner to contact.
- Match the file’s shape to its final destination. BI tools want a tidy table, while a slide deck wants a chart plus key caveats.
- Version your filenames, and keep the pipeline around that can regenerate them.
Your next step
Take the next file you are about to send someone and run it through the checklist in this post: stable headers, ISO dates (year-month-day, like 2026-10-04), no totals row, and a short metadata note with the grain, as-of date, filters, row count, and owner. Sending one file that way shows your team the standard faster than any style guide.
Series notes
This is Part 9 of the Python for analytics series. The earlier post built a light cleaning pipeline. The next one puts Python and SQL in the same workflow, covering when each wins and how to review generated code with healthy skepticism. Related reading: From spreadsheets to real data for the same handoff habits in a spreadsheet setting, and the SQL series for the query side of this partnership. Keep exploring paths on the Learn hub.
Sources
- pandas
DataFrame.to_csv: https://pandas.pydata.org/docs/reference/api/pandas.DataFrame.to_csv.html - pandas
DataFrame.to_parquet: https://pandas.pydata.org/docs/reference/api/pandas.DataFrame.to_parquet.html - pandas
DataFrame.to_sql: https://pandas.pydata.org/docs/reference/api/pandas.DataFrame.to_sql.html - Apache Parquet overview: https://parquet.apache.org/docs/overview/
- Python
jsonmodule: https://docs.python.org/3/library/json.html - Analytics Made Simple, Learn hub: https://analyticsmadesimple.com/learn/
Keep going
Same lessons in your feed
Short diagrams, hooks, and weekly tutorials on Substack, Instagram, X, and Facebook.



