
Say you merged two tables and the result looked perfect. Then you sorted by date and half the column refused to sort, and the revenue total stopped working the moment one blank cell turned the whole column into text. Someone had filled missing regions with the word Unknown, someone else had left them blank, and a third export used -999 because an old system could not store empty values. This is the trouble with missing data and column types (called dtypes in Python), and it quietly ruins a lot of simple analysis.
The earlier post in this Python for analytics series showed how to merge tables. Now you will make those tables honest about empty values and column types, so that filters, group totals, and exports stop giving wrong answers politely.
Why missing values need a plan
Missing is a fact, not a personal failure
Real business data is incomplete. Forms skip fields, APIs leave out keys, and spreadsheets store “N/A” as plain text. If you delete every null as if it were a bug, you will bias every rate you calculate, and if you treat every null as zero, you will invent revenue and attendance that never existed. The mature move is to name the missingness, measure how much there is, and choose a policy that fits the decision you are making.
This matches the spirit of good-enough data in the analytics foundations series, where perfect completeness is not the goal and documented handling is. Your habits from moving from spreadsheets to real data still apply here. Cells that look blank may hold a space, and Excel dates may arrive as plain numbers. Python will not read your mind, so it reads exactly what is stored in the file.
What “null” looks like in pandas
In modern pandas you will mostly see NaN (not a number) for missing decimals, NaT (not a time) for missing datetimes, and sometimes <NA> for pandas’ nullable types. For everyday analytics, four practical rules cover most cases:
pd.isna(x)is true for values you should treat as missing.- An empty string
""is not automatically NaN, so it slips past missing-value checks. - The text
"None"or"null"is also not NaN unless you map it yourself. - Numeric placeholders like
-999are real numbers until you replace them.
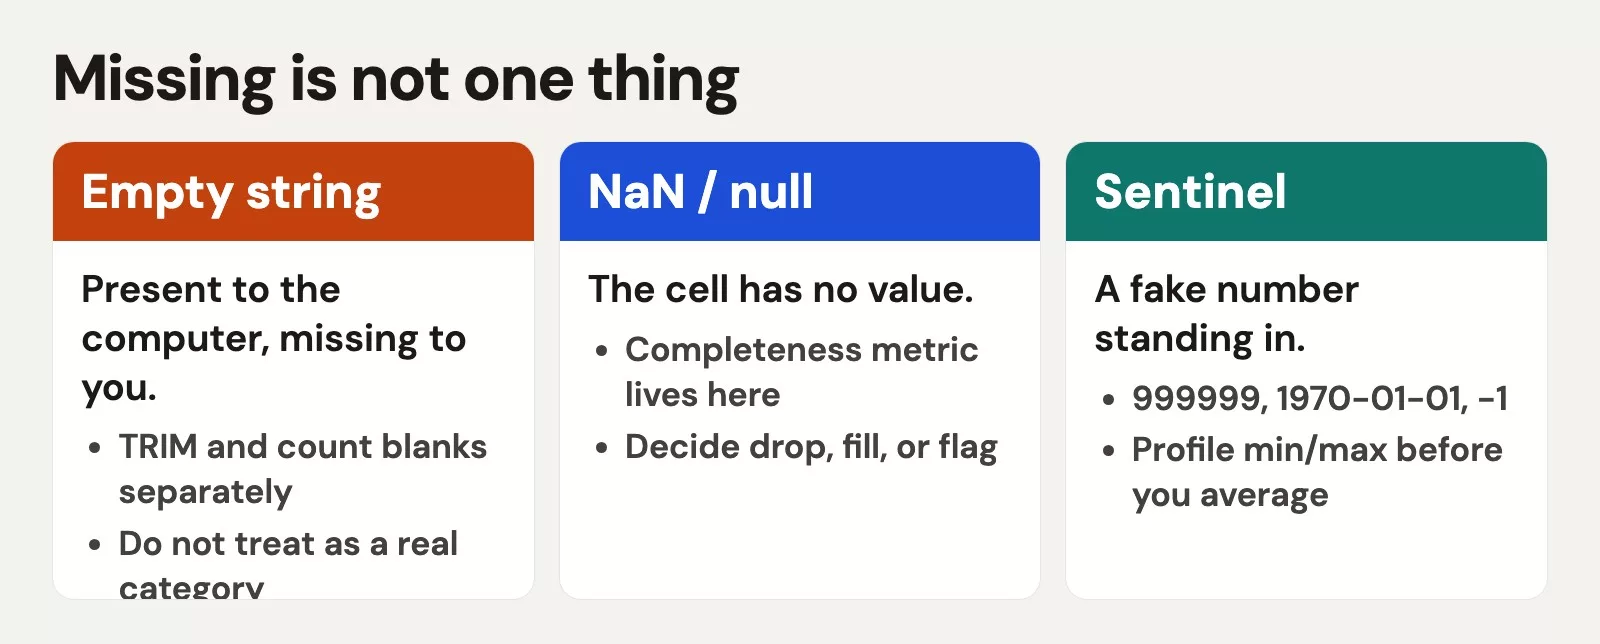
Think of four kinds of missing data arriving from the wild: true nulls, empty strings, labeled placeholders such as "Unknown", and numeric placeholders (sometimes called sentinels). Your job is to convert every one that means “no value” into a single, consistent missing marker before you model or plot anything.
Profile before you “fix”
Never start with dropna() as a reflex, because you cannot judge the damage until you count it. Start by counting.
import pandas as pd
import numpy as np

df = pd.DataFrame(
    {
        "customer_id": [1, 2, 3, 4, 5],
        "email": ["a@x.com", "", "c@x.com", None, "e@x.com"],
        "region": ["East", "West", "Unknown", "East", None],
        "amount": ["40.5", "12", "n/a", "30", "-999"],
        "signup_date": ["2024-01-03", "2024/02/10", "", "not a date", "2024-05-01"],
    }
)

print(df.isna().sum())
print((df == "").sum())
print(df.dtypes)
Example output:
You will often see email and signup_date stored as object columns, which means pandas treats them as plain text. Missingness is split between None or NaN and "", and the amount column is text because of the "n/a" entry. If you cast carelessly, you either lose rows or invent zeros, so profiling first keeps you honest.
Empty string versus NaN
Filters behave differently for each kind of missing value. The filter df[df["email"].isna()] will not catch "", and grouping by region treats "Unknown" as a real category while treating NaN as missing, which is often left out of the groups depending on settings. The fix is to standardize early:
# Strip whitespace, then turn pure blanks into true missing
df["email"] = df["email"].replace(r"^\s*$", pd.NA, regex=True)

# Map explicit placeholders used by your systems
df["region"] = df["region"].replace(
    {
        "Unknown": pd.NA,
        "N/A": pd.NA,
        "n/a": pd.NA,
        "null": pd.NA,
    }
)

print(df[["email", "region"]])
print(df[["email", "region"]].isna().sum())
Write down the placeholder list for your company. Marketing might use "TBD", and finance might use "#N/A" from spreadsheet exports. One shared cleaning function beats five notebooks with five different opinions.
Three ways to handle a null: leave it, fill it, or drop it
There are three legitimate policies, and each fits a different situation.
- Leave it null for optional details such as a middle name or a second phone number, since it is the best default there. Charts and rates should then say how many values are known versus unknown.
- Fill it only when the business rule is clear, for example when a missing discount really means 0 or a missing yes/no flag means False after the product team confirms it.
- Drop the rows or columns when the field is required for the question (you cannot compute a conversion rate without a signup timestamp) and the share of misses is small enough that it will not bias the answer.
# Example policies (illustrative, not universal laws)
df["discount_rate"] = df.get("discount_rate", 0)  # if column exists elsewhere
# Prefer explicit fill after you create/clean the column:
# df["discount_rate"] = df["discount_rate"].fillna(0)

# Drop rows only when the analysis requires the field
need_email = df.dropna(subset=["email"])
print("kept", len(need_email), "of", len(df))

# Drop a column that is 95% empty and unused in the question
# df = df.drop(columns=["legacy_field"])
Always record how many rows you drop. “I cleaned the file” is not a method, but “dropped 12 of 10,400 rows missing signup_date (0.12%)” is one. If you drop 30% of rows because dates failed to parse, you do not have a cleaning step, you have a data quality incident.
Cast numbers safely
astype(float) is a blunt tool, because one bad value makes the whole cast fail. A better choice is pd.to_numeric with errors="coerce", which turns any value it cannot read into NaN so you can count them.
df["amount_raw"] = df["amount"]

df["amount"] = pd.to_numeric(df["amount"], errors="coerce")

# Legacy sentinel: -999 means missing, not a refund of nine hundred ninety-nine
df.loc[df["amount"] == -999, "amount"] = pd.NA

bad_amount = df["amount"].isna().sum()
print("amount nulls after cast", bad_amount)
print(df[["amount_raw", "amount"]])
Example:
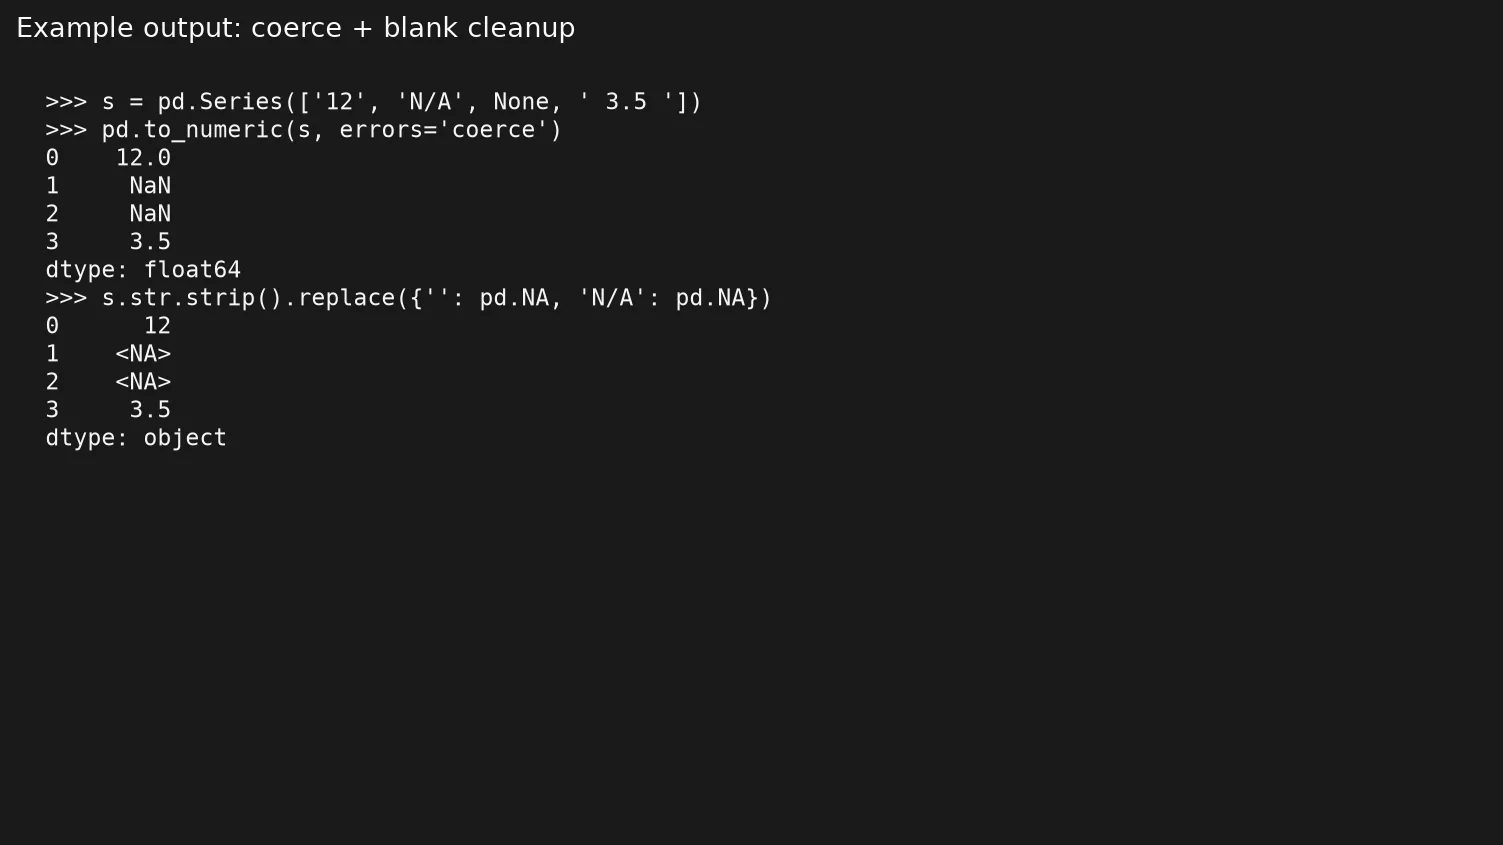
errors="coerce" is not free, because it also turns typos into nulls. That is usually what you want for analytics as long as you inspect the null pile afterward. For strict pipelines where a bad value should stop the job, use errors="raise" in your validation environment instead.
Cast dates safely
Dates are the other classic trap. Mixed formats, blank strings, and words like "pending" often show up in the same column. Use pd.to_datetime with coercion, then measure the damage.
df["signup_date"] = pd.to_datetime(
    df["signup_date"],
    errors="coerce",
    format="mixed",  # pandas 2.x helper for mixed ISO-ish inputs
)

print(df["signup_date"])
print("unparsed dates", df["signup_date"].isna().sum())
Example:
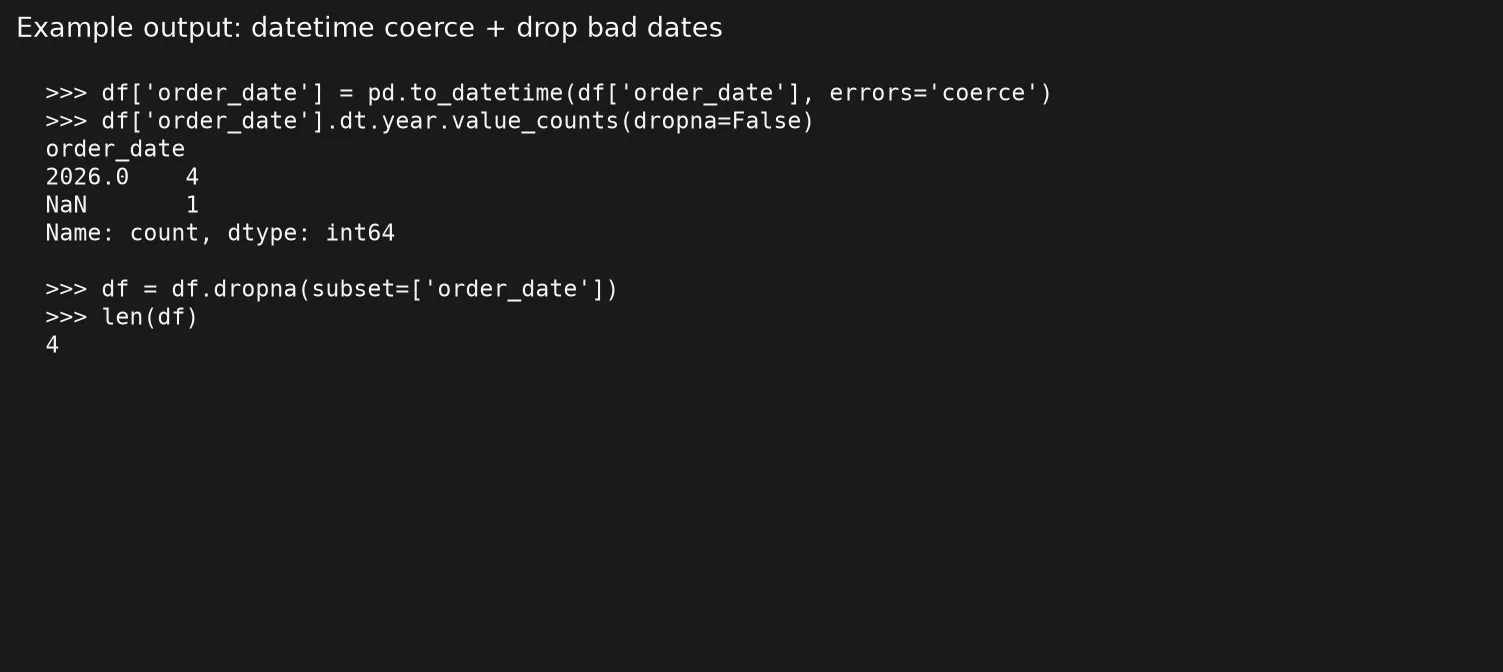
If your pandas version is older and format="mixed" is unavailable, parse without a format, still use errors="coerce", and spot-check the result. When you later export for a warehouse, agree on a timezone policy with your team, or at least use ISO dates (year-month-day) when the time of day does not matter.
Do not use astype("datetime64[ns]") on dirty strings as your first move. Get to a datetime through to_datetime first, and if you then need a specific type, cast the clean result.
Worked mini cleanup
Now put the pieces together on the small example table so you can see one full pass from top to bottom.
def clean_customers(df: pd.DataFrame) -> pd.DataFrame:
    out = df.copy()

    # 1) Normalize text nulls
    for col in ["email", "region"]:
        out[col] = out[col].replace(r"^\s*$", pd.NA, regex=True)
    out["region"] = out["region"].replace({"Unknown": pd.NA, "N/A": pd.NA})

    # 2) Numbers
    out["amount"] = pd.to_numeric(out["amount"], errors="coerce")
    out.loc[out["amount"] == -999, "amount"] = pd.NA

    # 3) Dates
    out["signup_date"] = pd.to_datetime(out["signup_date"], errors="coerce", format="mixed")

    # 4) Report
    report = {
        "rows": len(out),
        "email_nulls": int(out["email"].isna().sum()),
        "region_nulls": int(out["region"].isna().sum()),
        "amount_nulls": int(out["amount"].isna().sum()),
        "signup_nulls": int(out["signup_date"].isna().sum()),
        "dtypes": out.dtypes.astype(str).to_dict(),
    }
    print(report)
    return out

clean = clean_customers(df)
print(clean)
Notice that the function returns a new table and prints a small report. That habit prepares you for the next post, which chains cleaning steps into a pipeline, and it means every step leaves a visible check instead of a mystery cell.
Symptom to fix
| Symptom | Likely cause | Fix to try |
|---|---|---|
| Sum fails or concatenation happens | Numbers stored as text | pd.to_numeric(..., errors="coerce") |
| Sort order looks alphabetical for dates | Dates still strings | pd.to_datetime(..., errors="coerce") |
| Filter for missing misses blanks | Empty string vs NaN | Replace "" with pd.NA |
| Join matches nobody | dtype mismatch on key (int vs str) | Cast both keys the same way |
| Mean looks impossibly low | Sentinel like -999 included | Map sentinel to NA before agg |
| Groupby grows an “nan” bucket of strings | Literal "nan" text | Replace string placeholders |
| Half the rows vanish after dropna | Over-broad drop | subset=[...] only required columns |
When a blank discount was not a zero discount
Imagine your operations team exports weekly orders. The discount column is blank for most rows, because the point-of-sale system only writes a value when a promotion fires. If you fill those blanks with 0 and compute the average discount rate, you might report “almost no discounting this quarter,” and leadership might freeze a campaign on that basis. Two days later someone discovers that blank also meant “the promo engine was offline for half the stores,” not “full price.” The fill was mathematically tidy and economically wrong.
The better path is to use three statuses in the handoff note: known zero discount, known positive discount, and unknown. Unknown stays null, and rates are computed only on the known rows, with a coverage percentage printed next to the number, for example “average discount 4.2% on the 61% of orders where discount status is known; 39% unknown due to store sync gaps.” That sentence is longer than a single number, and it is also honest enough to keep a campaign alive.
Use the same discipline for dates. A null ship date does not mean “shipped on day zero,” and a null churn date does not mean “still active” unless your product definition says so. Write the business meaning of a null in one line before you fill, drop, or plot anything.
Common mistakes
- Filling with zero by default. Zero is a real number, and a missing value is not a sale of zero dollars unless the business says so.
- Dropping first and asking questions never. Measure the miss rate and check whether the misses cluster in one segment or channel.
- Using
astypeon dirty columns. Prefer the coerce-and-count pattern for messy inbound data. - Silently coercing and ignoring the null pile. Coercion without a report hides bad source data.
- Comparing with
== None. Useisna()for missing-value tests in pandas. - Forgetting that yes/no columns may arrive as
"true"/"false"text. Map them deliberately beforeastype("boolean").
Practice and next step
Export a small CSV file from a tool you use every week and profile its nulls, blanks, and column types. Then write a ten-line cleaning function that does only three things: normalize blanks, coerce one numeric column, and coerce one date column. Print a before-and-after null report, and you will have enough practice for the next step to feel natural.
The next post in the series chains these steps into a light cleaning pipeline you can rerun from top to bottom. If you prefer to think in SQL for quality checks, the SQL series pairs well with the same “profile, then fix” habit, and you can browse more paths on the Learn hub.
Quick recap
- Empty strings, placeholders, numeric sentinels, and true nulls are different things, so unify them on purpose.
- Profile with
isna, blank counts, anddtypesbefore you fill or drop anything. - Use
to_numericandto_datetimewitherrors="coerce", then measure what became null. - Fill only when a business rule says so, and when you drop, name the columns and report how many rows you lost.
- Clean column types early so the merges and group totals later in this series behave.
Sources
- pandas working with missing data: https://pandas.pydata.org/docs/user_guide/missing_data.html
- pandas
to_numeric: https://pandas.pydata.org/docs/reference/api/pandas.to_numeric.html - pandas
to_datetime: https://pandas.pydata.org/docs/reference/api/pandas.to_datetime.html - Python docs, built-in types overview: https://docs.python.org/3/library/stdtypes.html
- Analytics Made Simple, Learn hub: https://analyticsmadesimple.com/learn/
Keep going
Same lessons in your feed
Short diagrams, hooks, and weekly tutorials on Substack, Instagram, X, and Facebook.



