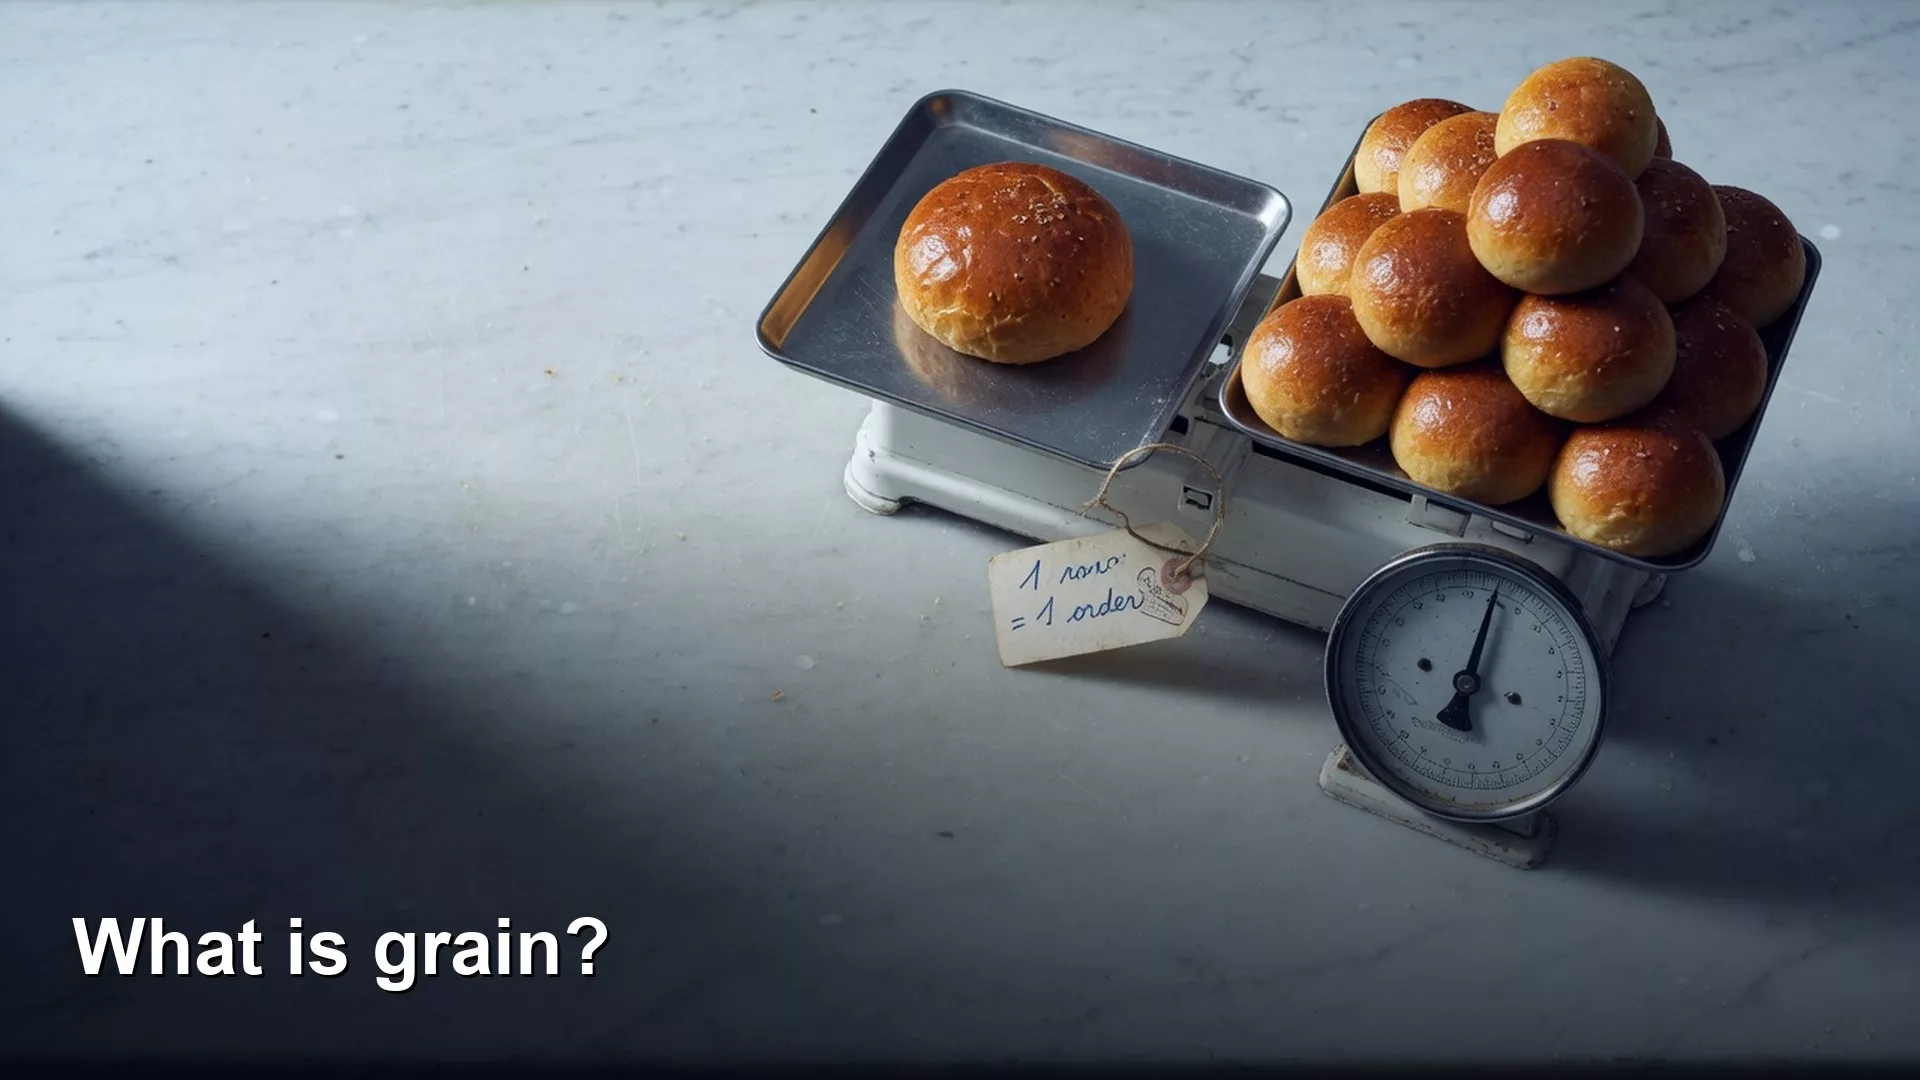
Before you add up or combine any data, check what one row in each table stands for: one order, one customer, or one customer per month. That is the table’s grain. Most arguments about “the real number” come from two tables with different grains.
Imagine your boss asks for monthly revenue by customer. You combine the orders list with the customer list, add up the amounts, and send a chart. Finance sends a different number, and Marketing sends a third. Nobody is lying. Each of you counted a different thing per row.
This guide is for anyone who inherits a report and has to trust its numbers. For related habits, see the Metrics series and the Data quality series.
What is grain in data?
Grain in data refers to the exact level of detail and business meaning represented by a single row in a table or dataset. Put simply, grain answers the question: “What does exactly one row mean?” It defines three key elements: the real-world event or entity represented, the timeframe of the row, and the uniqueness constraints that keep it distinct.
Ralph Kimball’s dimensional modeling tradition, a classic way of designing analytics tables, treats declaring the grain as the first design step. You decide the grain of the fact table before you pile on dimensions, which are the descriptive columns such as customer or region. You do not need a full Kimball warehouse to use the idea, but you do need the discipline. An “order line fact” and a “daily store sales fact” are different contracts, and mixing them in one mental model is how double counting is born.
Rule of thumb: If you cannot finish “one row means…,” stop modeling. Fix the sentence before you fix the chart colors.
People also say “level of detail,” “row meaning,” or “unit of analysis,” and those phrases overlap. Grain is useful because it forces you to be specific. You say “one row per customer per calendar day, with activity flags as of midnight UTC” (Coordinated Universal Time, a standard world time zone) and not just “customer data.”
What grain is not
A few near-neighbors get confused with grain, and separating them saves meetings.
Not the same as a primary key
A primary key, or unique key, is a technical rule that no two rows share the same identifier. Grain is the business story that makes that rule true. You can have a generated ID on every row and still have unclear grain if the business cannot say what the row represents. Keys put grain into practice, and they do not invent it.
Not the same as a filter
Filtering to “completed orders only” changes which rows you keep. It does not change the grain if each remaining row is still one completed order. People say “we filtered to a different grain” when they really mean “we aggregated.” Be precise, because filters take a subset and aggregates change the grain.
Not the same as a metric definition
Revenue can be defined as the sum of line amounts excluding tax, booked on the ship date. That formula sits on top of a grain. The same formula at order-header grain and at order-line grain can still disagree if discounts live only on lines or only on headers. Metric cards should state both the formula and the grain. The metrics series has ownership templates that force this pairing.
How to see grain in a diagram
Think of raw events flowing into tables and then into totals, where each step should name what a row means. When two tables meet in a join, you either keep the grain, expand it (which people call a fan-out, because one row splits into many), or collapse it by adding rows up first and joining afterward.
The diagram is a map and not decoration. When someone says “just join customers,” point at the fan-out path, because one customer with many orders multiplies rows if you thought you were still at customer grain. When someone says “monthly revenue,” point at the aggregation path, because you left order grain on purpose.
Common grains you will meet at work
These show up in almost every commerce or subscription analytics setup, so feel free to steal the wording for your own documents.
| Grain name | One row means… | Typical unique keys | Danger if wrong |
|---|---|---|---|
| Order header | One customer order (checkout) | order_id | Summing header amounts after splitting into lines double counts |
| Order line | One product line on an order | order_id + line_id | Counting “orders” as distinct lines overstates volume |
| Shipment | One physical shipment | shipment_id | Revenue by ship date vs order date fights Finance |
| Daily customer | One customer on one calendar day | customer_id + date | Joining multiple daily facts without care multiplies days |
| Monthly account | One account for one calendar month | account_id + month | Prorating mid-month changes without rules invents annual recurring revenue |
| Event | One logged action (click, login) | event_id or composite timestamp keys | Treating events as users inflates “active users” |
Notice that time is part of grain. “Customer” alone is incomplete, because the current customer, a monthly customer snapshot, and customer lifetime profile are three different grains. Snapshot tables that quietly change historical rows, with no record of what they used to say, are grain problems that look like version-control problems.
How grain breaks in SQL
Fan-out joins
You start with orders, which have one row per order, and join to order lines, which have many lines per order. If you then SUM(order.total) without adding up the lines first or using a careful pattern, the order total repeats once per line. Three lines means triple revenue. The database did exactly what you asked, and the business did not.
Silent many-to-many
Tags, categories, campaigns, and multi-touch attribution tables often attach many labels to one entity. If you join campaign tags to orders without a plan for the link between them, the rows multiply. Dashboards that “add a campaign breakdown” then suddenly change the grand total. That is not a bug in the business intelligence tool. It is a change in grain that nobody agreed to.
Aggregate then join, or join then aggregate
The order of operations is a grain decision. If you need order-level revenue and customer attributes, add the lines up to orders first and then join customers. If you need the product mix by line, stay at line grain and never sum header fields that do not add across lines. Write the target grain at the top of the query (a question you send to a database) as a comment, and future you will thank past you.
Time windows that change the unit
“Active in the last 30 days” is not a column in a static customer table until you define what the output is. It might be one row per customer with a flag, or one row per customer per day. Rolling windows computed from events and then treated as customer grain, without a distinct count, invent active users. Always name the output grain of a windowed metric.
Worked example: three revenues from one shop
Here is toy data from a small shop with two orders. Order 1001 has two lines, and order 1002 has one line. To keep things simple, the header totals already include the line sums.
| order_id | customer_id | order_total |
|---|---|---|
| 1001 | C7 | 80 |
| 1002 | C7 | 20 |
| order_id | line_id | sku | line_amount |
|---|---|---|---|
| 1001 | 1 | MUG | 30 |
| 1001 | 2 | TEA | 50 |
| 1002 | 1 | MUG | 20 |
Correct order-level revenue for customer C7 is 100, and correct line-level product revenue for the mug is 50. Here is the classic mistake, which is to join headers to lines and then sum the header total.
SELECT
  o.customer_id,
  SUM(o.order_total) AS wrong_revenue
FROM orders o
JOIN order_lines l
  ON o.order_id = l.order_id
GROUP BY o.customer_id;
For C7, order 1001 appears twice because it has two lines, so 80 is counted twice, plus 20 once, for a “revenue” of 180. The shop did not earn 180. The join changed the grain under the sum.
These safer patterns work, and you should pick one and stick to it:
-- Stay at order grain: no line join needed for total revenue
SELECT
  customer_id,
  SUM(order_total) AS revenue
FROM orders
GROUP BY customer_id;

-- Or: build revenue from lines only (line grain, additive amounts)
SELECT
  o.customer_id,
  SUM(l.line_amount) AS revenue
FROM orders o
JOIN order_lines l
  ON o.order_id = l.order_id
GROUP BY o.customer_id;
Both correct paths return 100 for C7. They agree because the line amounts sum to the header totals in this toy set. In real systems, discounts, tax, shipping, and partial refunds break that equality. Then you must declare which grain and which amount column is the source of truth for “revenue.”
Use the result card as a teaching prop in reviews. If a pull request (a proposed code change) alters the grain, require a one-line note such as “Before: one row per order. After: one row per order line. Totals rechecked against Finance seed.”
Documenting grain so it survives team chat
Grain dies in oral tradition, so write it down where the table lives. Five things belong in that note:
- One-row sentence at the top of the model’s documentation page or dbt description (dbt is a tool that builds and tests warehouse tables)
- Unique key columns listed and tested, meaning unique and not empty wherever you claim they are
- Time basis: event time versus load time, the time zone, and the policy for late-arriving events
- Additive notes: which measures may be summed across which dimensions
- Known fan-out risks: tables you must not join without adding up first
If you use data contracts or schema tests, encode uniqueness that matches the grain sentence. A schema is the layout of the data: which tables exist and what each column holds. A test that passes while the sentence is vague only proves the computer agrees with itself. It does not prove agreement with the business.
Grain across dashboards, machine learning, and exports
Business intelligence tools often let users drill down and blend data, which is useful and dangerous. A dataset published at order-line grain will let someone sum “order total” as a measure if you expose that column. Hide fields that do not add up, or mark them clearly. Export jobs for finance often need header grain even when product analytics lives at line grain, so do not force one table to serve both without views that declare different grains.
Machine learning inputs have grain too, with one row per user at prediction time or one row per user per day in training. Training labels at a different grain than the inputs are a silent accuracy killer. Feature stores formalize this, but the concept is still grain, and the next Key Term in this batch covers feature stores directly.
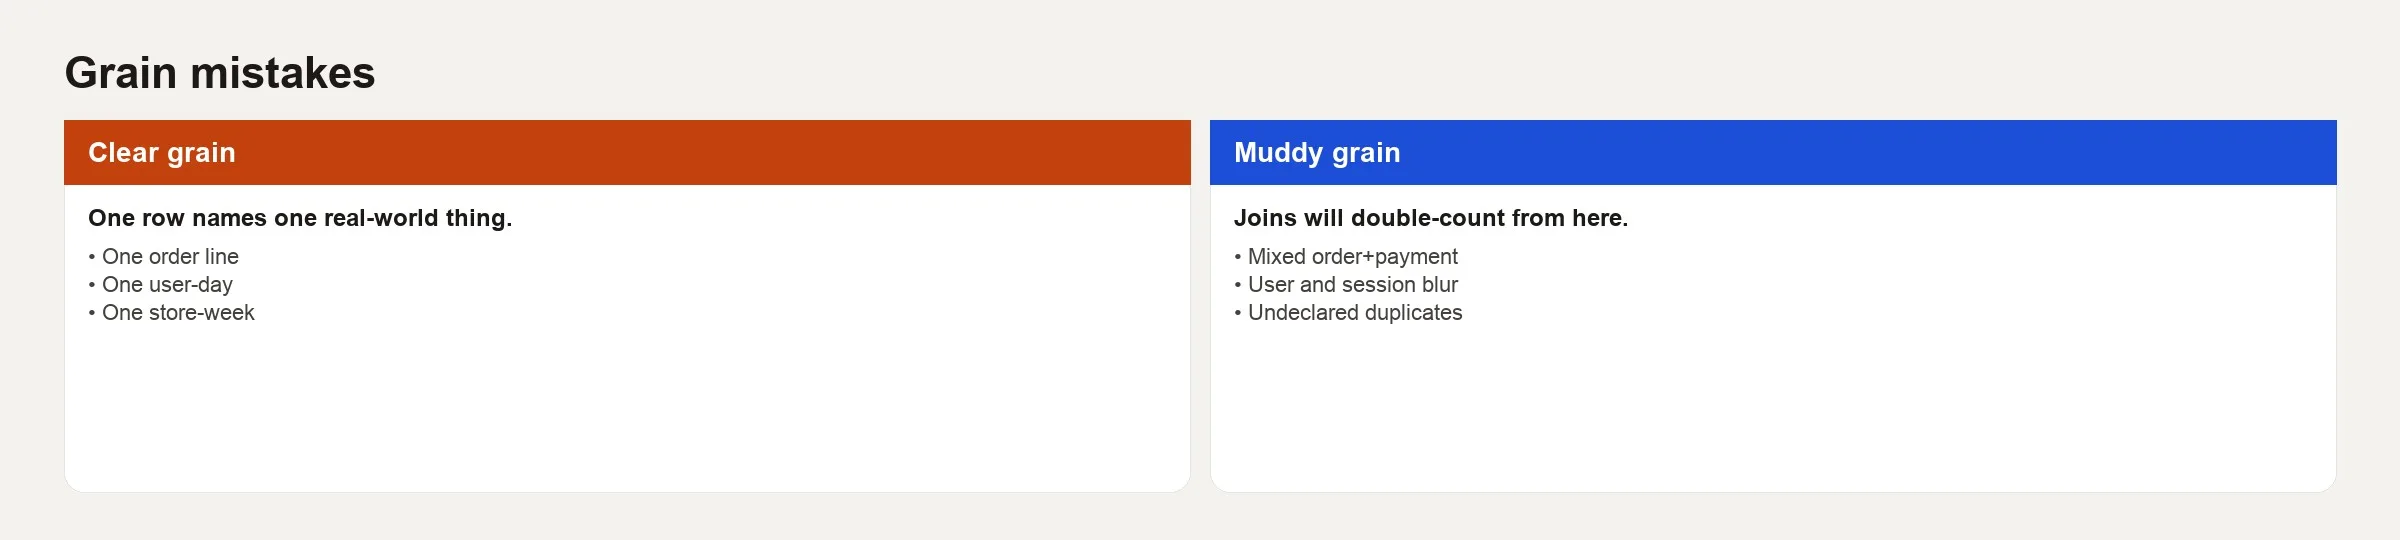
Common mistakes
- Calling everything “customer level.” Say customer, customer per day, or customer per month.
- Joining for one column and forgetting the multiplicity. Pull in attributes with a many-to-one join only after you know the relationship.
- Summing measures that do not add up, such as ratios, distinct counts stored as columns, and already-averaged scores.
- Changing grain in a dashboard (one screen of charts) calculation without changing the title or the certified metric name.
- Using AI-generated SQL (the language for asking a database questions) without checking row multiplication. Always inspect counts before and after joins. See how to check AI-written SQL.
- Documenting columns but not the row. A perfect data dictionary with no grain sentence still fails at onboarding.
How to practice
- Pick one production table you use weekly and write its one-row sentence on a sticky note. If you need three sentences, you probably have mixed grain or a view that hides a union of tables.
- Run
COUNT(*)andCOUNT(DISTINCT key)for the claimed unique key. If they differ, your grain claim is already broken. - Reproduce the toy fan-out on your own order, ticket, or session tables. Save the wrong query and the fixed query side by side in a learning document.
- Open a dashboard that shows a grand total and a breakdown. Check whether the breakdown dimensions are many-to-many relative to the fact. If totals change when you add a dimension, escalate it, because that is a grain or relationship problem.
- Add grain to the next metric card you touch, alongside the formula and the time basis, and link it from the model description.
Quick recap
- Grain is the business meaning of one row, so finish the sentence before you model.
- Keys put grain into practice, filters take a subset of rows, and aggregates change grain.
- Fan-out joins and many-to-many links are the usual villains behind “three revenues.”
- Document the one-row sentence, the unique keys, the time basis, and the fields that cannot be summed.
- Check AI-written SQL and human SQL the same way, with counts before and after joins and totals compared against Finance’s numbers.
When someone says “the data is wrong,” ask “wrong at which grain?” Half the time the data is fine and the question was never specified. That is not pedantry, and it is how you keep Monday meetings short.
Your next step
For the table you query most, write the one-row sentence (one row equals one what), its unique key, its time basis, and any fields that cannot be summed. Keep that note next to the table. It is the quickest way to stop the next three-revenues argument before it starts.
Series notes
Foundation reading lives on Learn. Pair it with metric specs and warehouse habits when definitions start to fight.
Sources
Further reading and references used for this article:
- Kimball Group, dimensional modeling techniques (grain as a design step): https://www.kimballgroup.com/data-warehouse-business-intelligence-resources/kimball-techniques/dimensional-modeling-techniques/
- dbt Discourse and docs community patterns on model grain and testing uniqueness (start from dbt docs best practices): https://docs.getdbt.com/best-practices
- Analytics Made Simple: Metrics series, Data quality series, SQL series, How to check AI-written SQL, Learn
Keep going
Same lessons in your feed
Short diagrams, hooks, and weekly tutorials on Substack, Instagram, X, and Facebook.