Pick where to store data by the question it needs to answer, not by which product is popular. The app’s own database, a warehouse (the central database for reporting), a data lake (cheap storage for raw files), and spreadsheets each suit different jobs.
Imagine your manager asks you where the sales numbers live, and you realize there are several honest answers: the app’s own database, the warehouse, a folder of raw files, and a spreadsheet you keep. Each is partly right, because each one serves a different job.
This guide sorts the main options so you can choose by question and workload. Related reading: when to clean data before or after loading it and data governance.
What you’ll learn
- What each major store is for.
- How latency (how long you wait for an answer), structure, and cost trade off.
- When a mart helps and when it creates another silo.
- A simple decision table for common analytics questions.
- Mistakes teams make when they buy storage before they name a use case.
Start with the question, not the product
Storage debates go wrong when they start with “we need a lakehouse” instead of “we need same-day order margins by region with a trusted product grain.” Name the grain, freshness, users, and failure cost first. Then pick the layer.
Operational databases
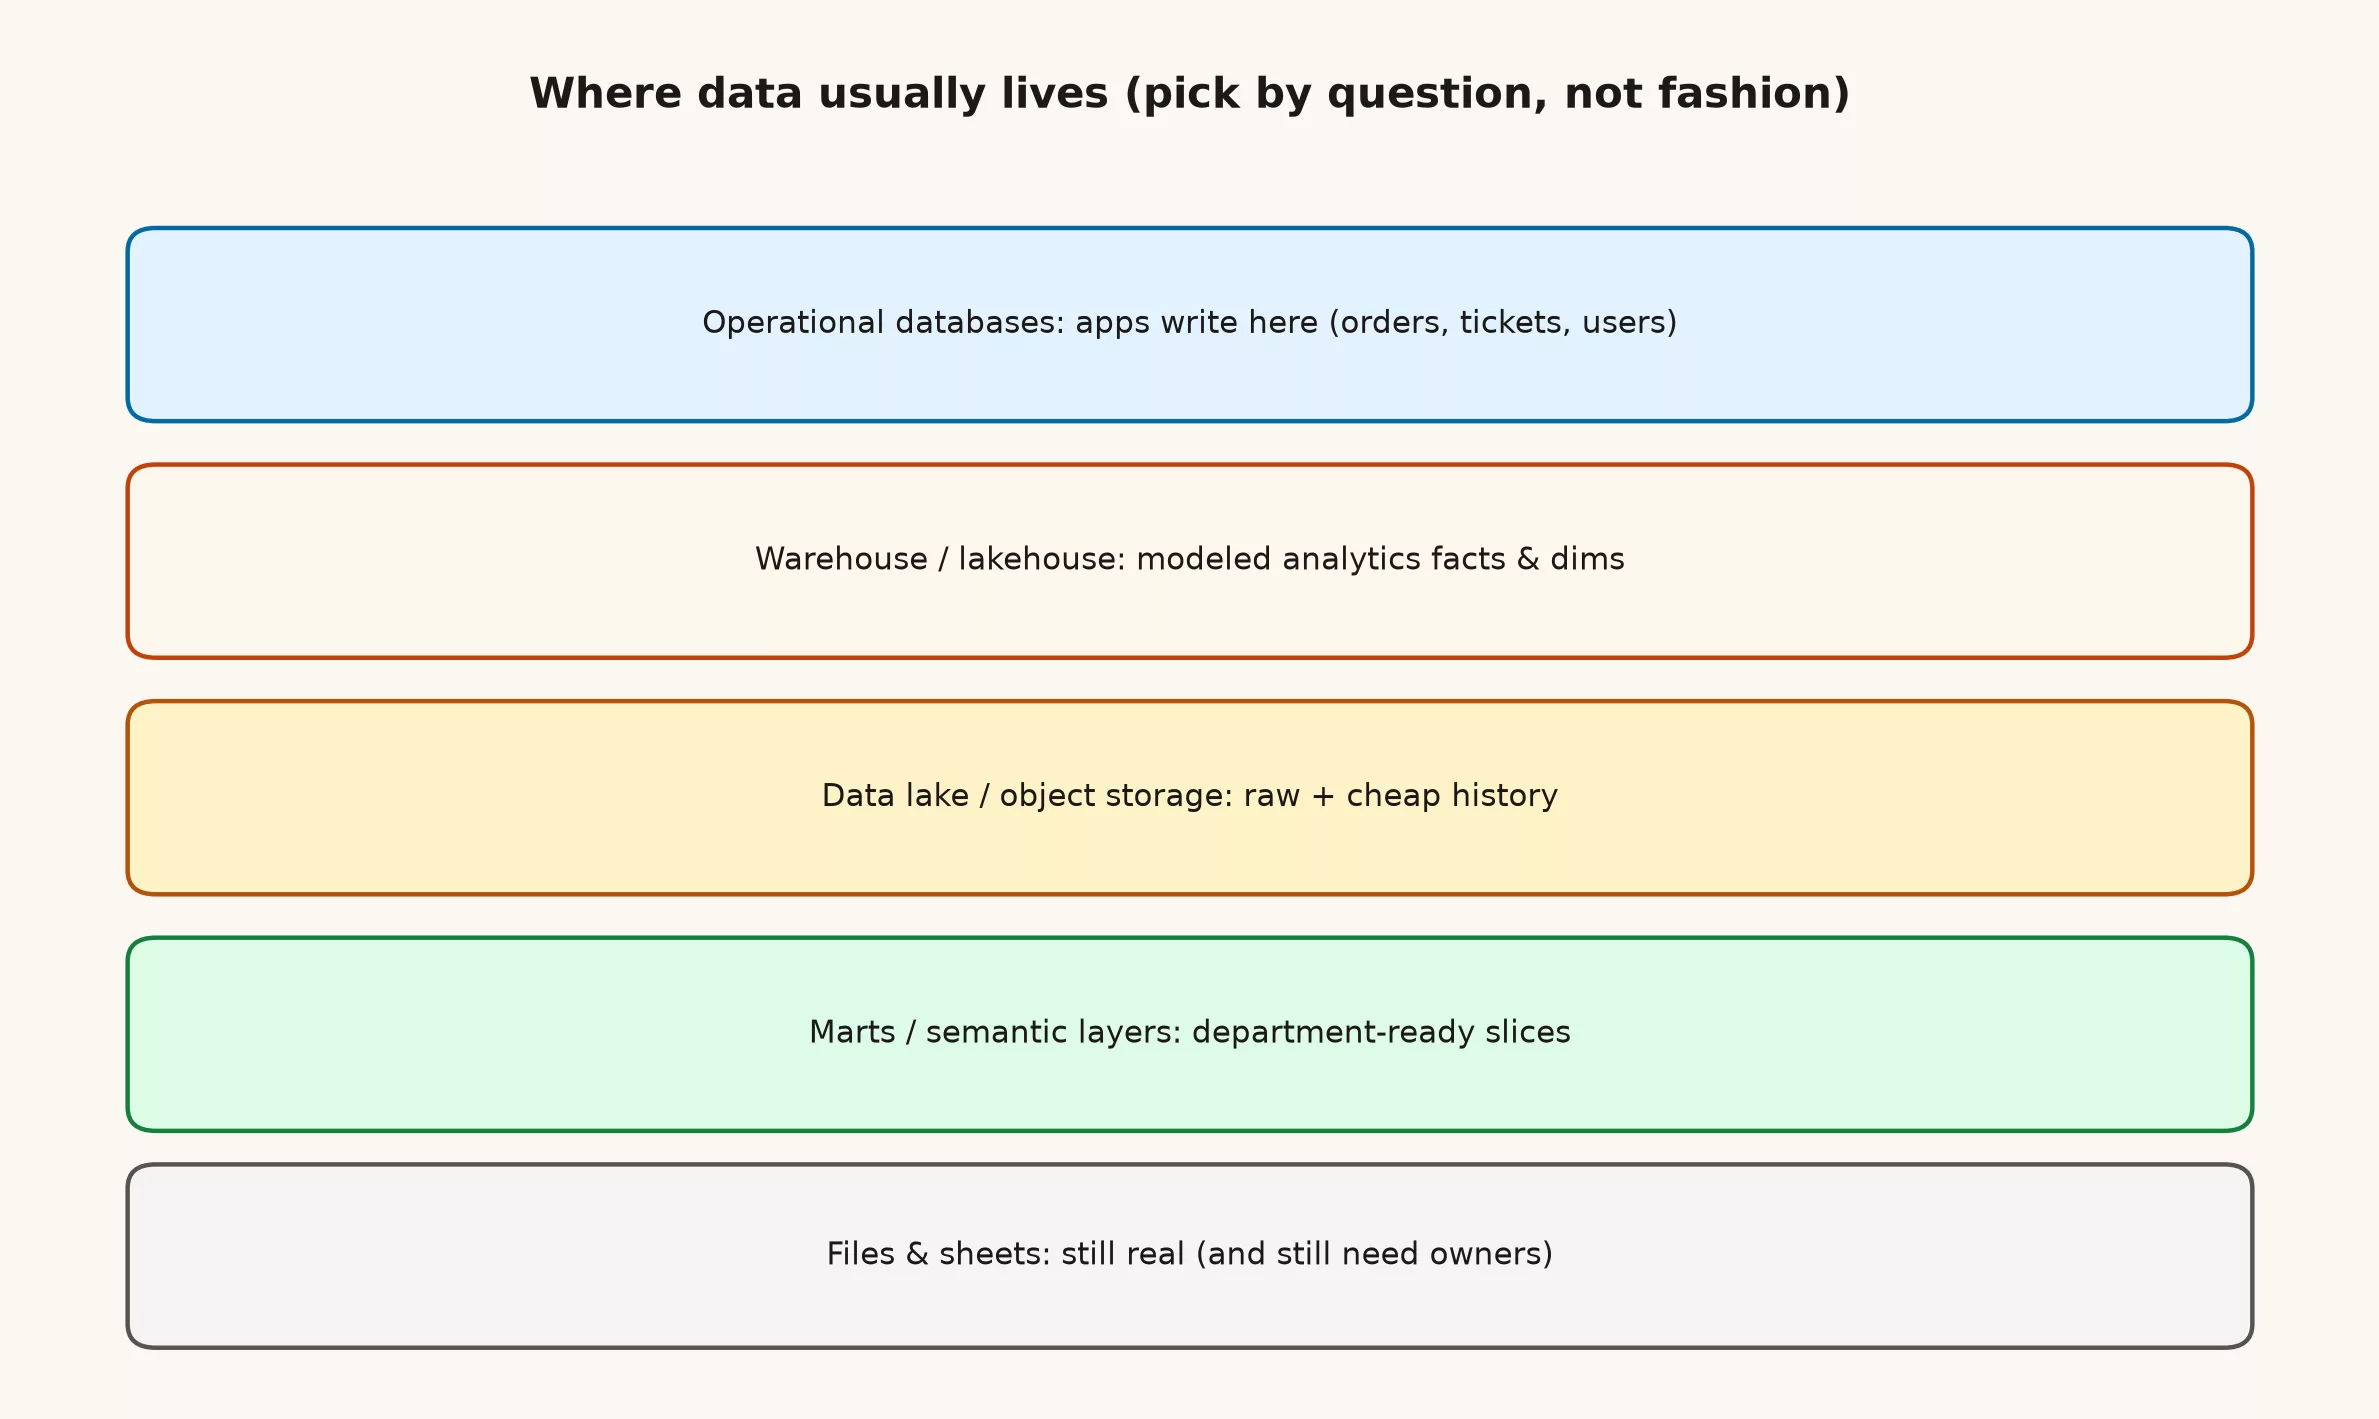
These run the products themselves. Common examples are Postgres, MySQL, and Microsoft’s own database product, and most are queried with SQL, the standard language for asking a database questions. Optimized for correct writes and fast lookups of single records. They are usually a poor home for heavy historical analytics scans, but they are the primary source of truth for many entities. If analysts run year-long scans on production checkouts, you will soon hear from the person who runs the database conversation you will not enjoy.
| Good for | Risky for |
|---|---|
| App transactions, current state | Year-long scans that block writers |
| Point lookups by primary key | Ad hoc joins across the whole business |
| Strict schemas the product needs | Uncontrolled analyst write access |
Data warehouses and lakehouse cousins
Warehouses (Snowflake, BigQuery, Redshift, and similar) are built for analytical queries over large modeled tables. Cloud warehouses made ELT (extract, load, transform) common: load, then transform with SQL and tools like dbt. Lakehouse platforms blur lines by putting warehouse-style tables on cheap object storage with table formats that support richer management.
What you want here: clear facts and dimensions, documented grains, and access controls that match business roles. What you do not want: every raw dump of JSON files (plain-text files that store data as labeled fields) with no owner living forever under a folder called temporary that is five years old.
Data lakes and object storage
Amazon S3, Google Cloud Storage (GCS), Azure Data Lake Storage (ADLS), and modern lake formats store cheap, flexible files: logs, extracts, images, parquet dumps. Great for history and multi-purpose raw landing. Terrible as the only interface for executives, because “just query the lake” often means “become a part-time data engineer before lunch.”
Use lakes as a landing and archive layer. Promote curated datasets into warehouse tables or well-governed lakehouse tables people can trust. Promotion is a product decision, not a weekend script (a short program that runs a list of steps for you) without an owner.
Data marts and semantic layers
A mart is a purposeful slice: finance mart, growth mart, support mart. A semantic layer (LookML, dbt metrics, business intelligence (BI) datasets) exposes business-friendly fields on top. They reduce repeated join logic. They also create drift if five marts redefine revenue differently. Pair marts with governance, not copy-paste SQL across folders.
Files and spreadsheets
Sheets still run companies. Pretending they do not is how shadow pipelines form. Give critical sheets owners, versioning where possible, and a path into the warehouse when a process stabilizes. Banning sheets without offering a better path just moves the chaos to email attachments and desktop files named for someone’s dog.
Decision table
| You need… | Prefer… | Watch out for… |
|---|---|---|
| Correct order writes from the app | Operational DB | Analysts overloading prod |
| Trusted cross-domain reporting | Warehouse models | Undefined grains |
| Cheap long history of raw events | Lake / object storage | No curation path |
| Department self-serve with guardrails | Mart + semantic layer | Metric forks |
| Fast one-off scenario modeling | Sheet or notebook | Becoming an accidental source of truth |
Cost, latency, and governance
Cloud storage is cheap; careless cloud compute is not. Scans that read every column of a giant fact table for a tiny chart will show up on a finance review. Design tables and clustering with common filters in mind. Put owners on expensive datasets. Governance is not only privacy; it is also “who pays when this query goes wild.”
Common mistakes
- Buying a lake to store everything with no promotion rules.
- Running huge analytics on the production OLTP (the kind of database an app uses to record transactions as they happen) database.
- Three warehouses for politics, not workload.
- No cost controls on cloud scans.
- Calling a folder of spreadsheet exports a data platform.
- Skipping grain definitions because “we will clean it later”.
A Monday whiteboard exercise
Draw the stack. Point to one painful metric. Ask which layer owns its truth and who can change the definition. If nobody can answer, that is your first project. New vendors can wait until the ownership sentence is boringly clear.
Quick recap
- Different stores solve different jobs.
- Warehouses excel at modeled analytics; lakes excel at cheap raw history.
- Marts need shared and consistent definitions.
- Always start from grain, latency, and freshness, because those three decide whether a table can answer the question at all.
- Promote clean data upward with named owners.
A good first step this week: list the places your team stores data today and, for each one, write the question it answers best. Anything without a clear question is a candidate to retire.
Sources
- https://cloud.google.com/bigquery
- https://www.snowflake.com
- https://www.databricks.com
- https://aws.amazon.com/s3/
Keep going
Same lessons in your feed
Short diagrams, hooks, and weekly tutorials on Substack, Instagram, X, and Facebook.