
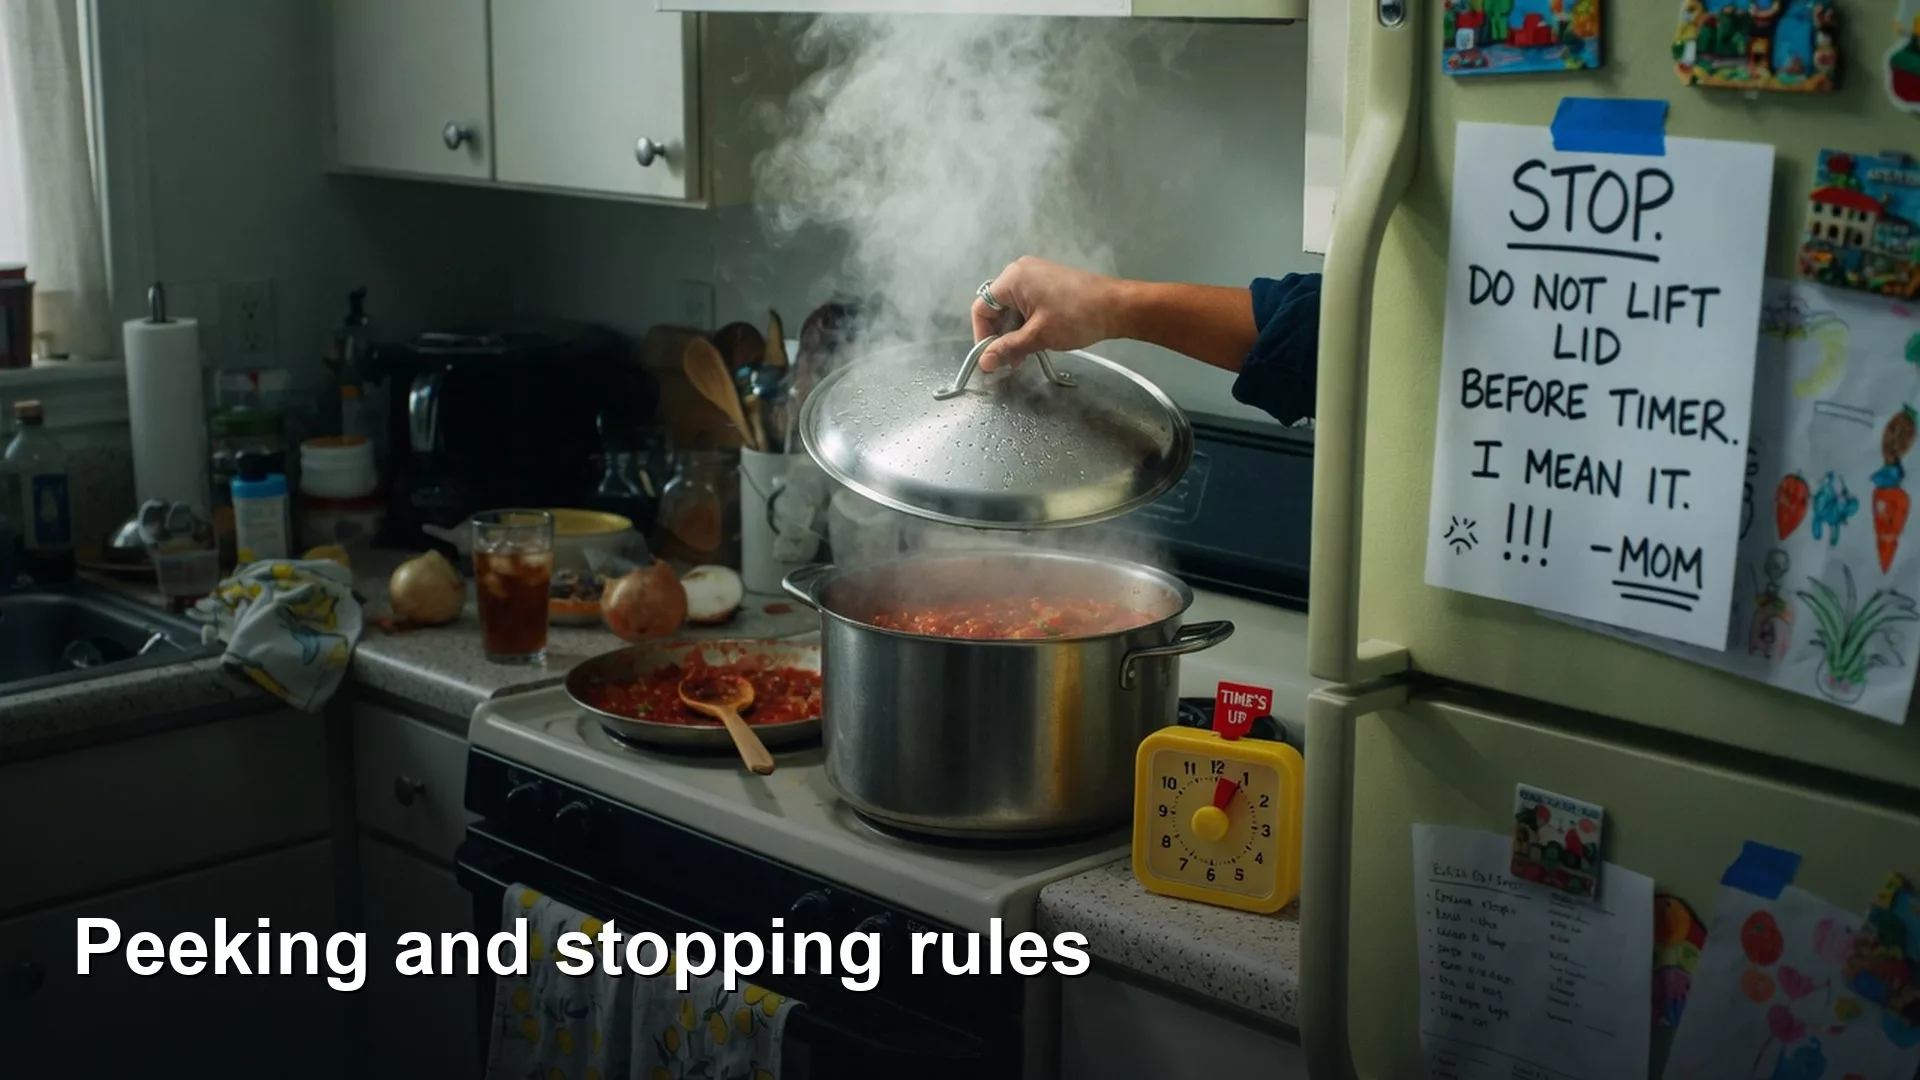
Decide before an A/B test starts when you will look at the results, which safety metrics can veto a win, and when you will stop. Checking the p-value every morning instead quietly ruins the test. (A p-value is a score that says how surprising your result would be if the change did nothing.)
Say it is Monday morning and your experiment dashboard is green. You post a screenshot in your team chat: “p < 0.05, ship it?” By lunch the number has faded, and by Wednesday it is red. On Friday you are arguing about whether last week’s lift was real or just a lucky day you happened to check. You never set a stopping rule, and you kept peeking.
Peeking is not the same as looking at data, which is healthy. Peeking means treating every interim p-value as a final decision when your plan never allowed for interim looks. Guardrails are the safety metrics, such as refunds or page speed, that can veto a “winning” main result. Stopping rules are actions you agree on in advance for when the results are green, red, or muddy. Together they turn experimentation from a feeling into a decision system.
Peeking is optional looks without optional rigor
A classic fixed-horizon A/B test assumes you choose a sample size or a duration, wait, and then analyze once. The p-value and the confidence interval (the range where the true effect probably sits) are calibrated for that one look. Suppose you open the dashboard every day and claim victory the first morning the p-value dips under 0.05. You have then run a different experiment from the one you planned. Early green spikes are common when the data is noisy, and stopping on them inflates your false positives, which are wins that were never real.
That does not mean you must fly blind. Operations teams need health signals, and product teams need a sense of direction. The difference is whether the interim numbers can change the decision under a written plan, or whether they only feed curiosity and risk monitoring.
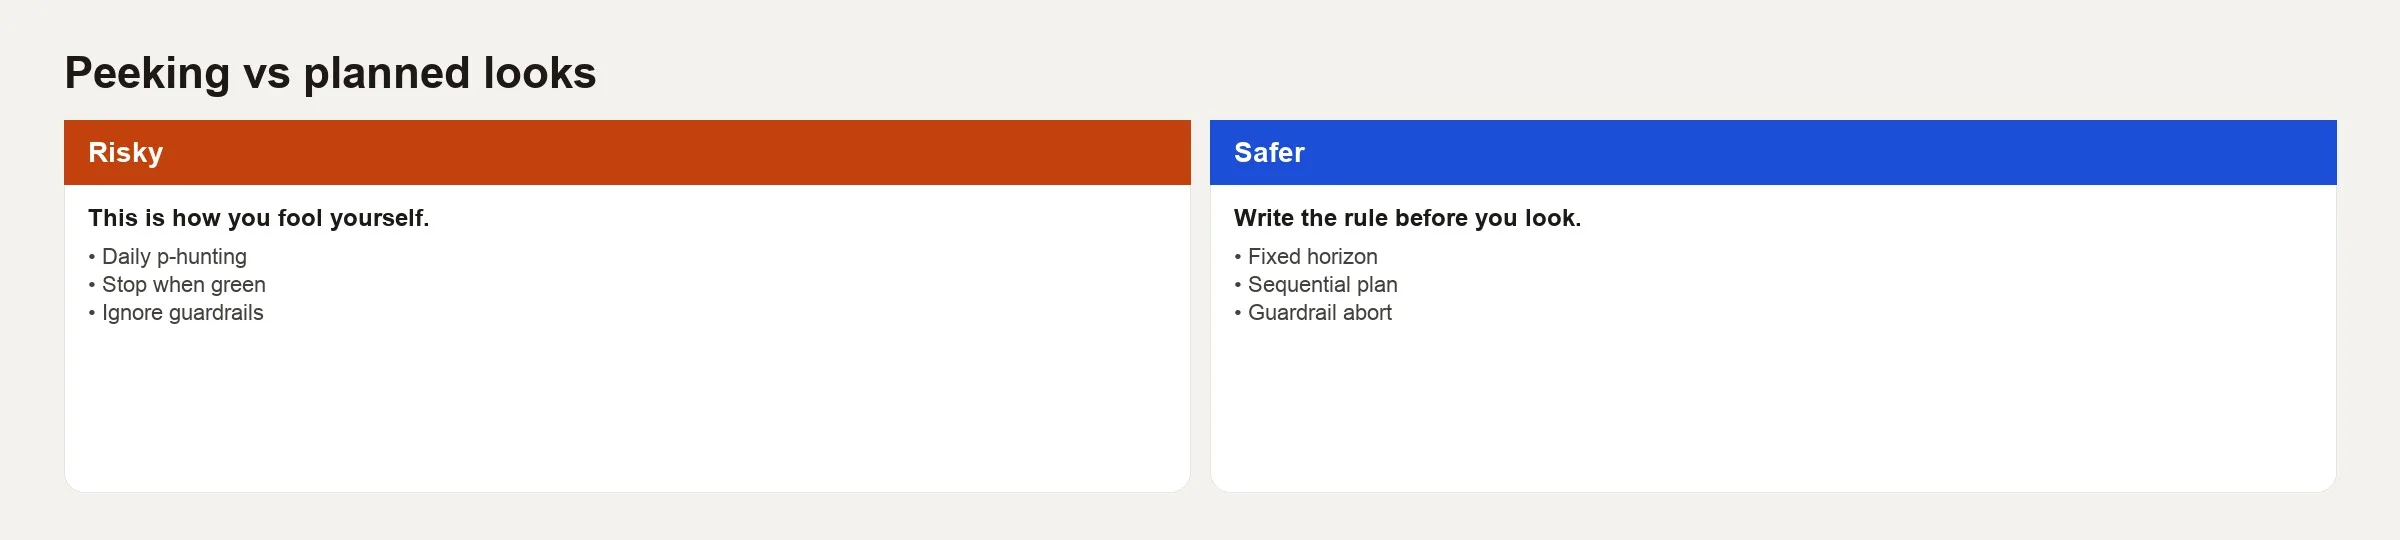
Three risky habits show up constantly:
- Daily p-hunting: treating the main metric’s p-value as a live scoreboard that can end the test on any day.
- Stop when green: ending early only when the variant looks good, never when it looks bad. This one-sided peeking guarantees a bias toward shipping noise.
- Ignore guardrails: shipping a conversion lift while refunds, page speed, or support tickets are getting worse.
Three safer habits mirror them:
- Fixed horizon: analyze the main metric at a pre-set date or sample size, and keep operations monitors separate so they never decide the main result.
- Sequential plan: if you will look early, use methods built for multiple looks. Examples are group sequential testing, alpha spending (dividing your false-positive budget across looks), and a platform’s sequential testing with documented settings.
- Guardrail abort: define metrics and thresholds ahead of time that stop or roll back the test no matter how good the main result looks.
If your company uses an experimentation platform with sequential testing turned on, read that platform’s documentation. “Peeking is fine because the tool does sequential testing” is only true if you set it up and read it as sequential. Sizing the test with a fixed-horizon calculator and then stopping early with the tool’s sequential rules is a mixed recipe that breaks the math.
Fixed horizon without theater
Fixed horizon is the simplest habit to enforce. You write a rule such as, “We analyze the main metric on day 14 or after 40,000 users, whichever comes first.” The rule also names the metric and the unit ahead of time. Until then, the main chart can stay visible with a banner that says “not decision-ready.” Operations still watch crash rates and payment failures the whole time.
People dislike fixed horizons because they feel slow when a change “obviously” works. Sometimes it does work. Still, the cost of waiting two more days is usually smaller than the cost of shipping a fake lift and building three more features on top of it. Culture is choosing which cost you pay more often.
A few practical tips for fixed horizons:
- Pick a horizon that covers full business cycles, such as weekdays and weekends, paydays, and seasonal spikes.
- Do not end early because a stakeholder is presenting on Thursday. Move the presentation instead, or label the result “in progress, not decision-ready.”
- Keep “health dashboards,” which can trigger a rollback, separate from “success dashboards,” which trigger a decision only at the planned analysis.
- Document the analysis unit (user, account, or order) so nobody switches mid-test to get a significant result.
When sequential looks are the honest path
Some products cannot wait. High-risk changes need an early abort, and high-traffic teams want to stop early on huge wins so they can free up traffic for the next test. Sequential designs exist for those cases. They spend the false-positive budget across several looks, or they use Bayesian decision thresholds (a different way of scoring evidence) that you still have to commit to in advance.
A minimum sequential plan includes these parts:
- How many looks there will be, for example day 7, day 14, and day 21.
- What statistic and threshold apply at each look.
- Whether early stopping is allowed for success, for futility (no realistic chance of a win), or for both.
- Who can call the stop, which should be an analyst plus the product owner and not whoever is loudest in chat.
- What happens to the main result if you stop for a guardrail instead.
If you do not have a statistician, or a platform that implements this cleanly, prefer a fixed horizon for main decisions and keep early looks for guardrails only. That is not “less advanced.” It is matching your ambition to your tools and your skills.
Guardrails: the metrics that can veto a win
The main metric answers your hypothesis. Guardrails answer a different question: did we break something important while chasing that hypothesis? Common guardrails include refund rate, chargebacks, crash rate, unsubscribe rate, support tickets per user, and margin. Slow page loads are another, often measured at the 95th percentile, meaning the slowest 5% of visits. A secondary funnel step that must not collapse also works.
Good guardrails share four traits:
- Few: three is usually better than twelve, because noise multiplies with many thresholds.
- Directional and actionable: “refund rate must not worsen by more than X absolute points” beats “monitor all metrics.”
- Pre-registered: written before launch, not invented after the main result looked awkward.
- Owned: a named person gets paged if the guardrail trips during the test.
A guardrail abort is not a failure of experimentation. It is the system working. Shipping a “winning” checkout button that triples failed payments is not a win, because it is a finance incident with a chart attached. To make guardrails computable, lean on the habits in the series on metric definitions and the checks in the series on data quality.
Hard versus soft guardrails
Hard guardrails automatically stop traffic or force a rollback. Payment success, severe slowness, and safety issues belong here. Soft guardrails trigger a review instead of an automatic kill, for example a mild rise in support volume or a small dip in a secondary engagement metric. Soft is fine if the review is real, but if the review always ends with “we noted it and shipped anyway,” it has become theater.
Stopping rules that fit on one card
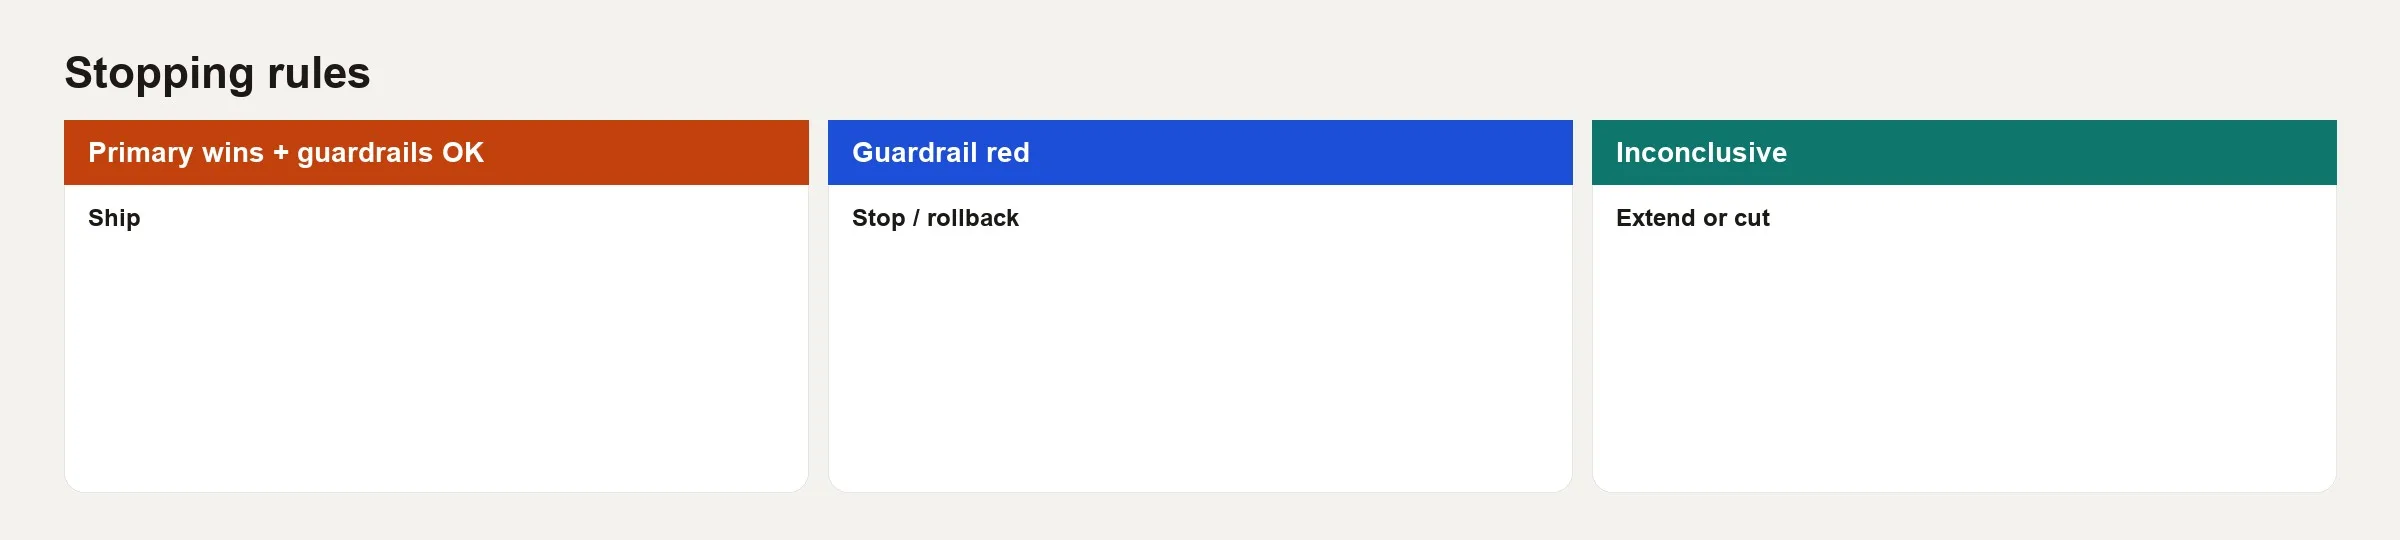
At analysis time you need three outcomes, not a 40-slide debate:
- Main result wins and guardrails are fine, so ship. You can also roll out gradually with monitoring.
- A guardrail is red, so stop or roll back, even if the main result is green.
- The result is inconclusive, so extend or cut, under rules you wrote earlier and not under hope.
“Extend” needs a cap. “We will add one more week, once” is a plan, while “we will keep going until it is significant” is peeking with a longer rope. “Cut” means you accept that you will not ship, you write down what you learned, and you free up the traffic. Inconclusive is a valid outcome, and treating it as a personal failure creates pressure to mine segments until something turns green.
A checkout step reorder
Take a mid-size online store. The hypothesis is that showing shipping estimates earlier increases completed checkouts without hurting payment success.
Main metric: checkout completion rate per started checkout, with users assigned to a version, a 14-day fixed horizon, and at least 30,000 users per group if traffic allows.
Hard guardrails: payment success rate must not fall by more than 0.3 absolute points. Also, 95th percentile checkout latency (how long the slowest 5% of checkouts take) must not rise by more than 200ms.
Soft guardrail: support tickets tagged “checkout” per 1,000 starts must not rise by more than 15% without a documented review.
Interim policy: no main-metric decision before day 14. The operations dashboard for speed and payments stays live, and if a hard guardrail trips two days in a row, the test pauses automatically and someone investigates.
At day 14, the toy results look like this:
| Metric | Control | Variant | Note |
|---|---|---|---|
| Checkout complete | 62.1% | 63.8% | Main metric green, planned analysis |
| Payment success | 97.4% | 97.5% | Guardrail OK |
| p95 latency | 1.8s | 1.9s | Within +200ms |
| Support tickets / 1k | 4.0 | 4.2 | Soft, mild |
Under the card, the decision is ship, with a one-week watch on the soft support metric after launch. Now the counterfactual: if payment success had been 96.9% against 97.4% for control, the decision would be stop or roll back, even with a greener main metric. That is the whole point of guardrails.
A second counterfactual is one that people hate. Suppose the main metric is up 0.2 points with wide uncertainty at day 14. The plan said, “extend once to day 21 only if the sample is below the target; otherwise cut.” You extend because of that clause. An executive liking the design is not a reason.
# Experiment decision card (YAML sketch)
experiment_id: checkout_shipping_early_v3
primary:
  metric: checkout_complete_rate
  unit: user
  analysis: fixed_horizon_day_14
guardrails:
  - name: payment_success
    type: hard
    rule: "variant - control >= -0.003 absolute"
  - name: checkout_p95_latency_ms
    type: hard
    rule: "variant - control <= 200"
  - name: support_tickets_per_1k_starts
    type: soft
    rule: "variant / control <= 1.15"
stopping:
  ship: "primary wins at planned analysis AND hard guardrails OK"
  rollback: "any hard guardrail fails"
  extend: "once to day 21 if underpowered only"
  cut: "inconclusive after allowed extend"
peeking_policy: "no primary decision on interim p-values"
Segment peeking is still peeking
A related failure appears when the main metric is flat overall, but one browser in one country looks green. The team then ships only there, or claims a “partial win.” Unplanned segment hunting multiplies false positives the same way daily looks do. Pre-register one or two segments you truly care about, and treat everything else as exploratory. Label it that way, and use it as fuel for the next experiment, not for today’s ship decision.
If your culture rewards finding green cells in a 20-by-20 table of slices, you will get green cells, but you will not get reliable products. The next post in this series covers review meetings that force a decision without letting slices rewrite the main metric after the fact.
Common mistakes
- Sizing the test for a fixed number of users, then stopping on the first green day. That is the wrong procedure for the math you claimed.
- Peeking only for success, never for futility. This biases you toward shipping noise.
- Guardrails invented after the results. That is motivated reasoning with extra steps.
- Twenty guardrails. Something will trip by chance, and nobody will respect the abort.
- “Inconclusive means keep running forever.” Opportunity cost is real, so cut the test and learn.
- Changing the main metric mid-test because the original one was not moving. That is a new experiment.
- Hiding the interim chart from operations, so hard failures go unnoticed. Safety visibility is not peeking.
Quick recap
Peeking without a plan inflates your wins. Fixed horizons and real sequential methods are both valid, but mixing them casually is not. Guardrails protect the business from clever main results, and stopping rules turn analysis into ship, stop, extend, or cut. Write them before traffic starts, and stick to them when the celebration emoji start flying in chat.
The next post in this series covers experiment review meetings that decide. That way these rules show up in a room with a clock and a decision log, not only in a YAML file (a plain text settings file) nobody opened.
How to practice this week
- Pick one live or recent experiment and write the three stopping outcomes in five lines, because deciding the outcomes after seeing data invites bias.
- List your current “guardrails,” and mark each one hard or soft. Delete the ones nobody would actually abort for.
- Check whether anyone can ship based on a mid-test screenshot. If so, add a “decision-ready” banner and a named analysis date.
- Walk through one case where a guardrail is red and the main metric is green, in a table. Practice saying “rollback” out loud with the product owner.
- Optional: if you use sequential testing, open the platform docs and write down which method is switched on. If you cannot find it, treat decisions as fixed-horizon until you can.
Series notes
This is Part 2 of Experimentation culture. The next post covers experiment review meetings that decide.
Sources
- Kohavi, Tang, and Xu, Trustworthy Online Controlled Experiments (Cambridge University Press): practical peeking, guardrails, and decision culture: https://www.cambridge.org/core/books/trustworthy-online-controlled-experiments/D97B26382EB0EB2DC2019A7ECBD9E84D
- Johari, Pekelis, and Walsh on continuous monitoring and always-valid inference (Peeking at A/B Tests): https://arxiv.org/abs/1512.04922
- FDA guidance on adaptive designs for clinical trials (group sequential concepts in plain regulatory language): https://www.fda.gov/regulatory-information/search-fda-guidance-documents/adaptive-design-clinical-trials-drugs-and-biologics-guidance-industry
- Microsoft Experimentation Platform materials on metrics and guardrails (industry patterns): https://www.microsoft.com/en-us/research/group/experimentation-platform-exp/
- NIST Engineering Statistics Handbook, sequential methods overview: https://www.itl.nist.gov/div898/handbook/pmc/section4/pmc42.htm
Keep going
Same lessons in your feed
Short diagrams, hooks, and weekly tutorials on Substack, Instagram, X, and Facebook.



