An experiment review meeting should end with a decision: ship the change, try a better version, stop, or go get one named fact. Charts are only the raw material for that decision. The meeting works because of four things: a set agenda, clear roles, a short document sent ahead of time, and a written record of the decision.
Say you accept a calendar invite that says “Experiment readout, 30 minutes.” By the end you have seen eight charts and followed three side stories about customer groups. You still have not chosen anything. Someone says “interesting,” the call ends, and your half hour is gone with nothing to act on.
What “decide” means
A decision is one of a few specific actions, and each one has an owner and a date. The list below covers them all, so if your outcome is not on it, the meeting is not finished yet.
- Ship: give the new version to 100% of users, or roll it out in stages with a clear point where you stop. Then close out the experiment and watch the safety metrics for a short period afterward.
- Iterate: keep learning, but with a new experiment that has its own ID, hypothesis, and plan. Leaving the old test running at 50/50 forever does not count.
- Kill: remove the new version, write down why, and give the traffic and engineering time back to other work.
- Extend, with a limit: only if the stopping rules you wrote before the test allowed one extension, and book the next review right away.
“Interesting” is not a decision. “Needs more analysis” only counts when it names the question and the person who will answer it. It also needs a deliverable due within 48 hours, so the team can then ship, iterate, or kill. Open-ended analysis is how experiments turn into permanent half-finished features.
The four blocks of a review that works
Use the same order every time. A shuffled order makes it easy to bury bad news under a fun story about one customer group.
1. The main result comes first
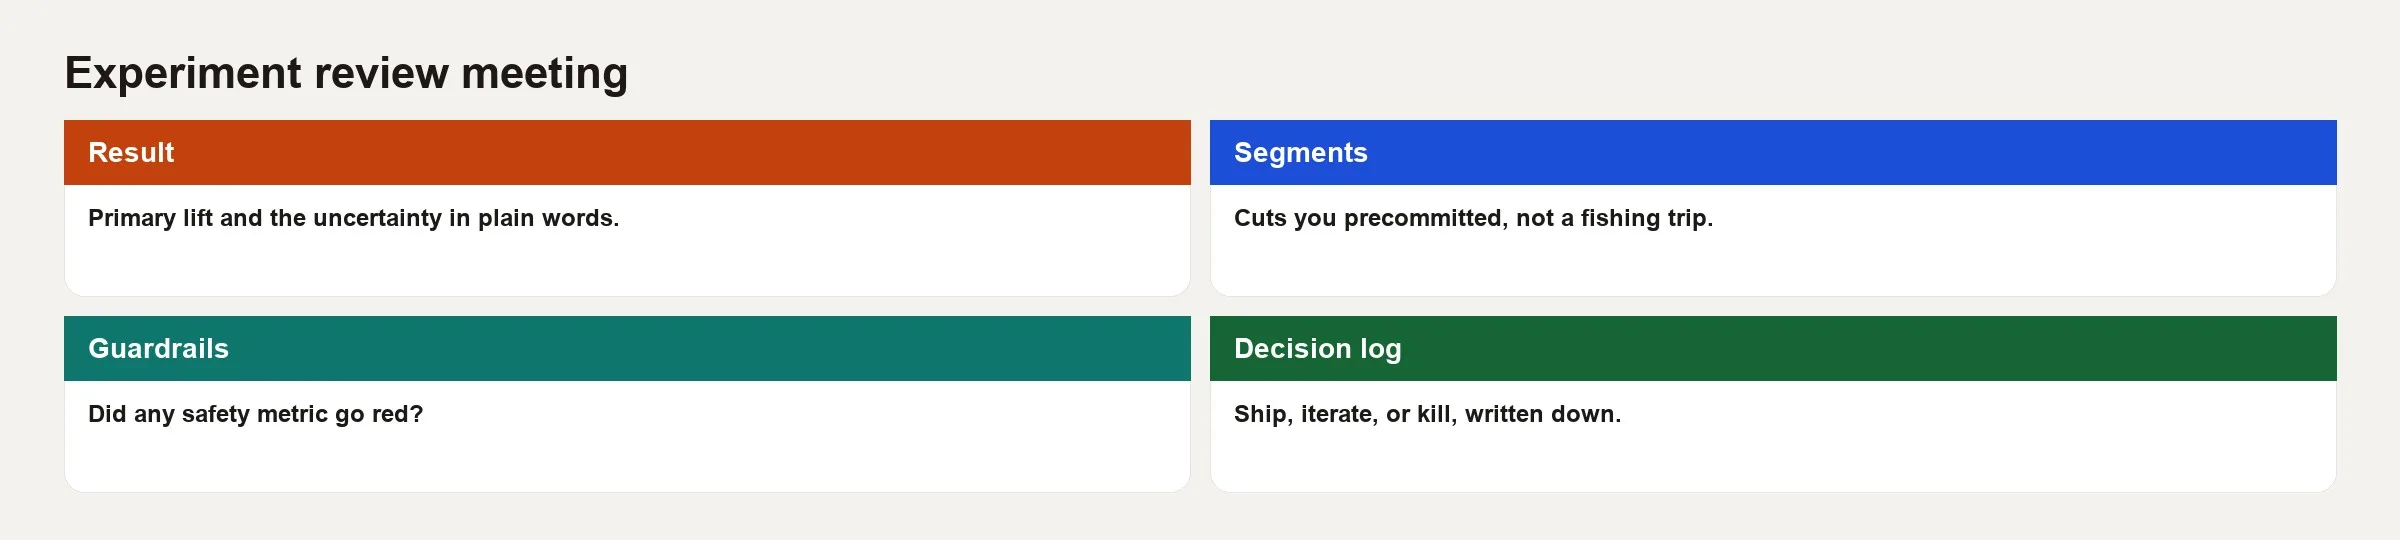
Start by restating what you predicted before the test began. That means the hypothesis, the main metric, who or what was counted, the sample size, and how you planned to analyze it, all in under two minutes. Then show the main result along with how uncertain it is. A range of likely values works well, as does the chance that the new version beats the old one, because a single number hides how much the answer could move. Finish by saying whether your pre-set stopping rule calls this a win, a loss, or inconclusive. Judge that on the main metric alone, with no customer groups yet.
2. Customer groups come second, and get labeled
Only groups you picked before the test carry weight in the decision. Any other slice of the data gets a banner that says “hypothesis generating,” which means it is an idea for a future test. Suppose the overall result is flat and one small group looks green. You do not rewrite the main metric to celebrate it. You can, however, open a new experiment aimed at that group with a fresh design.
3. Guardrails get a full walk-through
Guardrails are the metrics that must not get worse, such as support tickets or page speed. Go through the strict ones first and the softer ones after. A green main result with a red strict guardrail is not a ship. If someone wants to accept the risk anyway, that is a product and risk decision, so it goes in the written record. It should never be a silent shrug.
4. The decision log gets written before people leave
Write the decision while everyone is still in the room. Paste it into the experiment ticket or the team wiki within the hour. Nobody remembers a verbal agreement from a noisy video call two weeks later.
A 25-minute agenda that respects calendars
Long meetings invite digressions, while short meetings force people to do the reading beforehand. This split is a good default.
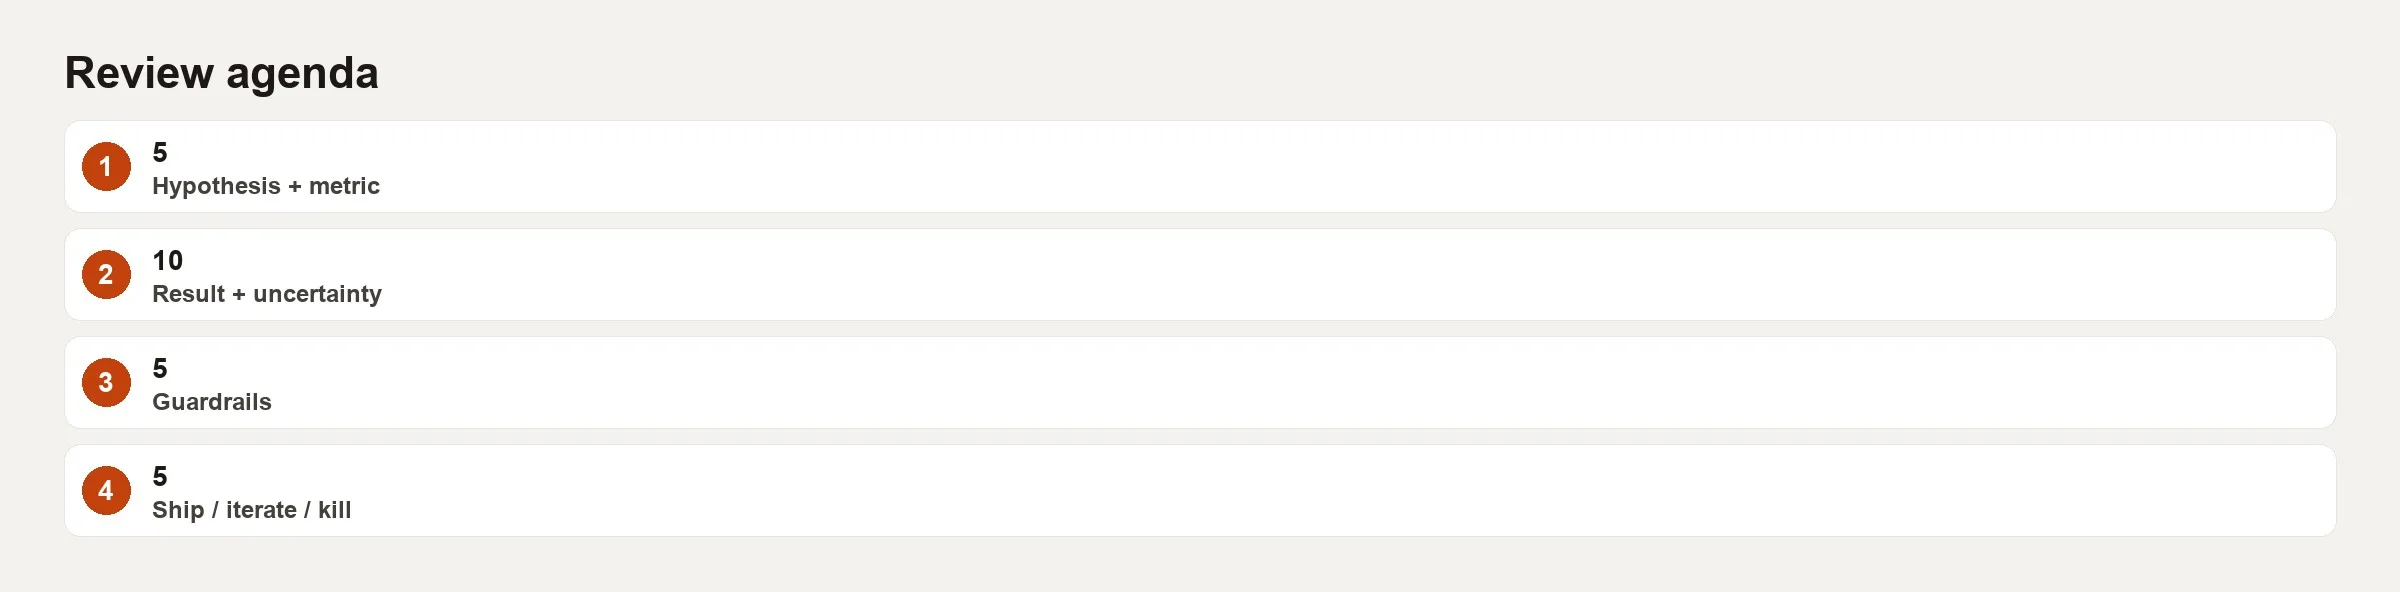
- 5 minutes: the hypothesis and the metric, including what is counted, the time window, and the rule about not peeking early.
- 10 minutes: the result and how uncertain it is, plus any customer groups you chose in advance if time allows.
- 5 minutes: guardrails.
- 5 minutes: the ship, iterate, or kill call (or a limited extension), with owners named.
If the readout needs more than 25 minutes of math explanation, the pre-read failed. Send a one-page summary 24 hours ahead with the hypothesis, the main chart, a guardrail table, and your recommended decision. The meeting then exists for questions and commitment, and nobody has to write live database queries while others wait.
Roles in the room
| Role | Job in the meeting | Not their job |
|---|---|---|
| Analyst presenter | Facts, uncertainty, plan compliance | Owning the business tradeoff alone |
| Product decision owner | Ship / iterate / kill call | Relitigating metric definition mid-call |
| Eng owner | Feasibility of rollout and rollback | Veto by endless “what if we also measure…” |
| Risk / ops (as needed) | Guardrail interpretation | Blocking every soft yellow forever |
| Scribe | Decision log live | Silent observer who “will write it later” |
If the product decision owner is not in the room, you do not have a decision meeting. The one person who can say yes is missing, so what you have is a rehearsal. Reschedule it.
The one-page pre-read
Before the invite goes out, the summary page should hold every item in the list below. Each one answers a question that would otherwise eat meeting time.
- The experiment ID, a link to the design document, the dates, and the share of traffic in the test.
- The hypothesis in one sentence.
- The main metric’s definition: what is counted on top, what on the bottom, which unit, and which time window.
- The stopping rule and the policy on peeking at results early, both taken from the earlier post on stopping rules.
- The main result with its uncertainty.
- A guardrail table showing pass or fail.
- Your recommended decision and the reason, in two sentences.
- Any open risks, such as data quality problems or bugs, in plain language.
Sample ratio mismatch (SRM) means the split of people between the two versions came out different from the split you planned. That usually signals a bug. If SRM or any tracking bug is present, put a red banner at the top of the page. A clever story cannot out-argue a broken assignment system, so fix the data path first. Then re-run the test under a clean design and review it again.
Worked example: an onboarding checklist experiment
Take a toy software product. The hypothesis is that a three-item checklist on first login raises day-7 activation without hurting how fast experienced users reach their first win.
Main metric: the day-7 activation rate, counted per user over a fixed 14-day window, with no sequential analysis.
Strict guardrail: support tickets per new user must not rise more than 10%.
Soft guardrail: the median time to a first key action must not rise more than 20%.
Here is a sample pre-read summary. The numbers are made up to show the format.
EXPERIMENT: onboarding_checklist_v2
HYPOTHESIS: Checklist raises D7 activation without +support load
PRIMARY: d7_activation_rate (users), fixed day-14 analysis
RESULT: control 28.4% | variant 31.1% | 95% CI on lift +1.1 to +4.3 pp
GUARDRAILS:
  support_per_new_user: +4% (PASS hard)
  median_ttf_key_action: +8% (PASS soft)
SRM: none
RECOMMENDATION: Ship to 100%, monitor support 7 days
OPEN QUESTIONS: exploratory mobile lift larger; not decision-grade
The meeting itself ran in four steps, each with a clear job.
- Minutes 0 to 5: the product owner restates the hypothesis, and the analyst confirms nobody changed the main metric mid-test.
- Minutes 5 to 15: the group looks at the main result. Someone asks for a country-by-country breakdown, and the facilitator moves it to an “exploratory parking lot” for later.
- Minutes 15 to 20: guardrails are green, and engineering confirms the switch that reverses the rollout still works.
- Minutes 20 to 25: the decision is Ship, and the owner is product. Engineering schedules the full rollout for Tuesday, and the analyst files the decision log. The parking lot item becomes an idea for a future experiment and not a condition for shipping.
Here is the decision log entry.
date: 2026-10-15
experiment_id: onboarding_checklist_v2
decision: ship
rationale: >
  Primary lift positive at planned analysis; hard and soft guardrails pass;
  no SRM; rollback path verified.
owners:
  rollout: eng_onboarding
  post_ship_watch: analyst_growth
  product_signoff: pm_activation
follow_ups:
  - task: full_rollout
    due: 2026-10-16
  - task: support_watch_7d
    due: 2026-10-22
non_decisions:
  - mobile_segment_lift is exploratory only; may seed checklist_v3
Handling the hard cases
The main result is inconclusive but guardrails are clean
Default to kill or iterate. Do not leave the test running at 50/50 indefinitely. Iterate only with a sharper hypothesis, such as a bigger expected effect or better targeting. “Run longer until it turns green” is only fair if your stopping rules already allowed an extension. Otherwise it is peeking until the answer looks good.
The main metric wins but a soft guardrail turns yellow
You have three options. You can ship with a closer watch afterward, iterate on a fix for the soft problem, or kill it if that soft metric matters almost as much as a strict one. Whichever you pick, record the tradeoff. Do not pretend the yellow was green.
The main metric loses but one customer group looks great
Default to kill for the version everyone would get. You can iterate with a design aimed at that one group and sized to measure it properly. Shipping a global loss because one slice looked good is how you bake random noise into the product.
A data quality problem shows up mid-review
Stop the decision. The new decision becomes “pause the test, fix the tracking, and review again.” Shipping on bad assignment data is worse than waiting a week. Choosing truth over a good-looking meeting is a habit your team has to build on purpose.
Habits that wreck experiment meetings
- Too many slides: thirty charts and not one sentence that says what was decided.
- A boss overrides the plan without a log: leadership ships against the plan, and nobody writes down why.
- Changing the metric in the meeting: someone asks “what if we used revenue instead?” without running a new experiment.
- Permanent holdouts to avoid conflict: 5% of users stay on the old version forever because nobody wanted to say kill.
- No product owner present: the group agrees to a “provisional ship” that never gets confirmed.
- Blaming the analyst for a true null: a clear “no effect” result saves engineering time when the team accepts it.
How this ties to the rest of AMS
A decision log is a kind of working documentation, like the stewardship habits covered on the site. It records who owned the call, what counted as success, and what not to reuse. If your warehouse numbers disagree with the experiment platform, fix that before the next review (the data stewardship and quality posts explain how). If someone wants an AI tool to summarize the experiment, treat that summary like any other analysis. Check the main result, the guardrails, and the decision against the source tables. For ways to trust database queries an AI wrote in SQL, the standard language for asking a database for data, see how to check AI-written SQL.
Quick recap
Experiment reviews exist to decide. Show the main result first, customer groups second with labels, guardrails third, and write the decision log last. Twenty-five minutes with the decision owner present beats an hour of charts that never reach a verb. The verbs are ship, iterate, kill, or a limited extension, and everything else is just notes.
This closes out the Experimentation culture series. It covered designing a test beyond the p-value, peeking and stopping rules, and meetings that commit to an answer. The next series turns to customer analytics, with funnels, conversion math, and cohorts.
How to practice this week
- Take one past experiment that never closed, and write in six lines the decision you should have logged.
- Put the 25-minute agenda into your team’s template document, and remove one standing item that never produced a decision.
- Require a pre-read for the next readout, and reschedule if it is missing. That is painful once and useful forever.
- Add a “parking lot” section so curiosity about customer groups has a home that is not the decision.
- After the next meeting, paste the decision log into the ticket within an hour, and hold yourself to that habit.
Series notes
This is Part 3 of Experimentation culture.
Sources
- Kohavi, Tang, and Xu, Trustworthy Online Controlled Experiments: organizational process and decision hygiene: https://www.cambridge.org/core/books/trustworthy-online-controlled-experiments/D97B26382EB0EB2DC2019A7ECBD9E84D
- Georgiev, Statistical Methods in Online A/B Testing (practical decision framing): https://www.amazon.com/Statistical-Methods-Online-B-Testing/dp/1694079724
- Atlassian team playbooks on decision records (lightweight ADR-style logging adaptable to experiments): https://www.atlassian.com/team-playbook/plays/decision
- Microsoft EXP research group (industry experimentation platform practices): https://www.microsoft.com/en-us/research/group/experimentation-platform-exp/
- Google HEART framework (useful for choosing what “activation” and quality mean before the meeting): https://research.google/pubs/pub36299/
Keep going
Same lessons in your feed
Short diagrams, hooks, and weekly tutorials on Substack, Instagram, X, and Facebook.