Before a number goes to your board, have a teammate review the change behind it with a short checklist, the same way software teams review code. Say your team ships board numbers after a quick “looks good to me” in Slack. Two quarters later nobody can explain why the churn number changed its definition in March, or why a join (a step that combines two tables) quietly doubled revenue for one region.
This post is a stand-alone guide to the analysis PR checklist. A pull request, or PR, is a proposed change that a teammate reviews before it goes live. The checklist works for SQL (the standard language for asking a database for data), metric definitions, and decision memos, whether you use GitHub, GitLab, or just a careful document with a list of changes. You will get a review flow, a checklist you can paste into a pull request template, and a worked example of a bad change that gets caught before it is merged, meaning added to the live version.
What counts as an analysis PR
An analysis PR is any proposed change that alters how a number is defined, computed, shown for decisions, or interpreted in a deliverable that other people will reuse. That includes the following.
- SQL behind a certified metric or a dashboard (a screen of charts that tracks key numbers) dataset.
- dbt models, or other transformation code, that feed reporting.
- Python that produces a number executives see on a regular schedule.
- A “final” notebook (a document that mixes code and its results) (a document that mixes code and its results) export that leadership will quote.
- A definition change in a metrics catalog, the shared list of official metric definitions.
Casual exploration can stay loose. The moment your work becomes the shared version of the truth, treat it like code, so that it can be reviewed, tested and undone. That mindset pairs with the metric definition work in the metrics series and quality habits in the data quality series.
The review flow
A good analysis review does not mean reading every line once. It is a short path with clear exits at each stage.
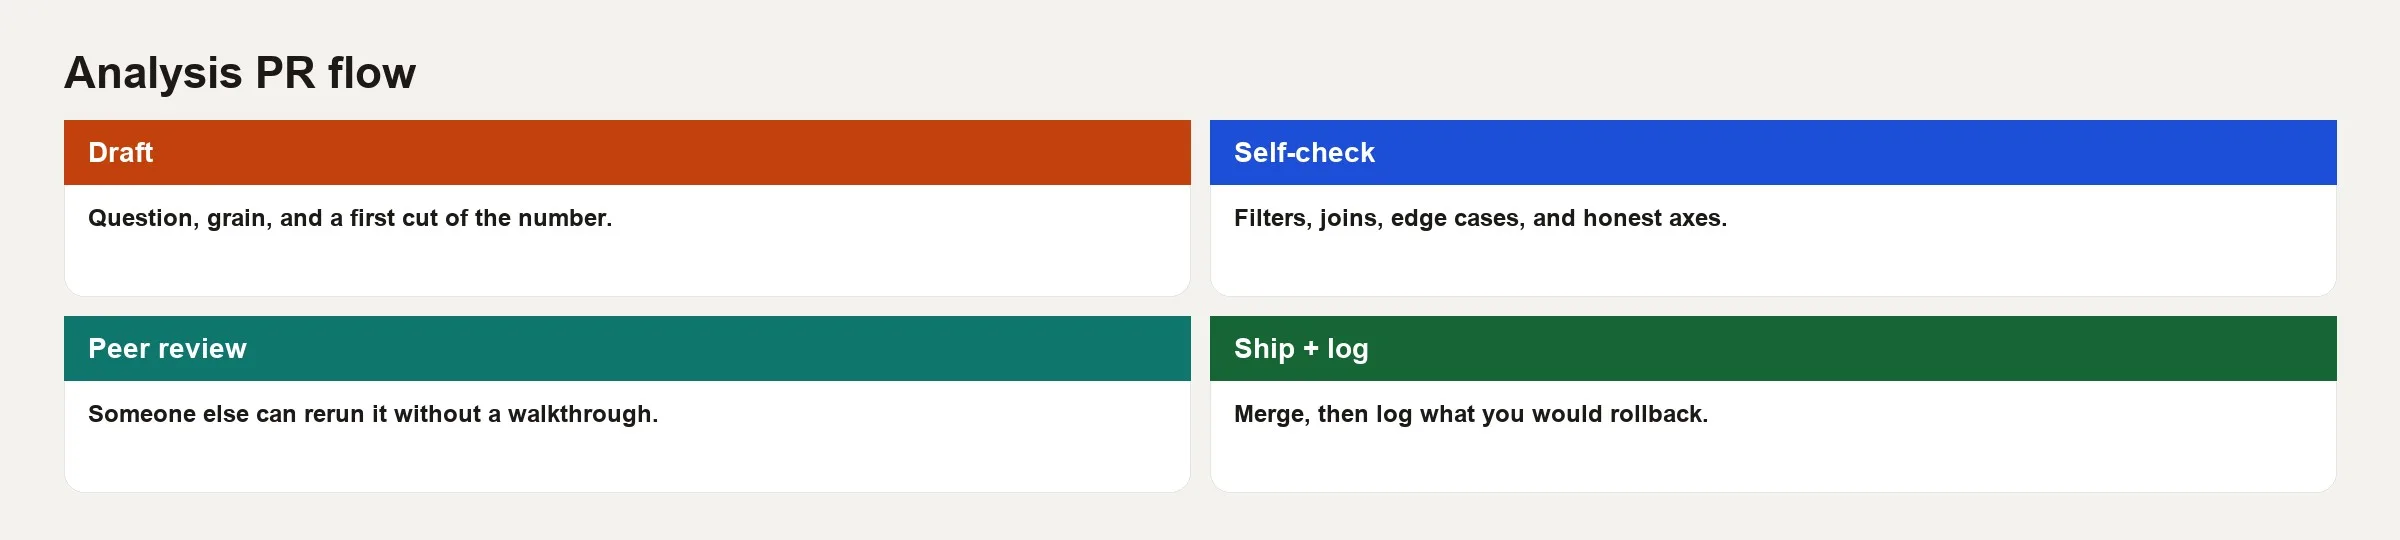
Here are the stages in plain English.
- Frame: the author states the question, the audience and how soon the decision is needed.
- Define: the author says what one row means, what is included and excluded, and who owns the definition.
- Implement: the author makes the code or settings change with a readable structure.
- Self-check: the author runs through the checklist before asking anyone to review.
- Peer review: a second person looks for the ways the change could fail and does not only nitpick style.
- Merge: the change goes live with a version note or a line in the changelog.
- Communicate: the people who use the numbers hear what changed and whether past periods will be recalculated.
If you skip the last step, you will still get tickets saying the dashboard is wrong when it is only different on purpose.
Author habits that make reviews fast
Reviewers cannot read your mind, so give them what they need.
- Keep each PR small enough to review in one sitting when possible.
- Put the business summary above the block of code, so the reviewer knows what the change is supposed to do before reading how.
- Include a small results table that compares old and new numbers for the last 4 to 8 periods.
- Link the definition document or paste the sentence that says what one row means.
- Point out the scariest join yourself, because reviewers will still check it and their trust in you rises.
Here is an example of an impact table in a PR description.
| Week | Old net revenue | New net revenue | Delta % |
|---|---|---|---|
| 2026-W10 | 1,240,000 | 1,183,000 | -4.6% |
| 2026-W11 | 1,301,000 | 1,244,000 | -4.4% |
| 2026-W12 | 1,278,000 | 1,219,000 | -4.6% |
| 2026-W13 | 1,335,000 | 1,271,000 | -4.8% |
A table like that turns vague worry into a concrete conversation with the people who use the number. You can say, “Finance, we are removing unpaid invoices from net revenue, so expect weekly figures about 5% lower from now on.”
Reviewer habits that catch real bugs
Style nitpicks are optional, but these habits are not.
- Read the definition before the SQL, and stop if the two disagree.
- Hunt for fan-out, which is any join to a table that is not clearly unique on the key and can repeat rows.
- Hunt for silent filters, such as
WHERE status = 'paid'buried in a CTE (a named sub-query at the top of a SQL statement). - Check time zones and week boundaries on any metric that executives see.
- Ask what would make this number look good while being wrong. That question finds the filter or join nobody meant to add.
If you are the only analyst, still review your own work the next morning, or trade reviews with a friendly engineer. Working alone is not an excuse for skipping every check, and it is a good reason to keep the checklist short and firm.
What approval should mean
An approval is not a social favor. It is a claim that the reviewer believes the change will not silently corrupt shared numbers in the ways they checked. That claim has limits, because reviewers cannot vouch for the entire warehouse. They can vouch that they read the definition, inspected the risky joins and saw an impact preview that matches the story in the PR.
Write that expectation down once for the team. A reviewer who rubber-stamps a change is not being nice, because they are passing the risk to everyone who trusts the metric. A reviewer who blocks a change over the color of a chart is spending goodwill for no reason. Keep the bar high on correctness and loose on looks, unless the looks confuse the decision.
For certified metrics, require at least one reviewer who did not write the change. For exploratory work that will never reach a shared dashboard, skip the ceremony. The checklist is a scalpel and not a blanket. If you force it onto throwaway analysis, people start to resent the process, and then they avoid it when board numbers are on the line.
A worked example: the “improved” revenue join
Imagine a teammate submits a PR titled “Fix revenue by joining invoice line items for more detail.” You are the reviewer, and you open the list of changed lines.
Here is the old query (a request that asks a database for data), which has one row per invoice header:
SELECT
  DATE_TRUNC('week', i.invoice_date) AS week,
  SUM(i.amount) AS revenue
FROM invoices i
WHERE i.status = 'paid'
GROUP BY 1;
This is the original query: it adds up the amount on each paid invoice by week, with one row per invoice. Keep it in mind, because the change being reviewed adds a join that can count each invoice more than once.
Here is the new query, which joins the line items without care:
SELECT
  DATE_TRUNC('week', i.invoice_date) AS week,
  SUM(i.amount) AS revenue
FROM invoices i
JOIN invoice_lines l ON l.invoice_id = i.invoice_id
WHERE i.status = 'paid'
GROUP BY 1;
The checklist catches four failures.
- Grain: sum still uses header
i.amountwhile joining lines, so multi-line invoices multiply revenue. - Join fan-out: the PR has no row counts from before and after the join.
- Impact table: it is missing, and it would have shown a sudden jump.
- Definition: PR title says “fix” but actually changes the metric identity if lines were meant to sum
l.line_amountinstead.
A corrected version either stays at one row per invoice or sums the line amounts explicitly:
SELECT
  DATE_TRUNC('week', i.invoice_date) AS week,
  SUM(l.line_amount) AS revenue
FROM invoices i
JOIN invoice_lines l ON l.invoice_id = i.invoice_id
WHERE i.status = 'paid'
GROUP BY 1;

-- self-check idea
-- SELECT invoice_id, COUNT(*) FROM invoice_lines GROUP BY 1 HAVING COUNT(*) > 1;
This corrected query adds up the individual line amounts instead of the invoice total, so an invoice with three lines is counted once, through its three parts. The commented line at the end is a quick check that lists invoices with more than one line, which are the ones the old version would have counted twice.
The PR should show the old and new numbers side by side only after the logic is coherent. Otherwise you are comparing two wrong answers, or a wrong one to a right one, with no story to explain the gap.
Here are sample self-check queries that authors can paste into the PR.
-- uniqueness of invoice header
SELECT invoice_id, COUNT(*) AS n
FROM invoices
GROUP BY 1
HAVING COUNT(*) > 1;

-- fan-out risk
SELECT
  COUNT(*) AS invoice_rows,
  (SELECT COUNT(*) FROM invoices i JOIN invoice_lines l ON l.invoice_id = i.invoice_id) AS joined_rows
FROM invoices;
If joined_rows is much larger than invoice_rows, then any sum of header fields after the join is a red alert.
Lightweight tooling without bureaucracy
You do not need a 40-page process. A minimal analysis PR culture needs only a few things.
- Git, or an equivalent version history, for the metric SQL and transformation code.
- A PR template that includes the checklist section.
- One required reviewer for certified metrics, such as a tech lead or an analytics engineer.
- A changelog or a release-note channel where changes are announced.
- Optional continuous integration (CI), which runs automatic checks such as SQL linting, dbt tests or simple uniqueness checks on every PR.
Knowing the chain of data steps helps reviewers see where the model sits. If you are setting up scheduled transforms, the data pipelines series is useful background, and you can find general skill paths on Learn.
Common mistakes
- Review as theater: approvals that never read the joins.
- Style-only comments: renaming variables while missing the fan-out.
- Huge omnibus PRs: twelve metrics changed at once, so nobody can reason about any of them.
- No impact preview: the people who use the numbers find out in the executive meeting.
- Silent definition edits: the code changes but the catalog and dashboard text do not.
- Tests that only check that there is at least one row: they cannot catch subtle errors.
- Skipping communication: merging the change is not the end of it.
Practice: 20 minutes on your next change
Pick one metric query that you already maintain, and write a practice PR description in a document, so you practice on code you understand.
- Write the grain sentence, because reviewers cannot check a query until they know what one row means.
- List the filters and why each one exists.
- Identify the riskiest join and write a row-count check for it.
- Build a four-period table of old and new numbers, even if the new numbers equal the old ones today.
- Write the message you would send to the people who use the metric if the definition changed the numbers by 5%.
If you cannot finish those five steps, the metric is not ready for review, even if the SQL runs without errors.
Quick recap
- Shared numbers deserve PR discipline, which means you frame, define, implement, check, review, merge and communicate.
- The checklist covers the question, grain, filters, joins, time, lineage, tests and narrative.
- Authors provide impact tables and point out their scariest join.
- Reviewers hunt for silent errors and not only for formatting problems.
- Keep the process small, run real checks and tell the people who use the numbers what changed, so changes do not surprise anyone who relies on the numbers.
The checklist (copy this)
Use the checklist below as a section of your PR template. Authors tick the boxes, and reviewers dig deeply into the risky ones.
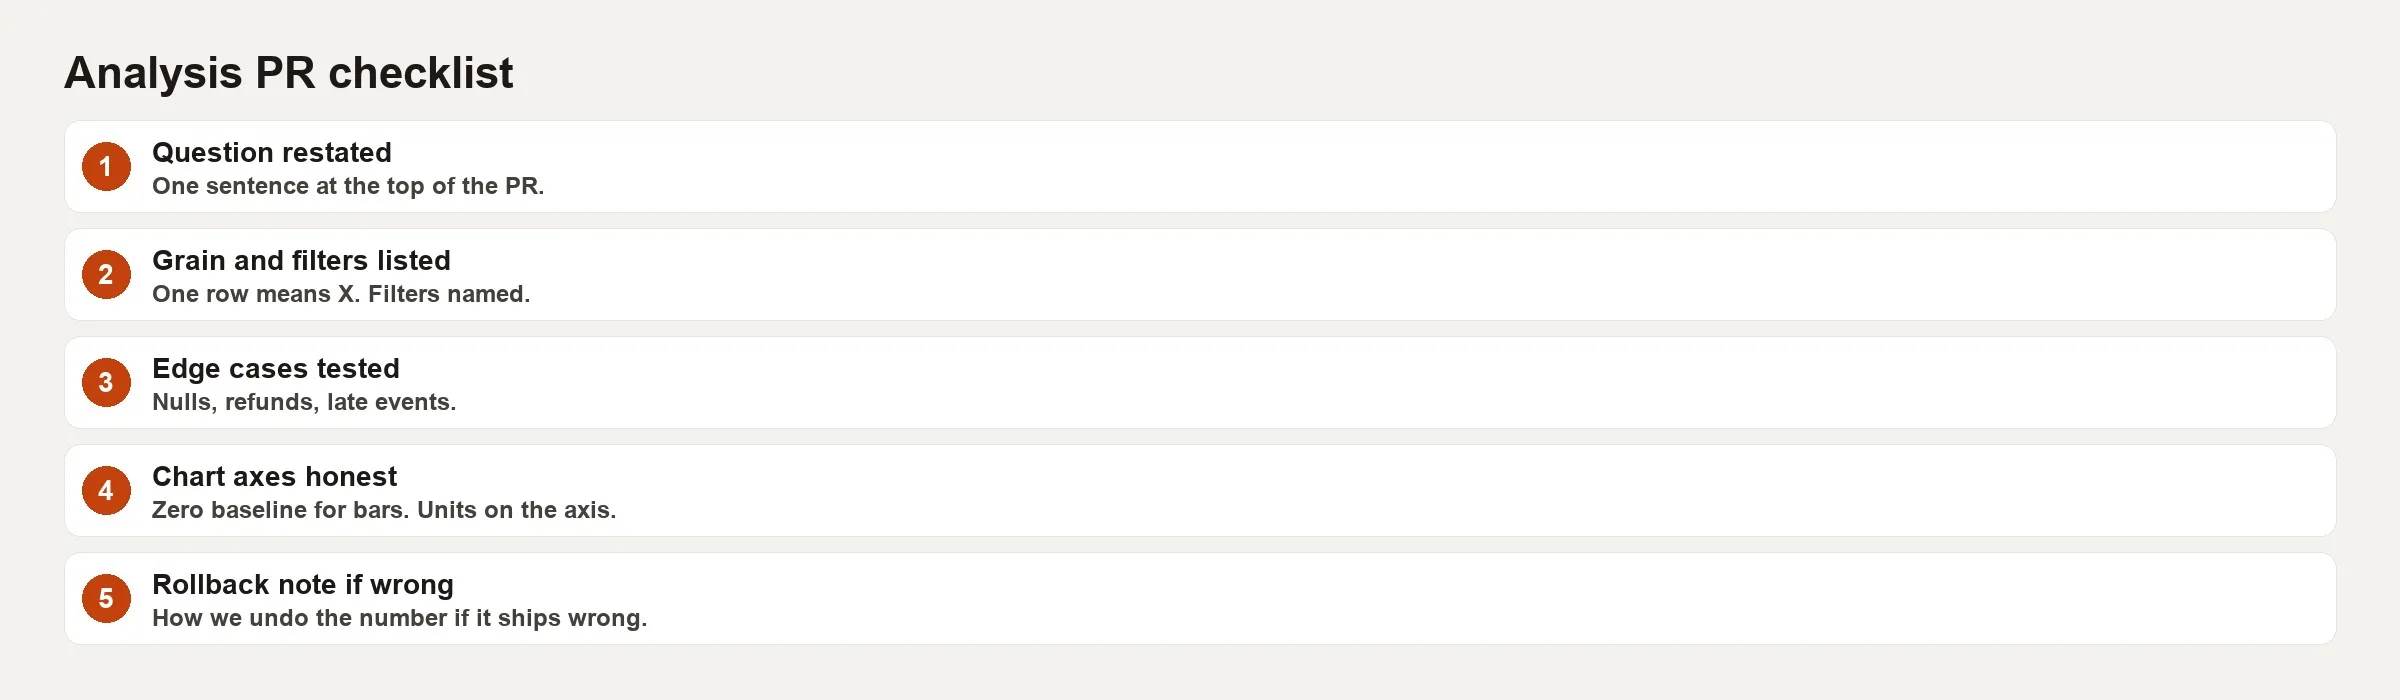
1. Question and scope
- What decision does this support?
- Who is the primary consumer?
- Is this exploratory, recurring, or certified?
- What is explicitly out of scope?
2. Grain and entities
- One row means ___ (finish the sentence).
- Primary keys are stated and uniqueness is checked.
- Aggregations match the grain (no accidental person-level averages mixed into account-level sums).
3. Filters and business rules
- Every filter is explained in the PR text, whether it removes test users, refunds or certain status codes.
- The if-then logic (written as CASE in SQL) matches the written definition.
- Empty values are handled on purpose and do not silently drop rows.
4. Joins and fan-out
- Join keys listed.
- Row counts before and after each risky join.
- Many-to-many risks are called out, with a plan for removing duplicates if needed.
5. Time logic
- Timezone and week-start conventions stated.
- The time an event happened is kept separate from the time it was processed, if both exist.
- Late data and backfill behavior described.
- Period comparisons use aligned windows.
6. Lineage and inputs
- Upstream tables or extracts listed.
- Freshness expectations noted.
- If AI drafted the SQL or code, the steps used to verify it are listed (see how to check AI-written SQL).
7. Tests and validation
- At least one automatic or scripted check for uniqueness, empty values or out-of-range numbers.
- Spot-check against a known period or a second method.
- An impact preview that shows the old and new metric for the last several periods.
8. Narrative and consumer impact
- The PR description explains the change in business words first.
- Dashboard titles, metric descriptions, or catalog entries updated.
- Communication plan for breaking changes.
- A way to undo the change exists, such as reverting it, switching it off with a flag, or running the old and new versions side by side for a while.
Sources
- GitHub Docs, about pull requests and review culture: https://docs.github.com/en/pull-requests.
- dbt Labs, testing and documentation guidance for analytics engineering: https://docs.getdbt.com/docs/build/data-tests.
- Google Site Reliability Engineering (SRE) Book, chapters on meaningful monitoring and release discipline (concepts transfer to metric changes): https://sre.google/sre-book/table-of-contents/.
- PostgreSQL documentation (join behavior and aggregation reference): https://www.postgresql.org/docs/current/.
- The Turing Way, peer review and reproducible collaboration practices: https://the-turing-way.netlify.app/.
- International Organization for Standardization (ISO) and International Electrotechnical Commission (IEC) 25010 software quality model overview (quality characteristics useful when framing review criteria): https://iso25000.com/index.php/en/iso-25000-standards/iso-25010.
Keep going
Same lessons in your feed
Short diagrams, hooks, and weekly tutorials on Substack, Instagram, X, and Facebook.