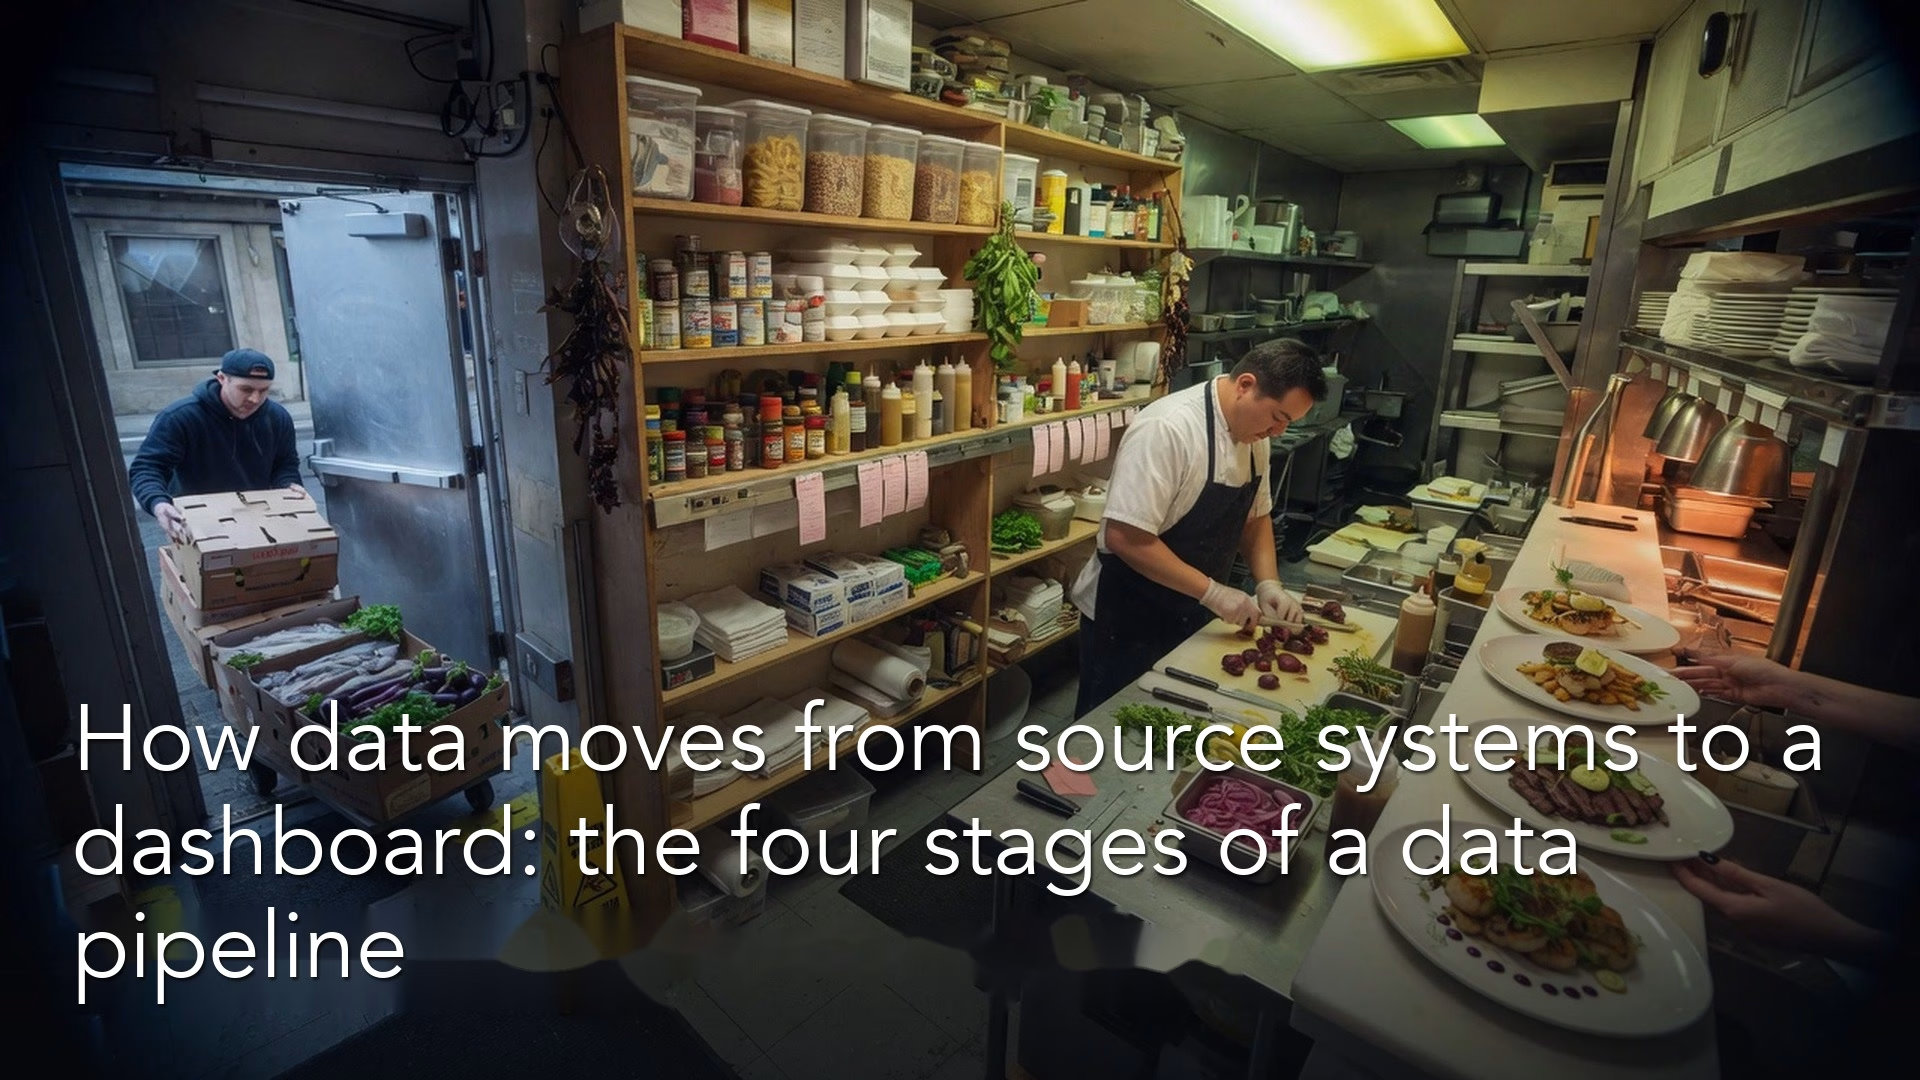
Data moves through four stages on its way to a chart, and knowing those stages is the fastest way to work out where a wrong number went wrong. Say you open a dashboard on Monday and the number is plainly wrong, and not just a little off from seasonality. You ask the person who built the report last year, but they have left the company. You open the data warehouse, where the company keeps its analysis-ready data, and find six tables with almost the same name and three scheduled jobs that all claim to be the original source. A coworker says “check the pipeline,” and you nod as if that sentence has a single meaning.
This post opens How data actually moves, a series for analysts who inherit pipelines (the chains of steps that carry data from one place to another), debug broken numbers, and need a mental model before the vendor slides start. We are not picking a cloud brand. We are naming the path that every serious analytics setup walks, even when the tools change: sources → land → transform → serve.
Why analysts need a path, not a product list
Most “data engineering” content starts with tools such as Fivetran, Airbyte, dbt, Spark, Kafka, Snowflake, and BigQuery, and the list never ends. Tools matter, but starting with them is how you memorize logos and still cannot explain why yesterday’s orders table is empty.
As an analyst, you do not need to design the entire platform. You do need to answer four questions when a number looks weird.
- Where did this data start out?
- Where was it stored first after it was pulled out of that system?
- What cleaning, joins, and business rules changed it?
- Which table or file is the dashboard (or export, or model) actually reading?
Those four questions are the four stages. If you can walk through them, you can work well with engineers, write better tickets, and stop treating the warehouse as a magic box that “should just be right.”
Rule of thumb: If you cannot name the stage where a number went wrong, you are debugging a hunch and not a pipeline.
The four stages: sources, land, transform, serve
Here is the path as a single line. Real setups add branches, retries, and side tables for exceptions, but the line still holds.

1. Sources: where data starts out messy
Sources are the systems where a real-world event was first recorded. Orders live in a checkout database or an ecommerce platform, and support tickets live in a help desk. Product usage lives in an events store or a software-as-a-service analytics tool. Financial records may live in an enterprise resource planning (ERP, the system that runs a company’s finance and operations) system, marketing spend lives in ad platforms, and staff records live in a human resources information system (HRIS). None of these systems were built to make your weekly board report easy.
That is not a complaint. These systems are built to record one order quickly, charge a card, or assign a ticket. They care about the current state and not about historical analysis. When you pull from a source, you inherit what one row means, how it stamps time, which records it only hides instead of deleting, and its history of “we fixed that field last March.”
A good analyst habit for sources is to write down the original system and the event or thing you care about. “Revenue” is not a source, but Stripe charges, Shopify orders, or the invoice table in the ERP might be. If two sources both claim to hold revenue, you have a definition problem before you have a pipeline problem. That is the same discipline you use when you define metrics, as in the metrics series: which says to name the thing before you count it.
2. Land: copy first, argue later
Landing is the first lasting home of data after it leaves the source. Teams call this a raw zone, a bronze layer, an ingest area, a staging area, or “the dump tables.” The name matters less than the rule, which is to land data as close to its original shape as you can afford, with enough labels attached that you can reprocess it later.
Why land the data at all? Because sources change, limit how often you can ask, and forget things. Landing gives you a frozen copy from one point in time. If finance changes a status mapping next quarter, you can rebuild the later steps from the landed history and skip replaying every request to the source from 2019.
Landing is not the same as cleaning. In a healthy path the raw tables still look a little ugly on purpose, because ugly raw data is honest. Pretty raw data often means someone already applied business rules that you cannot see. When your dashboard is wrong, you want a place where you can ask whether the source sent this or whether your own team invented it.
Where that land zone lives depends on the design. Object storage and data lakes, which are big piles of files, are common for files and events. Raw sections of a warehouse are common for extracts from relational databases. A later post in this series compares warehouses, lakes, and application databases. For now, remember the job of a landing zone: a lasting copy that matches the source and can be reprocessed.
3. Transform: turn copies into business language
Transform is where analytics work becomes readable. You join customers to orders, filter out test accounts, map status codes to “won,” “lost,” or “open,” and convert time zones. You also apply the rules for when revenue counts and remove duplicate identities. The result is a set of tables that a person can query without reading the source system’s documentation late at night.
Transforms may be SQL (the language used to ask databases for data) models, Python jobs, saved database procedures, spreadsheet macros that somehow became a production system, or a mix. Modern teams often keep transforms as versioned code inside the warehouse, and dbt-style models are one popular pattern. Older setups transform the data before loading it. That difference is the ELT versus ETL conversation. In ELT (extract, load, transform), you copy the data in first and transform it in the warehouse. In ETL (extract, transform, load), you transform it before or during the load. If you need a refresher on that tradeoff, start from the Learn hub and the existing posts on ETL and storage.
What matters for analysts is who owns the business rules. Whether a trial conversion counts on the signup day or on the day of the first paid invoice is not a technical setting. It is a product and finance decision that someone wrote into a transform. When numbers disagree across teams, about half the time the extract is fine and the two transforms simply encode two different answers.
Quality work lives here too. Checks for blank values, duplicate keys, unexpected values, and sudden changes in row counts catch drift early. That is the bridge to the data quality series: a pipeline that moves fast without checks is just a rumor delivery service with better uptime.
4. Serve: what people actually touch
Serve is the layer that people believe is “the data.” It includes business intelligence (BI, the reporting tools a company uses for dashboards) datasets, shared metric definitions, syncs that push data back into the customer system, exports to finance, tables that feed models, CSV files for a partner, and even the spreadsheet that is still the monthly close. Serving is packaging. It means stable names, a documented meaning for each row, access controls, and a refresh schedule that someone can trust.
A common failure looks like this. The transform layer is solid, but five dashboards each rebuild their own filters in the BI tool, and suddenly “active customers” has four definitions again. Serving well means the definition lives in one place, before the chart, and the chart is mostly presentation.
Another common failure is that nobody documents which served table is certified. An analyst finds a convenient table named orders_v2_final and ships a board slide. Six months later engineering drops that table because “nothing depended on it.” Serving is also a promise between people, and if a table is public it needs a steward, meaning someone who looks after it.
How the path shows up in job titles and tickets
You will not always own all four stages, but you still need to know who does.
| Stage | Typical work | Who often owns it | What analysts contribute |
|---|---|---|---|
| Sources | Connections to other software, change feeds, dumps, and application databases | The platform team and the app engineering team | Name the fields and events you need |
| Land | Ingest jobs, raw table groups, and files | Data engineering or the platform team | Flag missing extracts and data that arrives late |
| Transform | SQL models, tests, and documentation | Analytics engineers, data engineers, and senior analysts | Definitions, tests, and knowledge of the business area |
| Serve | BI models, exports, and data services | Analytics, BI, and product teams | Certified metrics and notes for the people who use them |
When a dashboard is wrong, write the ticket against a stage. A wrong dashboard filter belongs to serve, and a join that drops half of the orders after March belongs to transform. A raw table that has been empty since Saturday belongs to land or source, and a source system that changed its status codes belongs to source, with a transform update to follow. Vague tickets bounce around, while tickets tied to a stage get fixed.
Worked example: weekly revenue for a small subscription product
Imagine you inherit a “Weekly Revenue” tile that leadership trusts until it disagrees with finance. Your job is not to rebuild the company’s whole setup. Your job is to walk the path.
Map the stages on paper first
| Stage | What you find | Risk if wrong |
|---|---|---|
| Source | The billing system, with invoices and refunds | The wrong original system compared with the bank deposits |
| Land | raw.billing_invoices nightly extract | Missed nights, partial pages of data, or the source slowing you down |
| Transform | mart.revenue_daily with refunds netted | Gross versus net, time zones, and test accounts |
| Serve | BI dataset “Finance KPIs” used by the tile | An extra filter that exists only in the chart |
Already you have places to look, and you do not start by rewriting SQL at random. You start by asking whether the tile’s number matches mart.revenue_daily, whether that table matches the raw data, and whether the raw data matches a sample pulled from the billing screen.
A tiny SQL sketch of the transform
The real model may be fifty lines long with tests. The idea often looks like this.
-- conceptual transform (not a full production model)
SELECT
  CAST(invoice_ts AS DATE) AS revenue_date,
  customer_id,
  SUM(amount_usd) AS gross_amount,
  SUM(refund_usd) AS refund_amount,
  SUM(amount_usd) - SUM(refund_usd) AS net_revenue
FROM raw.billing_invoices
WHERE is_test_account = FALSE
  AND status IN ('paid', 'partially_refunded')
GROUP BY 1, 2;
Here is what that kind of model tries to produce, using made-up numbers.
| revenue_date | customer_id | gross_amount | refund_amount | net_revenue |
|---|---|---|---|---|
| 2026-03-01 | C-104 | 120.00 | 0.00 | 120.00 |
| 2026-03-01 | C-221 | 80.00 | 20.00 | 60.00 |
| 2026-03-02 | C-104 | 0.00 | 40.00 | -40.00 |
Say the tile shows $180 for March 1, the mart shows $180, and finance says $160. You are not facing a dashboard formatting problem. You are facing a definition problem, because finance may exclude refunds posted later, or use the invoice date instead of the payment time. The path did not fail silently. It encoded one business rule, and another team used a second one.
Ownership card for the same pipeline
Write this card once and pin it where the team works.
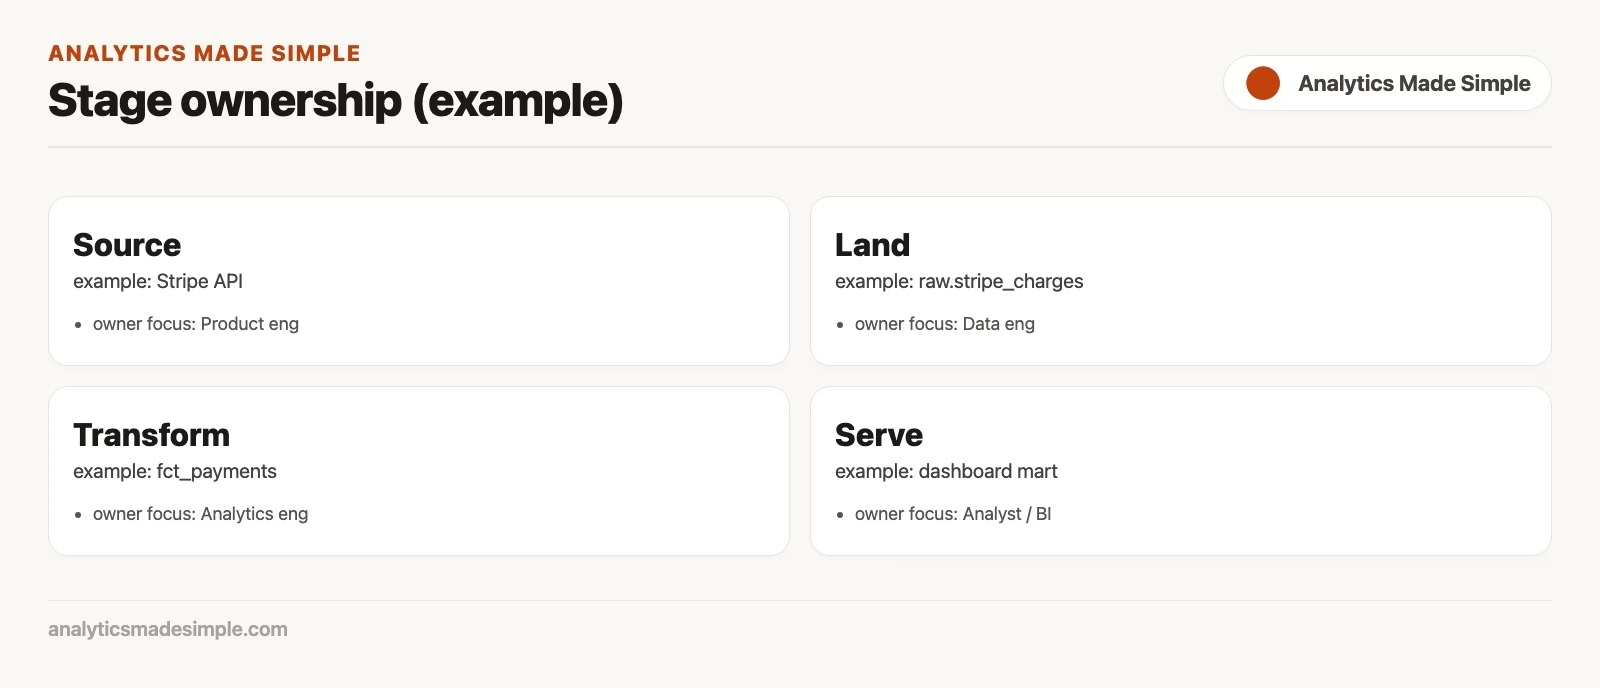
| Stage | Owner | Escalation signal |
|---|---|---|
| Source (billing service) | The payments engineers | Errors from the service, or a field that was renamed |
| Land (nightly extract) | The data platform team | Row count drops by more than 20%, or the job fails |
| Transform (mart) | Analytics engineering | A test fails, or the metric definition changes |
| Serve (BI tile) | A finance planning analyst and the BI team | The chart filter drifts, or the tile reads the wrong dataset |
The ownership card prevents the worst kind of meeting, where everyone stares at the tile and blames “the data” as if data were a person.
ETL, ELT, and other acronyms without the fight
You will hear ETL (extract, transform, load) and ELT (extract, load, transform). Here is where each step fits in the four-stage path.
- Extract always starts at the sources.
- Loading into the landing zone always happens somewhere.
- Transform happens either before the load, using classic ETL tools outside the warehouse, or after the load, using ELT-style transforms inside the warehouse or lakehouse (a lake and warehouse combined).
- Serve always comes after the transforms, whichever loading order you chose.
Cloud warehouses made ELT common because they run SQL at large scale and make it cheap to keep the in-between tables. That does not make ETL wrong. Some regulated flows still transform and check data before it is allowed into a shared store, and some event paths transform data in stream processors before anything lands. Your job as an analyst is to ask where the business rules run and whether you can re-run them from the raw data, and not to win a vendor debate.
If your company is still choosing where to store data, whether a warehouse, a lake, or just a plain database like Postgres, treat that as related reading in the storage posts on this site. If you write SQL for a living, the SQL series is the language layer on top of whatever lands and transforms. If you clean and reshape extracts in Python, the Python series covers the analyst-side skills that often fill the gaps while the formal pipeline catches up.
A 15-minute reverse-engineering checklist
When you inherit a number and have almost no documentation, run this quick audit of the path before you rewrite anything.
- Open the dashboard or export and write the exact metric title and filters you see, because the exact title and filters are what you will need when you ask where the number came from.
- Identify the table or file that gets served (a dataset, view, or extract), and note its name.
- Find the transform that builds it, such as a model file, a saved procedure, or a notebook (a document that mixes code and its results) job, and describe in one sentence what one row means.
- Find the landed or raw inputs and confirm when they last loaded.
- Name the source system in business words, such as billing, the customer system, or the app database, and not only by its technical name.
- Write one open question for each stage you could not fill in. Those questions become tickets or coffee chats.
Fifteen minutes of mapping the path often saves fifteen hours of guessing at joins. It also shows respect for the people who built the setup under deadline pressure, since most inherited messes were reasonable once. Your job is to make the current path readable again.
What good enough looks like for an ordinary setup
You do not need a design that belongs in a magazine to be useful. You need the following.
- Known sources with named owners
- A land zone you can query or at least inspect
- Transforms kept as versioned code, and not only as a pile of calculated fields inside a BI tool
- A short list of served tables that are certified for decisions
- Basic checks on how fresh the data is, how many rows arrive, and whether keys are unique
- A place where definition changes are written down
That list is deliberately boring, because boring pipelines make interesting analysis possible. Exciting, undocumented pipelines only make exciting outages.
Common mistakes
- Treating the dashboard as the source of truth. The dashboard is only the last stage. The truth lives upstream, or it does not exist.
- Cleaning only in the BI tool. Every chart reinvents its filters, so definitions drift apart by Tuesday.
- Pretty raw tables. If the landing zone already applies heavy business rules, you cannot rebuild when the rules change.
- No statement of what one row means. Writing “one row is one invoice line on payment day” prevents half of all join disasters. It is the same idea as the tidy data habits elsewhere on this site.
- Two hidden pipelines. Marketing has one revenue path and finance has another, and both call themselves official.
- Tickets with no stage in them. “Numbers wrong” is not something anyone can act on, but “the landing job missed the 3/12 extract” is.
- Assuming more tools fix ownership. A new scheduling tool without owners is only a faster way to ship confusion.
- Skipping quality checks until after a public mistake. Tests are cheaper than apologies in front of the whole company.
Quick recap
- Data moves through sources, land, transform, and serve, even when tool names change.
- Landing keeps copies that match the source, so you can rebuild later.
- Transforms turn the data into business terms, and they should be versioned and testable.
- Serve is what people touch, and it should not rebuild the core definitions.
- ETL and ELT are two loading orders inside the same path, and neither is the one true way.
- Tickets that name a stage, plus ownership cards, turn “data is wrong” into work someone can finish.
How to practice this week
- Pick one number you personally report or use in a weekly meeting.
- Write a one-page path that names the source system, the landing table, the transform table, and the served table. Leave blanks if you must, because the blanks are findings.
- For each stage, write one owner, either a person or a team, and not a tool name.
- Compare the served number with the transform table for the same day, and note any filter that exists only in the BI tool.
- Open one raw or landing table and confirm you can explain three of its columns without guessing.
- Optional: draft a definition sentence for the metric and link it to the transform, the way you would in a metrics spec.
Series notes: This is Part 1 of How data actually moves. The next post covers batch versus streaming in plain English, including when waiting until tomorrow is the right design. For broader learning paths, use the Learn hub. When governance language shows up (who may access what, what “official” means), the data governance key term page is a useful companion, but it does not replace a working map of the path.
Sources
- dbt Labs. “About dbt” and docs overview (models, tests, and analytics engineering concepts). https://docs.getdbt.com/docs/introduction
- Apache Airflow documentation. “DagRun” and core concepts (how scheduled work relates to pipelines). https://airflow.apache.org/docs/apache-airflow/stable/core-concepts/overview.html
- Google Cloud. “What is a data warehouse?” (vendor-hosted intro useful as a neutral mental model). https://cloud.google.com/learn/what-is-a-data-warehouse
- Snowflake. “Key concepts” overview (warehouse-oriented analytics concepts, example not endorsement). https://docs.snowflake.com/en/user-guide/intro-key-concepts
- Kimball Group. “Data warehouse bus architecture” and dimensional modeling primers (classic serve-layer thinking). https://www.kimballgroup.com/data-warehouse-business-intelligence-resources/kimball-techniques/kimball-data-warehouse-bus-architecture/
Keep going
Same lessons in your feed
Short diagrams, hooks, and weekly tutorials on Substack, Instagram, X, and Facebook.