You do not need Python for every analysis, and you do not need to apologize for reaching for it when a spreadsheet would force you through a maze of copy-paste steps. The real skill is choosing the right surface for the job, whether that is Sheets, SQL, or Python, without turning your tool preference into your identity.
This is the opening post in Python for analytics, a series for people who already speak spreadsheet and a bit of SQL and who want to open a notebook without panic. It starts with judgment: when Python earns its keep, when it is overkill, and how the three tools combine in a normal weekly workflow. If you are building foundations first, pair this post with Analytics foundations and the practical path in From spreadsheets to real data.
Three tools, one decision problem
Most analytics work is not really “write code.” It is get trustworthy rows, shape them for a question, check the answer, and hand something off, and Sheets, SQL, and Python all do their own version of that same loop. They differ in where the data lives, how repeatable the steps are, and how painful the next person will find your work when they open it.
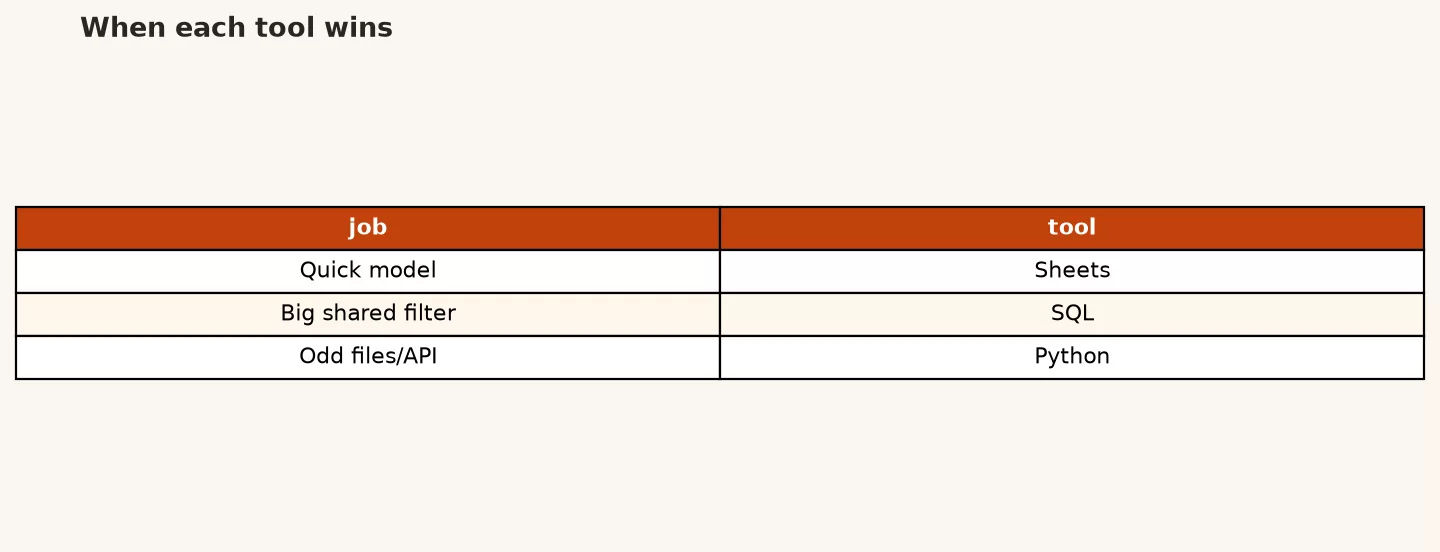
Think of them as three desks in the same office, not three competing religions.
- Sheets are a visible grid, which makes them great for small tables, quick math, shared review, and “can we try this filter live in the meeting?”
- SQL is a question language you point at data that already sits in a database or warehouse. It is great when the source of truth is large, shared, and versioned by people who care about who can see what.
- Python is a general-purpose environment. With libraries like pandas, it treats tables as programmable objects, so you can load, clean, join, loop, model, and export in one place. It is great when the path from raw file to answer is a short script you want to rerun without clicking through menus.
If you remember one line from this whole post, make it this one: pick the tool that matches grain, size, and reuse, not the tool that matches your insecurity.
When Sheets wins
Stay in Sheets when the table is small enough to see all at once, the logic is light, and collaboration is half the point of the exercise.
Classic wins:
- A budget scenario with ten line items and three what-if cells the CFO (chief financial officer) wants to poke during the call.
- A meeting where five people need to sort, comment, and spot a wrong category in real time.
- A one-off list, such as “here are 40 vendors, flag the ones over $5,000.”
- Exploratory layout work for a slide, back when you are still deciding what the story even is.
Sheets also win as a handoff surface, since many stakeholders will never open a notebook. Exporting a clean CSV (a plain text table of rows and columns) into a shared sheet for review is not failure; it is product thinking. The spreadsheet series on this site exists partly because messy multiplayer sheets become liabilities, but that does not mean “never Sheets.” It means knowing when the grid is a sketchpad and when it has quietly become a fake warehouse.
You might not need Python yet if your weekly job is: download a 2,000-row report, add two columns, pivot by region, and paste into a deck. Forcing pandas (a Python library for tables) onto that workflow can cost more setup time than it saves, especially while your environment is still new to you.
When SQL wins
SQL wins when the data already lives in a system built for many users and many rows. Filtering, joining, and totaling close to the source is usually faster and safer than downloading everything onto a laptop and hoping your local copy is still the real one.
Classic wins:
- Warehouse tables with millions of events, where you only need last month’s orders for two countries.
- Definitions that should live in one place, such as “active customer” saved as a view everyone can query the same way.
- Joins across systems that already land in the same warehouse, such as CRM (the software your sales team uses to track customers), billing, and product data.
- Auditable extracts, where the query itself is the recipe and the database enforces who is allowed to see what.
If your team already has solid SQL habits from something like the SQL series, or from your own company’s tutorials, lean on them. Python is a poor first substitute for “I do not want to learn joins,” because joins in pandas are the same logic with different spelling. Moving your confusion into a new language does not remove the confusion; it just relocates it.
SQL also wins for stable metrics pipelines. When finance needs the same revenue cut every Monday, a warehouse query or a scheduled transformation is usually more trustworthy than a personal script someone might forget to run. Python can sit downstream of SQL, or schedule itself to run automatically, but the default home for a number everyone relies on is often still the warehouse.
When Python wins
Python earns its keep when the work is awkward in a grid, awkward as plain SQL, or when you need a repeatable local pipeline that turns files and APIs (the connections apps use to pull data from each other automatically) into a clean output.
Classic wins:
- Messy files: multi-sheet workbooks, odd headers, mixed date formats, and “notes” columns that need parsing out.
- Repeating the same ten cleaning steps every week on a vendor export.
- Logic that is easier as small functions, such as “for each customer, pick the first paid invoice after their trial ends,” with all the edge cases that come with it.
- Mixing data work with other code, whether that is calling an API, writing a report file, running light statistics, or, later, building charts and models.
- Exploratory analysis where you want a log of what you actually tried, instead of a fragile chain of sheet tabs named after your mood that afternoon.
Python is also the bridge when SQL got you 80% of the way and the last 20% needs real programming. Pull a filtered extract with SQL, shape it in pandas, and export a summary table for the deck. That hybrid is normal professional work, not a failure of purity.

Use the chooser above as a conversation starter with yourself, not as a law. Edge cases exist, and your company’s own tools matter more than any chart. Still, if you cannot say which box you are in, pause before you open a new tab or a new notebook.
Decision matrix: tool by job
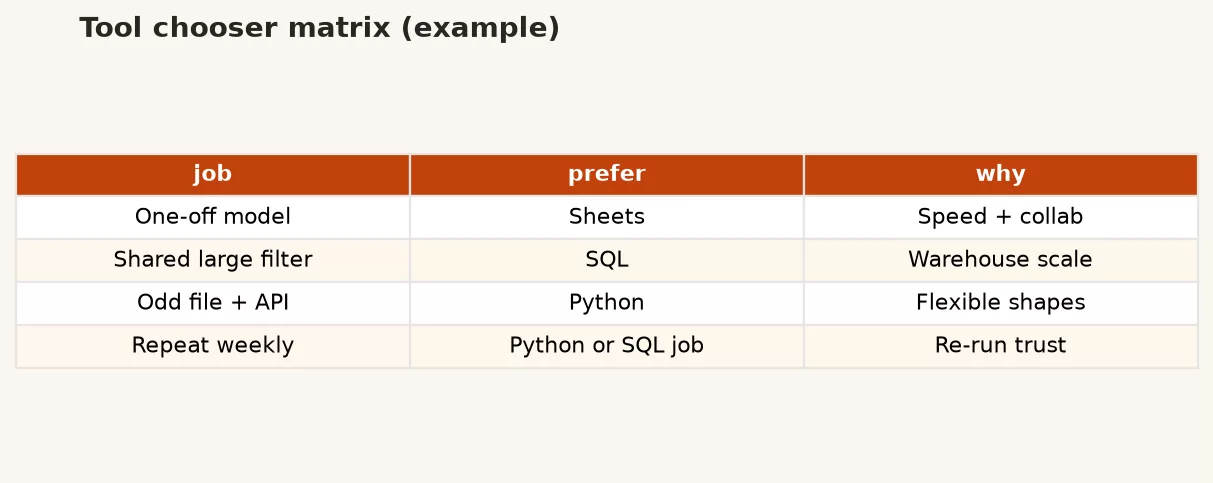
Here is a practical matrix. “Primary” means start there. “Secondary” means a common next hop. “Usually skip” means you can do it that way, but you are often paying a tax for it.
| Job | Sheets | SQL | Python |
|---|---|---|---|
| Quick what-if with a stakeholder in the room | Primary | Usually skip | Usually skip |
| Filter and aggregate a warehouse table | Secondary (after export) | Primary | Secondary |
| Weekly clean of a vendor CSV | OK once | If landed in DB | Primary when it repeats |
| Join three large tables with keys | Painful | Primary | Fine after extract |
| Parse messy text fields and dates | Fragile formulas | Possible, often ugly | Primary |
| Shared metric definition for the whole company | Risky as source of truth | Primary (view/model) | Script as helper, not sole truth |
| One-off 50-row checklist | Primary | Overkill | Overkill |
| Repeatable analysis you will rerun next quarter | Weak | Strong if data stays in DB | Strong if files/APIs/local logic |
| Light statistical check or custom loop logic | Awkward | Limited | Primary |
| Pretty pivot for a live meeting | Primary | Export first | Export first |
Notice the pattern: Sheets for small and social work, SQL for large and shared data at rest, and Python for messy, repeatable work on the laptop or in a scheduled job. The middle of the matrix is where hybrids shine.
The cost of switching tools
Every hop between tools carries a tax: export time, format bugs, lost context, and the classic “which file is the latest one?” problem. Switching is not free just because it feels familiar to reach for a new tool.
Common expensive hops:
- SQL to Sheets for everything. You pull 400,000 rows because filtering in the sheet “feels easier,” and then the sheet freezes while the definition of an active user quietly drifts as people edit cells by hand.
- Sheets to Python as a status symbol. You rewrite a five-minute pivot as a twenty-line script you do not yet know how to debug, and the meeting starts without you while you are still stuck on a typo.
- Python to email CSV without a contract. You send “results_v3.csv” with silent row filters nobody else can see, and the next week someone multiplies the wrong total in a board deck.
A healthy rule: switch tools when the new tool removes a real friction you already felt, not when a blog post made you feel behind. If SQL already returns the monthly summary you need, stop there. Paste it. Go outside.
Another cost is cognitive load, because each environment has its own way of breaking. In Sheets it is accidental edits and formula drag errors. In SQL it is the wrong join grain and silent duplicate rows. In Python it is environment mess, path issues, and “it works on my machine.” Paying all three of those taxes in one afternoon is a great way to ship nothing at all.
Workflow combinations that work in real jobs
Here are patterns you will see on healthy teams. Steal them for your own week.
SQL extract, Python clean, Sheets share
Query the warehouse for the narrow slice you need, clean and aggregate it in Python, then export a small table for stakeholders to review in Sheets. You keep the heavy lifting off the grid while keeping the review step friendly for people who will never open a notebook.
Python for files, SQL for the landing zone
A vendor drops CSVs in a folder every week. Python standardizes them, the results load into a table, and analysts query that table with SQL from then on. Python is the on-ramp here, not the forever front door.
Sheets prototype, SQL or Python productionize
You invent a metric in a sheet first, because thinking is faster there. Once the business agrees on the definition, you rewrite the logic as a query or a script so it stops living in one person’s Drive and becomes something the whole team can trust.
Stay put when reuse is low
If this analysis will never run again, the best tool is simply the one that finishes before lunch with an answer you can defend. Elegance is optional here. Clarity is not.
A Monday morning decision script
When a request lands, run this short script in your head before you open any tool at all:
- Where does the truth live right now? A shared warehouse, a vendor CSV, or a living sheet someone edits daily?
- How big is “all of it” compared with “what I need”? If you only need two countries for last month, do not download five years of global data.
- Will this run again? Once, weekly, or will it become a company metric? Reuse pushes you toward SQL definitions or a Python recipe you can rerun.
- Who needs to poke at the answer? If non-technical stakeholders need live filters, plan a small sheet handoff even if Python did the heavy lifting.
- What is the cost of being wrong? A high cost favors shared definitions and reviewable queries over a clever local notebook nobody else can run.
You will not always get clean answers to those five questions, but you will still land on better tool choices than “I saw a viral post about notebooks.” Analytics judgment is mostly matching constraints to the job in front of you, not collecting tool logos for your résumé.
If your workplace already standardized on one stack, respect that gravity. Teaching yourself Python at home while shipping SQL at work is completely fine. Rewriting the company’s whole metric layer in a personal environment with no owners and no tests is not rebellion; it is risk you are handing to people who did not agree to carry it.
Worked example: same job, three shapes
Suppose you have a small sales export and need total revenue by region for every region over $10,000. In real life the file might be huge, but for teaching, imagine a tiny table.
| order_id | region | revenue |
|---|---|---|
| 1 | East | 4200 |
| 2 | West | 8100 |
| 3 | East | 6900 |
| 4 | South | 1500 |
| 5 | West | 3200 |
Sheets approach: pivot region on rows, sum revenue, and filter or glance for totals above 10,000. East comes to 11,100, West comes to 11,300, and South stays at 1,500. For five rows, this is obviously the right desk for the job.
SQL approach, for when this lives in a table named orders:
SELECT
  region,
  SUM(revenue) AS total_revenue
FROM orders
GROUP BY region
HAVING SUM(revenue) > 10000
ORDER BY total_revenue DESC;
That stays just as tidy when orders has five million rows in it, because you never download the whole universe just to count a region total.
Python / pandas approach, for when you have a CSV on disk and will rerun the clean every Monday:
import pandas as pd

orders = pd.read_csv("orders.csv")

by_region = (
    orders.groupby("region", as_index=False)["revenue"]
    .sum()
    .rename(columns={"revenue": "total_revenue"})
)

result = by_region[by_region["total_revenue"] > 10000].sort_values(
    "total_revenue", ascending=False
)

print(result)
Same math, different home. The Python version becomes valuable once “orders.csv” is actually twelve files, three date formats, and a step that drops internal test orders using a rule SQL does not own yet.
Here is the punch line of this whole post, written as code comments: you might not need any of this yet.
# You might not need pandas yet if:
# 1) the table is small and shared review is the main goal
# 2) the warehouse already has a trusted view for this metric
# 3) this is a true one-off and Sheets already answered it
#
# You probably do need Python when:
# 1) the same clean steps repeat weekly
# 2) the file is messy enough that formulas become archaeology
# 3) you need a clear, rerunnable recipe from raw to deliverable
Common mistakes
- Learning Python to avoid learning grain. If you do not know what one row means, pandas will happily hand you a confident wrong answer. Fix the grain first, since both the spreadsheet and foundations series hammer this point for a reason.
- Pulling the whole warehouse into memory because “Python can handle it.” Sometimes it can, but your laptop is usually not the warehouse, so filter in SQL first.
- Treating Sheets as a database. Multiplayer editing plus silent cell overwrites is not a storage strategy, no matter how convenient it feels on a Tuesday.
- Rewriting working SQL into Python for style points. Style points do not ship, and nobody on your team is grading your syntax.
- Skipping handoff quality. Whatever tool you use, name your columns, document your filters, and say plainly what one row means in the output.
- All-or-nothing identity. “I am a Python person” is not a workflow. “I use Python when the steps need a script” is a workflow you can actually follow.
Rule of thumb: if a stakeholder needs to poke the numbers live, prefer a small sheet. If the source of truth is large and shared, prefer SQL. If the path is messy and will run again, prefer Python.
What comes next in this series
This opening post was really about permission and judgment. The rest of the series is muscle memory, built step by step, and you can always return to Learn for the full map of series on the site.
- Setup without tears. Install Python, pick a notebook or editor, create a virtual environment, install pandas, and open a tiny CSV for the first time.
- DataFrames as tables. Rows, columns, types, and the pandas commands that show you the shape of a table, mapped back to sheets and SQL tables you already know.
- Selecting, filtering, and sorting. The pandas version of picking rows and columns, filtering them down, and putting them in order, the same jobs SQL’s row-picking commands handle.
- Aggregations and grouping. The pandas version of grouping rows and summing them up: split the data apart, do the math, then put it back together.
- Joins and merges. Matching keys across two tables without accidentally multiplying your row count by accident.
- Missing data and data types. Handling blanks, dates, and type conversions without silent wreckage to your numbers.
- A light cleaning pipeline. Small steps, run top to bottom, that you can reproduce the same way every time.
- Export and handoff. CSVs, tables, and chart tools that do not leave the next person guessing which file is real.
- Python and SQL together. Where each one wins inside the same project, including how to review any code a model generates for you before you trust it.
Plotting gets its own stretch even later. Do not stall this post waiting for pretty bars; get the table right first, and the charts will follow.
Practice and next step
Before you install anything, write three lines in a note:
- A task you should keep in Sheets this week, because it is small, collaborative, or a true one-off.
- A task that should stay in SQL, because it is a large shared table with a simple aggregate.
- A task that is a candidate for Python, because the file is messy, the clean steps repeat, or the logic is awkward anywhere else.
If you cannot name a Python candidate yet, that is fine. Still work through the setup steps next so the option exists when you do need it. Tool choice gets much easier once setup stops feeling scary.
Quick recap
- Sheets, SQL, and Python solve related problems from three different desks.
- Sheets win for small, visible, collaborative work.
- SQL wins for large shared data and stable definitions kept near the source.
- Python wins for messy, repeatable, programmable table work and hybrid workflows.
- Switching tools has a real cost, so switch to remove friction, not to perform expertise.
- This series teaches pandas step by step without asking you to abandon SQL or Sheets.
Series notes
This is the opening post of Python for analytics. Up next is setup without tears: install, a virtual environment, and your first tiny DataFrame, explained in plain language. Related paths on this site: Analytics foundations, From spreadsheets to real data, and the SQL series.
Sources
- Python Software Foundation, “What is Python?”: https://www.python.org/doc/essays/blurb/
- pandas documentation, “10 minutes to pandas”: https://pandas.pydata.org/docs/user_guide/10min.html
- pandas, “Group by: split-apply-combine”: https://pandas.pydata.org/docs/user_guide/groupby.html
- Analytics Made Simple, Learn hub: https://analyticsmadesimple.com/learn/
- Analytics Made Simple, Analytics foundations: https://analyticsmadesimple.com/series/analytics-foundations/
- Analytics Made Simple, From spreadsheets to real data: https://analyticsmadesimple.com/series/spreadsheets-to-data/
- Analytics Made Simple, SQL series: https://analyticsmadesimple.com/series/sql/
Keep going
Same lessons in your feed
Short diagrams, hooks, and weekly tutorials on Substack, Instagram, X, and Facebook.