Cleaning is the work everyone postpones because analysis feels more senior, but skipping it is how a chart ends up wrong. A trailing space, a date that is really text, or three spellings of the same status can each throw off a total. Cleaning is not glamorous, yet it is what keeps you from misleading people by accident.
This post belongs to the series From spreadsheets to real data. We stay in Google Sheets and Excel on purpose, because these are practical steps you can take before you touch Python or a data warehouse (a central database built for reporting).
Clean in a copy and keep the raw file untouched
Never clean on top of the only copy of an export. Keep a tab named raw_immutable (or a dated raw file) that nobody edits, and build your cleaned version on another tab or file. If you cannot undo a change, you cannot check your own work later, and nobody else can either.
A practical cleaning order
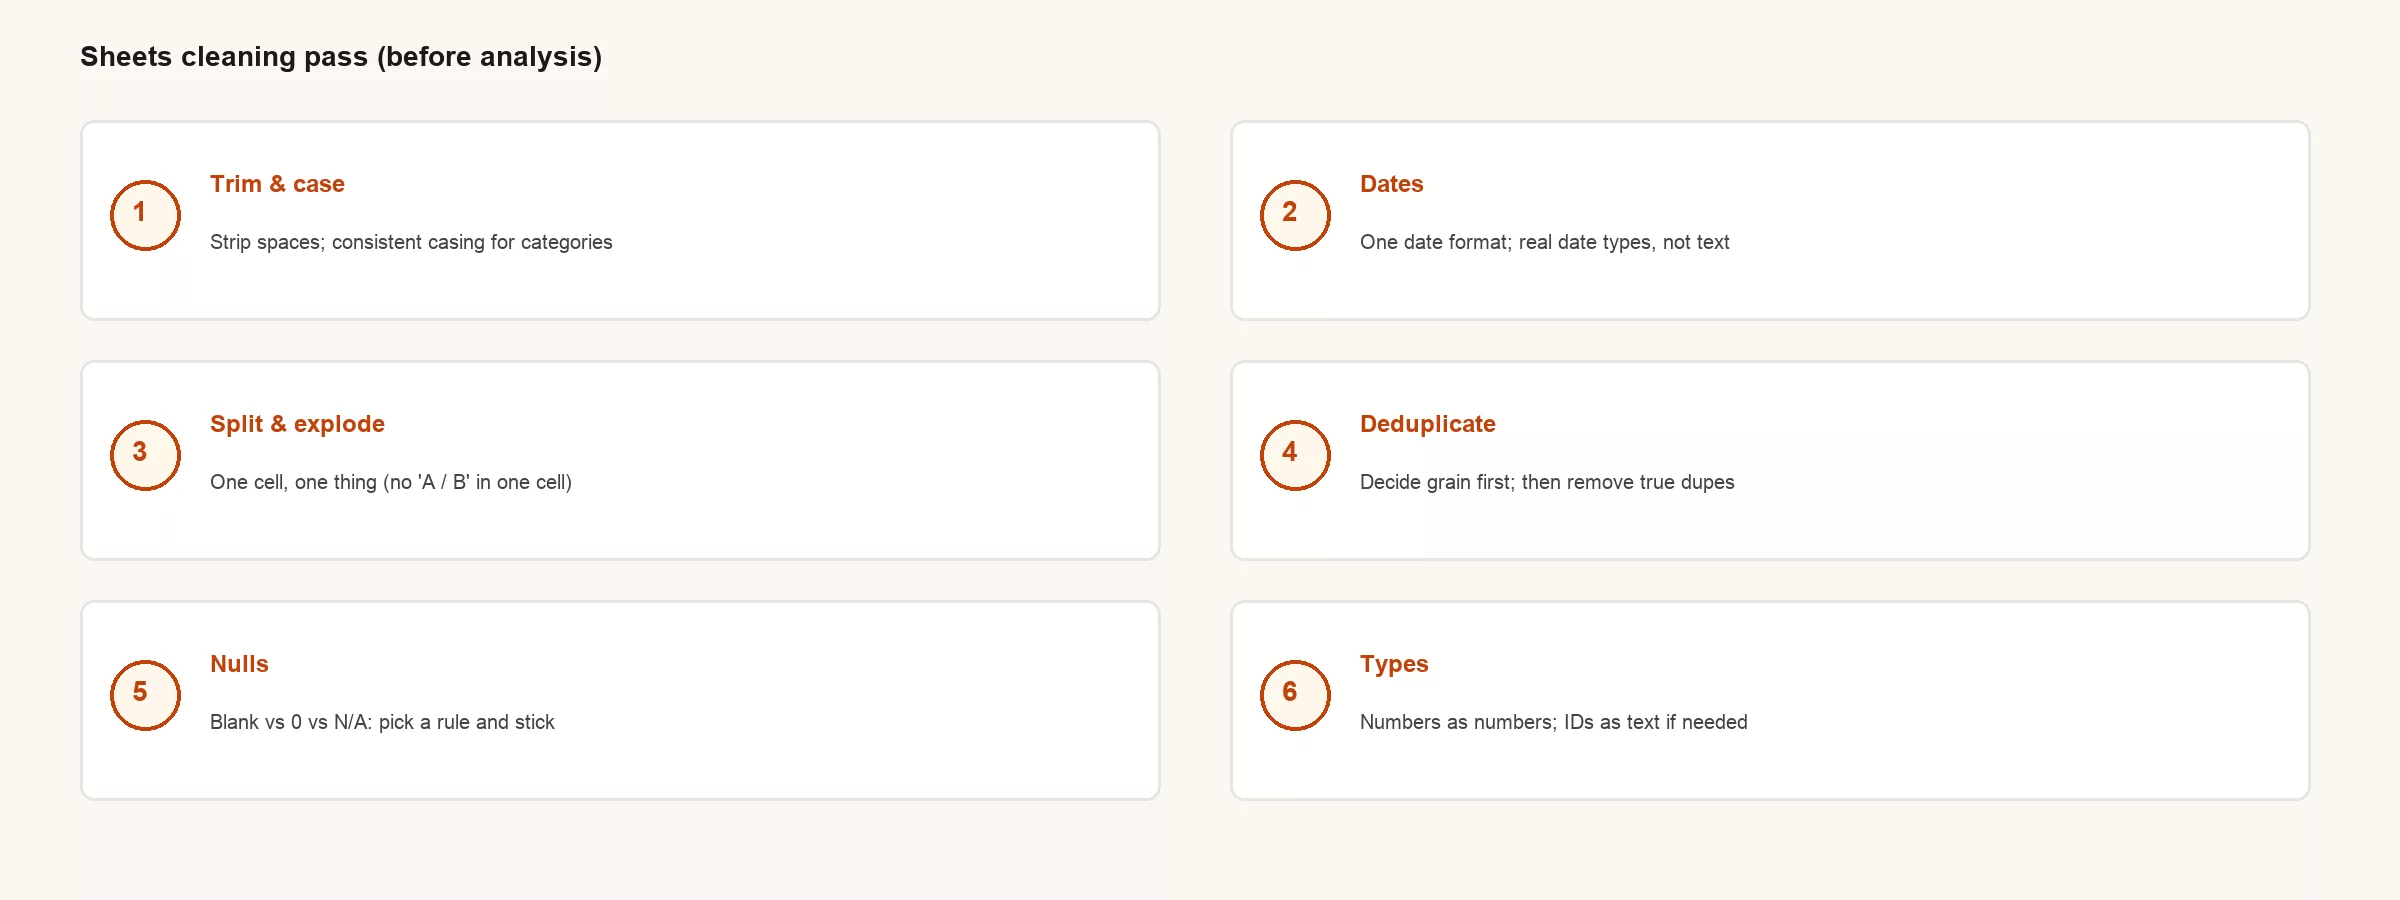
- Structure: tidy the headers, unmerge cells, and remove spacer rows, as the earlier post on tidy tables explained.
- Trim and normalize text: use the TRIM formula to strip stray spaces, and pick one style of capital letters for categories.
- Dates and numbers: convert them to real dates and numbers, and fix any dates stored as text.
- Split overloaded cells: keep one fact in each cell.
- Decide how to treat empty values: choose between blanks, zeros, and stand-ins like N/A.
- Remove duplicates: do this only after you know what one row is supposed to represent.
Trim and case
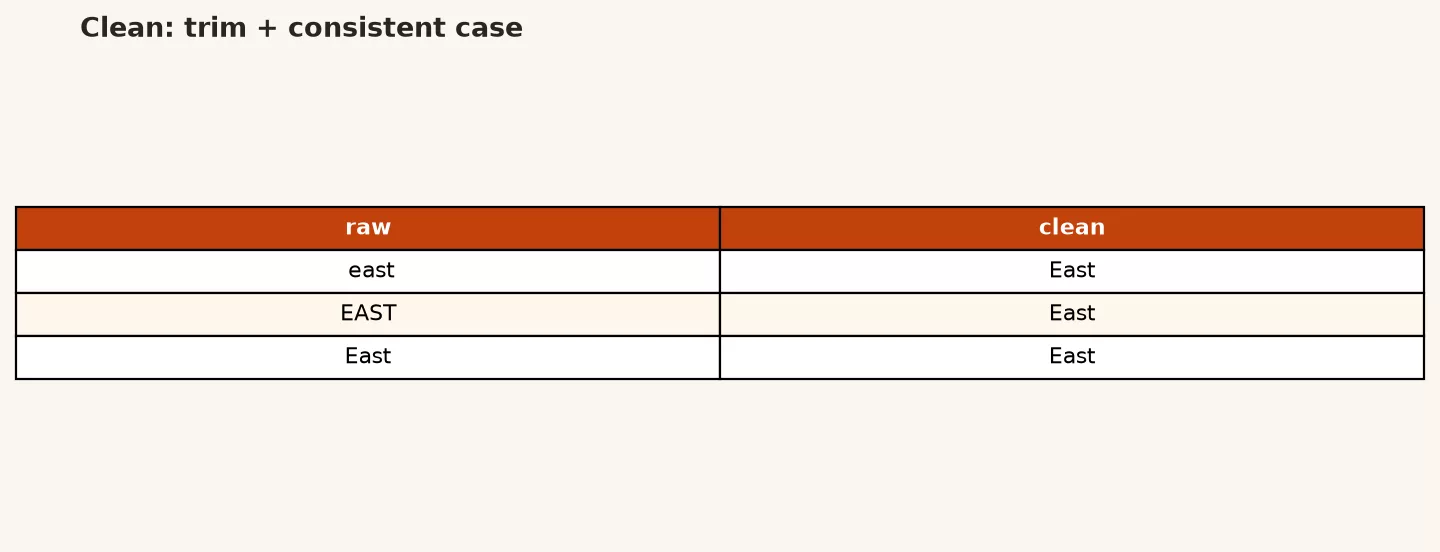
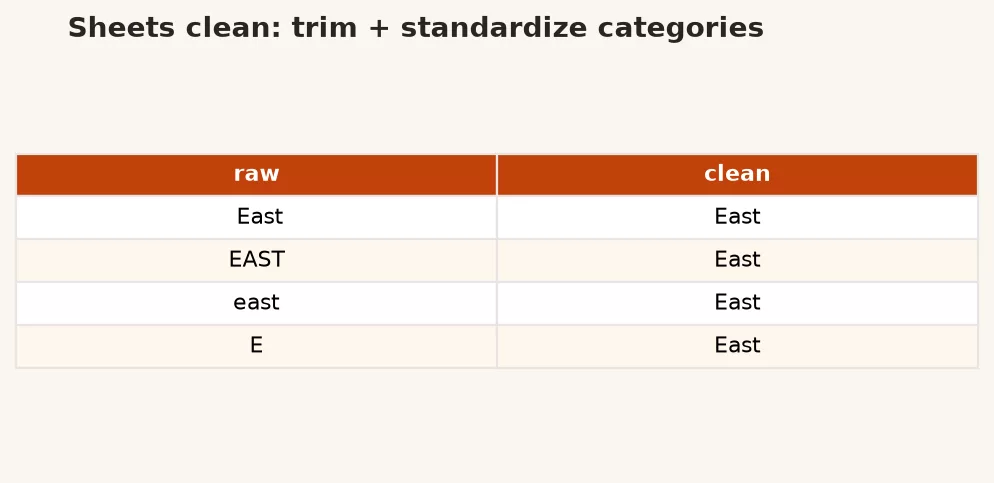
To a computer, “Open”, “Open ” with a trailing space, and “open” are three different categories. Trim the spaces, pick one rule for capital letters (first letter up or all lowercase), and stick to it. Free-text comments can stay messy. Fields that hold categories should not, because you will count and filter by them.
Dates are where silent bugs breed
If a date column is really text, sorting goes alphabetical instead of chronological, and filters stop working the way you expect. Convert the column to real dates. For handoffs, show them as year-month-day (2026-07-22), which no one can misread. Also watch for locale swaps, because 03/04/2026 means March 4 in one country and April 3 in another.
Removing duplicates without destroying history
Duplicate rows are not always errors. Two payments can belong to one customer and both be real. Decide first what one row should represent, which analysts call the grain: one row per invoice line, per invoice, or per customer per day. Then remove duplicates using the column that matches that choice. If the stakes are high, move the discarded rows into a separate holding tab instead of deleting them.
| Grain | Duplicate means | Keep |
|---|---|---|
| One row per order_id | Same order_id twice | One row; investigate |
| One row per order line | Same order_id many times | Expected |
| One row per customer | Customer appears twice | Collapse with rule |
Empty values and fake values
A zero can mean “we measured it and it was zero” or “we never got a number.” N/A can mean “does not apply” or “nobody checked.” Pick one convention for each and write it down. In files you plan to analyze, empty cells or clearly marked nulls work better than magic numbers like -999, unless everyone who touches the file has agreed on what the magic number means.
A short worked pass
Sheets-ish sequence (conceptually):
1) Data > freeze header
2) TRIM on category columns (helper column, then paste values)
3) Format > Number > Date on date columns
4) Split "City, ST" into city / state
5) Remove rows where id is blank
6) Data > Remove duplicates on id if grain = one row per id
Practice this week
- Take one export that arrives on a schedule, and create a raw_ tab and a clean_ tab from it.
- Fix one category column that has capitalization or spacing problems.
- Convert one text-date column into real dates, then sort it to prove the order is right.
- Write down what one row means in a notes tab before you remove any duplicates.
Common mistakes
- Removing duplicates before deciding what one row means.
- Cleaning the only copy of the raw data.
- Using color or cell comments to carry information that belongs in a real column.
- Fixing values by hand without a repeatable list of steps.
Treat cleaning as a routine, not a mood
Cleaning done differently each time produces numbers people trust differently each time. When the same export arrives every Monday, the cleaning steps should be a short checklist that a tired person can follow. If a step cannot be written down, it is folklore, and folklore neither scales nor survives an audit.
While you are learning, prefer helper columns over editing in place. Editing in place is faster but easier to regret, while a helper column shows the derivation, with raw_status sitting next to status_clean. Once the steps are stable you can paste the values and archive the helpers, or keep them if the sheet is small.
Category fields deserve a list of allowed values. If status must be open, pending, or closed, turn on data validation so the sheet rejects anything else. Free-text categories are where “done”, “Done”, and “complete” turn into three separate groups.
For dates, be careful with text pasted from PDFs and emails, because something that looks like a date may not sort like one. After converting, spot-check the earliest and latest dates. If the latest is in 2099 or the earliest is in 1905, you have a problem that will show up later as a strange chart.
Duplicates, keys, and honesty
Aggressive duplicate removal can erase real events. Two payments on the same day are not a glitch, while two identical rows from a double export might be. The statement of what one row means is what decides. When stakes are high, quarantine instead of delete, because deleting feels tidy and destroys evidence.
Keep operational fixes separate from analysis cleaning too. If you correct a customer name in your analysis copy, you have not fixed the customer system (the CRM). Push lasting fixes back to the source when you can, and otherwise label analysis-only corrections clearly so nobody mistakes them for the official record.
Time-box cleaning without skipping it
Good enough data still needs a minimum standard. Set a fixed budget, such as thirty minutes of cleaning for a two-hour analysis, and log what you did not finish. A chart with known dirt is better than a chart with unknown dirt, as long as the caveats travel with the number.
Putting it into daily practice
Think about the last time two dashboards disagreed. The argument was rarely about chart colors. It was about definitions, filters, and who changed a file without telling anyone. Spreadsheet discipline exists to make those arguments shorter and rarer, because time spent on keys, cleaning, and written rules is time you do not spend in emergency meetings.
A useful test for any process is whether it survives a vacation. If the owner disappears for two weeks, can someone else reproduce the number from written rules and one agreed file? If the answer depends on one person’s memory, you have a single point of failure wearing a friendly grid, so write down the boring parts while they are still small enough to remember.
Tools will keep changing: Sheets today, a warehouse tomorrow, a notebook (a document that mixes code, results, and notes) the week after. Habits transfer, and so do clear definitions and clear ownership. Hopeful name matching does not transfer, because it just fails again in a new tool.
Stakeholders often reward speed where everyone can see it and quality where nobody can. Part of your job is making quality visible with row counts, as-of times, lists of excluded rows, and links to definitions. Quality that people can see gets valued, while quality that stays hidden gets treated as optional polish and then blamed when something breaks in public.
None of this requires perfectionism. It requires a minimum standard in five places: structure, identity, cleanliness, handoff, and memory. Below that standard, analysis turns into theater. Above it, even simple tools can support serious work until you truly need heavier infrastructure.
If you teach only one sentence from this series to a new hire, make it this one: say what one row means before you add anything up. That single habit prevents a surprising share of wrong totals, broken joins, and confident nonsense in slides that look expensive.
Quick recap
Cleaning is a favor to your future self. Keep the raw copy, normalize text and types, split cells that hold more than one fact, set a rule for empty values, and remove duplicates only once you know what a row means. Sheets can do a lot when you are disciplined, and later tools get easier when the inputs are boring.
Next in this series: Exporting cleanly into SQL or a warehouse, where SQL is the standard language for asking a database for data. Series: From spreadsheets to real data.
Sources
- Hadley Wickham tidy data principles (clean structure enables clean analysis): https://doi.org/10.18637/jss.v059.i10
- Analytics Made Simple foundations on good enough data and reading numbers
Make cleaning visible
Add a clean_log tab with columns for date, step, rows in, rows out, and notes. When someone asks why a number moved, you have a trail to show them. Cleaning that nobody can see looks the same as tampering, even when your intentions are good.
If cleaning takes longer than the analysis every week, that is a sign to automate the steps or to push checks upstream to whoever creates the export. It is not a sign to skip cleaning.
Keep going
Same lessons in your feed
Short diagrams, hooks, and weekly tutorials on Substack, Instagram, X, and Facebook.