To tell whether ChatGPT ads are working, look past the conversions the ad platform reports and run a lift test: show ads in some regions and not others, then compare sales. OpenAI now offers both kinds of measurement, through partners named on October 5, 2026, but it calls its lift testing “still in its early stages,” so plan to check results yourself.
Imagine you run marketing for a small online shop and your boss approved a trial budget for ChatGPT ads. A month in, the ads dashboard shows a healthy number of sales. Your boss asks the only question that matters: would those people have bought anyway? This post explains what the dashboard can and cannot tell you, and walks through a simple test, with practice numbers, that answers your boss’s question.
What changed in ChatGPT ads this year
ChatGPT has carried ads in the US since a pilot that began in February 2026, and self-serve buying opened to all US businesses on May 5, 2026, according to PPC Land’s timeline. That launch brought a pixel and a Conversions API. A pixel is a small piece of code on your website that tells the ad platform when someone who saw or clicked an ad buys something. A Conversions API sends the same purchase records from your own systems instead of from the shopper’s browser, which is more reliable because browsers often block pixels.
On October 5, 2026, OpenAI named its first measurement partners. PPC Land counts 20 firms in measurement roles, plus two brand-safety pilots. Digiday reported the same day that advertisers had complained ChatGPT ads were hard to measure, and that OpenAI also plans to test image ads in the US during image generation.
Three ways to measure, from weakest to strongest
The partners fall into three groups, and they answer different questions. Knowing which group a number came from tells you how much to trust it.
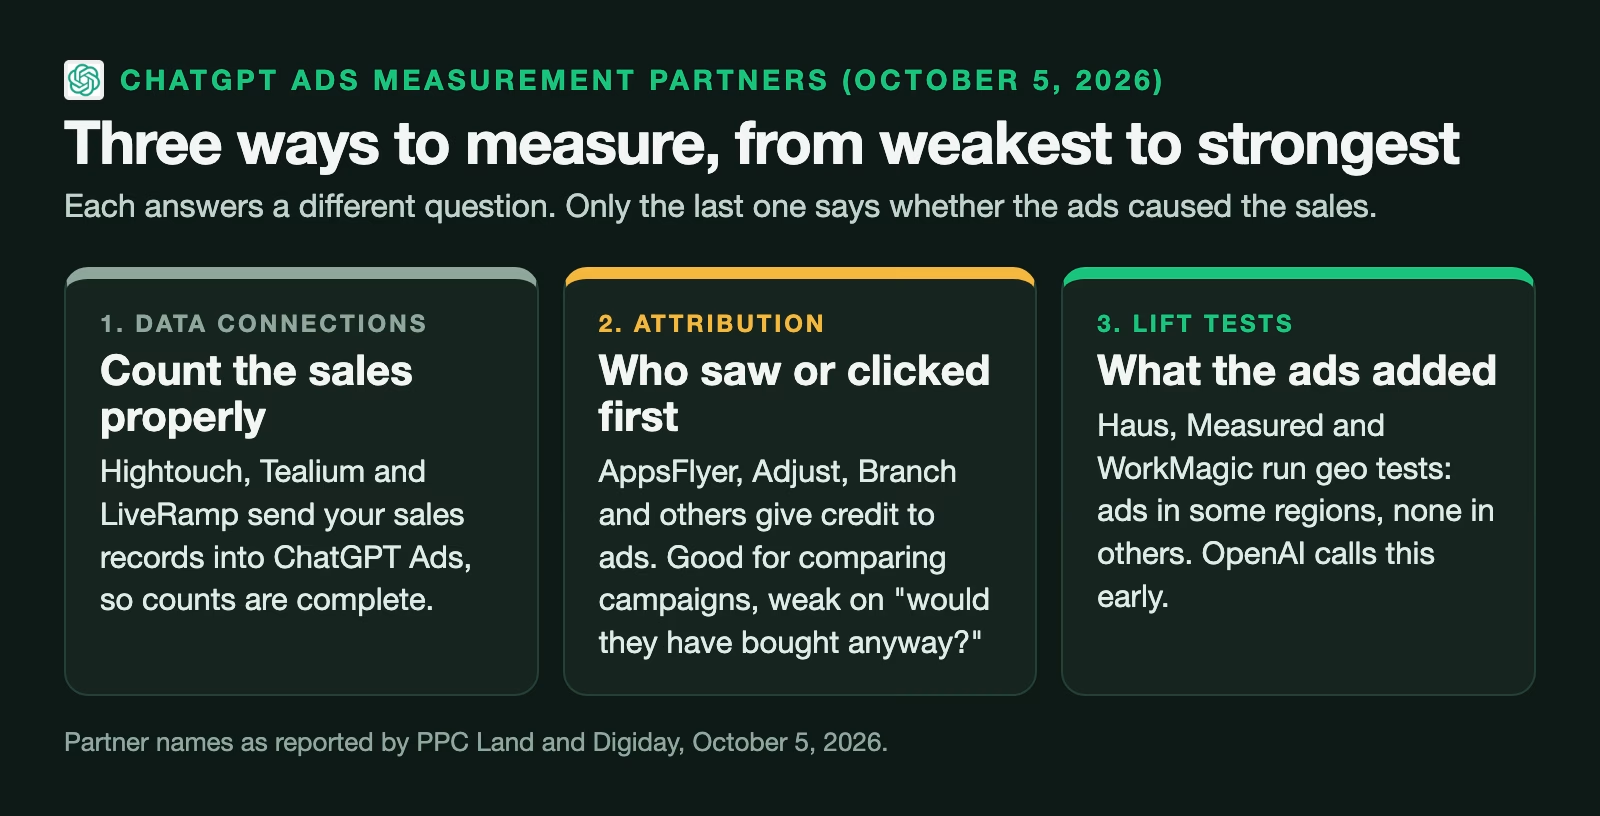
The first group moves your sales data into ChatGPT Ads. Hightouch, Tealium, and LiveRamp send conversion records from systems you already use, according to PPC Land. OpenAI’s help article on measurement partners covers the setup. This makes the platform’s counts more complete, but it does not tell you whether the ads caused the sales.
The second group is attribution, which gives credit for a sale to the ads a buyer saw or clicked first. PPC Land lists ten such partners, including AppsFlyer, Adjust, Branch, Triple Whale, Northbeam, and DV Rockerbox. Attribution is good for comparing one campaign with another. It is weak at answering “would they have bought anyway,” because a shopper who was going to buy can click an ad on the way.
The third group runs lift tests, also called incrementality tests. Incrementality means the extra sales that would not have happened without the ads. PPC Land and Digiday both name Haus, Measured, and WorkMagic for geo-based experiments, where some regions see ads and others do not. This is the strongest method, and it is the one OpenAI calls early.
Why the dashboard number is not the answer
The conversions in the ads dashboard count people who saw or clicked an ad and later bought. That is not the same as people who bought because of the ad. Two settings make the gap bigger, and both are worth checking in your account.
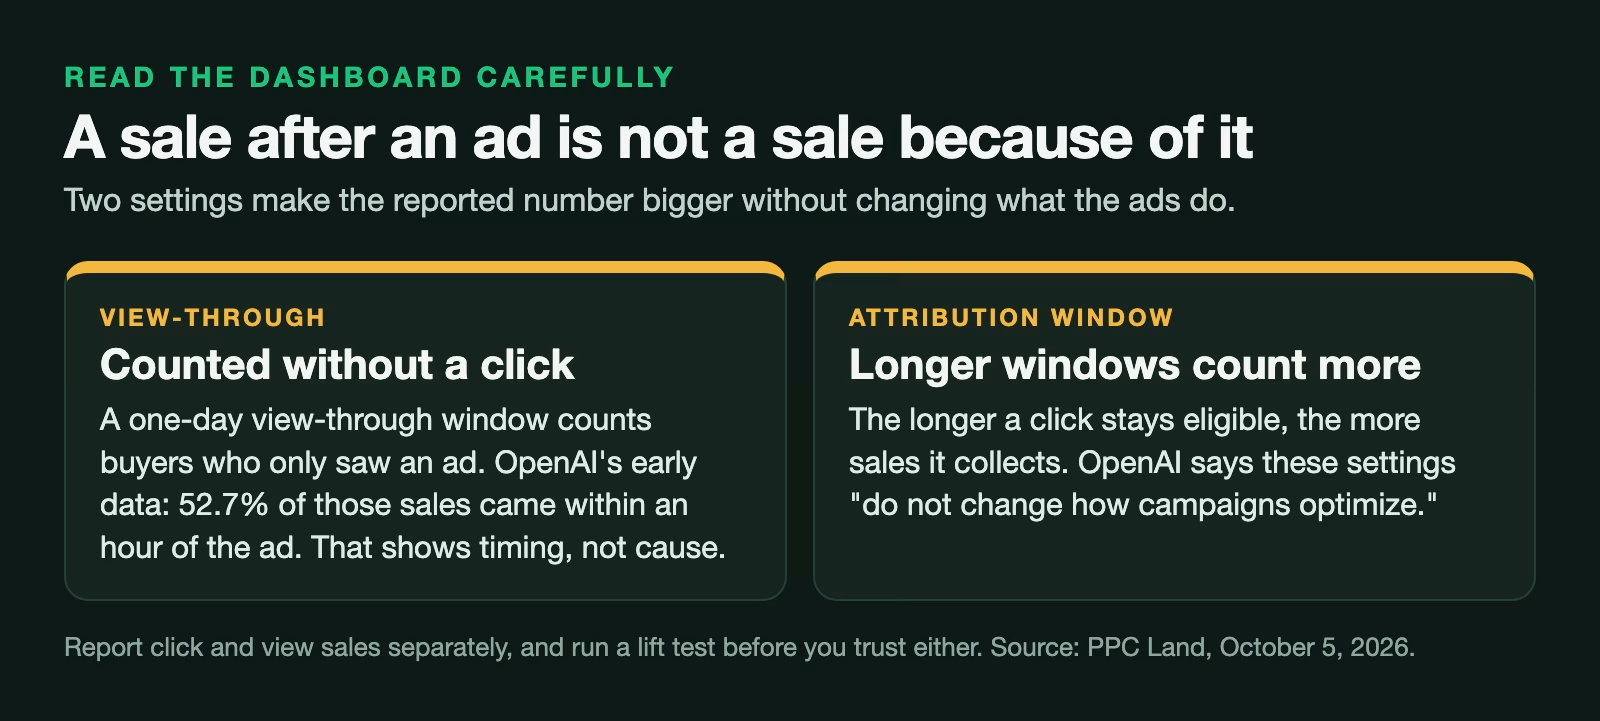
The first is view-through conversion, a sale counted because the buyer saw an ad, without clicking it, within a set time. PPC Land reports that ChatGPT Ads lets advertisers add a one-day view-through window to reporting. PPC Land also reports OpenAI’s own early data: 52.7% of eligible one-day view-through conversions happened within an hour of the ad being shown. PPC Land’s caution is the right one. That shows when sales arrive, not whether the ad caused them. If someone was already halfway to buying, seeing an ad in that hour proves nothing.
The second is the attribution window, how long after a click a sale still counts. Longer windows count more sales. PPC Land quotes OpenAI saying these reporting settings “do not change how campaigns optimize,” so they change the number you see, not what the platform does.
Early results published with the announcement were all reported by OpenAI or by the measurement vendors themselves, without spend, dates, or sample sizes, according to PPC Land. Read them as claims to test.
A practice geo test, step by step
A geo test is the most direct way to answer your boss’s question. You pick regions, show ads in half of them, and compare. The numbers below are made up for practice. Imagine 20 sales regions, such as states or metro areas, chosen so the two groups of 10 sold about the same before the test.
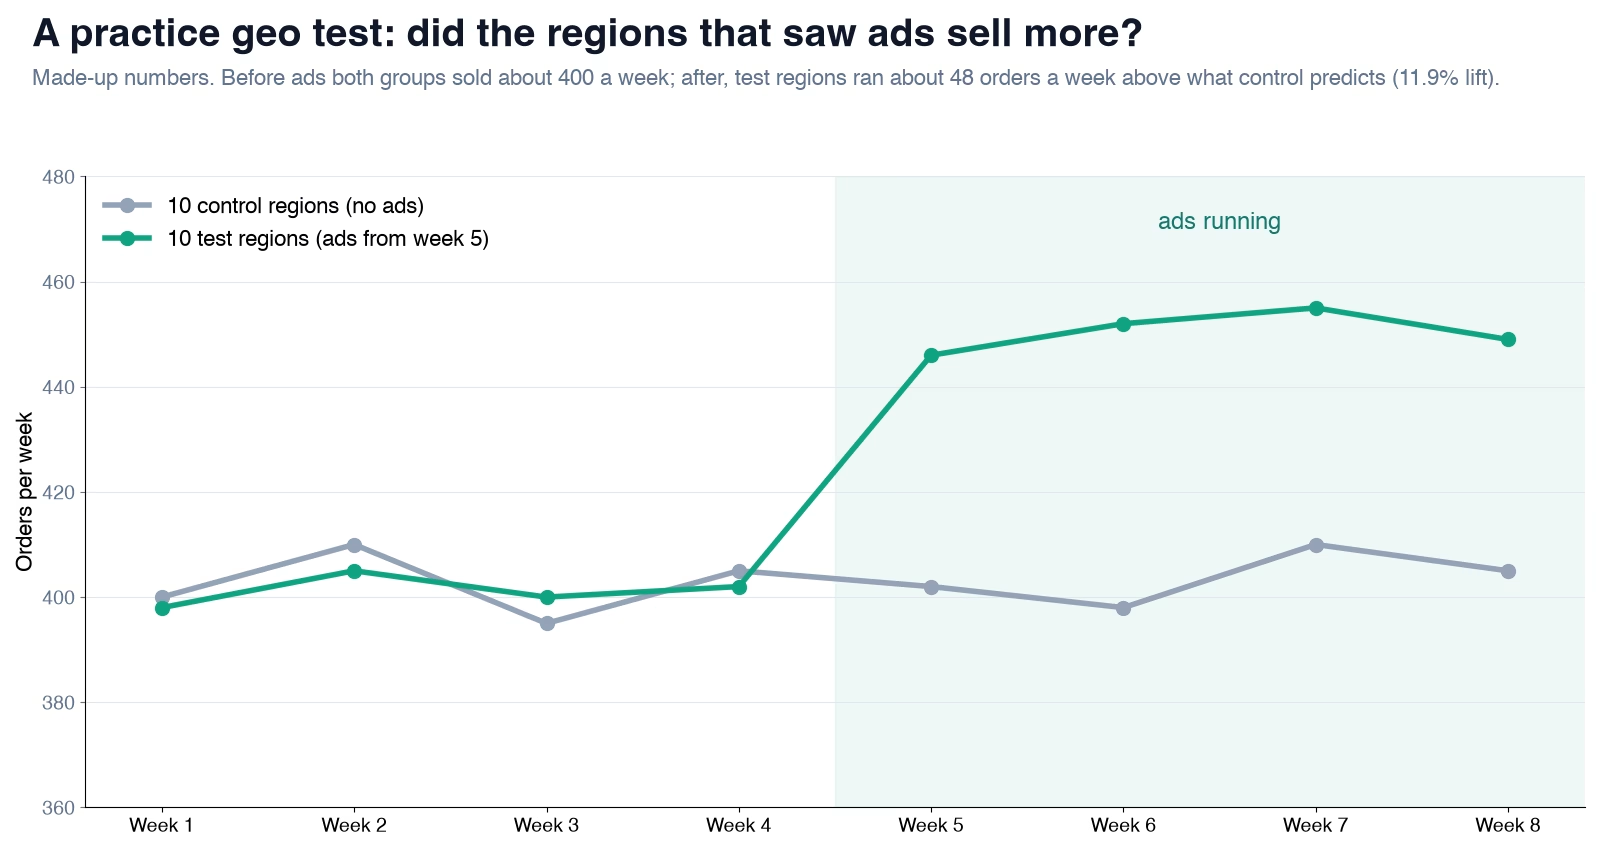
For four weeks before the ads, the 10 test regions averaged 401.25 orders a week and the 10 control regions averaged 402.5. Then ads ran in the test regions only, for four weeks. The test regions averaged 450.5 orders a week, and the control regions 403.75.
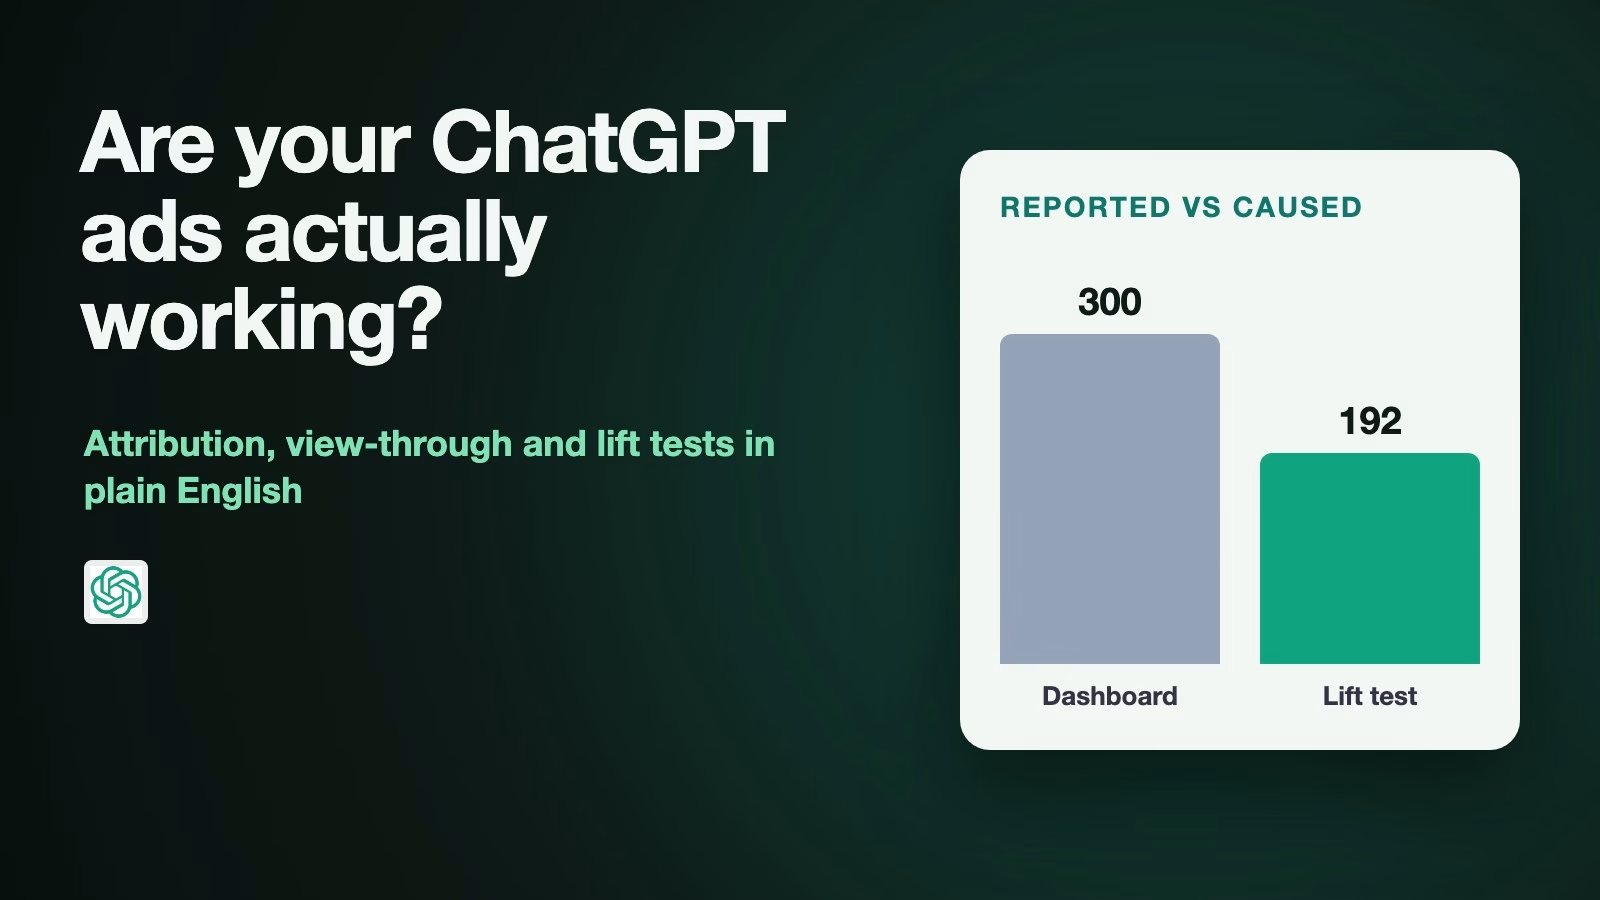
To find the lift, first work out what the test regions would have sold without ads. Scale the control group’s after number by how the two groups compared before: 403.75 times 401.25 divided by 402.5, which is 402.5 orders a week. The test regions actually sold 450.5, so the ads added about 48 orders a week, an 11.9% lift, or 192 extra orders over the four weeks.
| Practice numbers | Weeks 1 to 4, average | Weeks 5 to 8, average |
|---|---|---|
| Test regions (ads from week 5) | 401.25 | 450.5 |
| Control regions (no ads) | 402.5 | 403.75 |
| Test, expected without ads | 402.5 | |
| Extra orders per week | 48 (11.9%) |
Now compare that with the dashboard. Suppose you spent $3,000 and Ads Manager reported 300 conversions. That looks like $10 per sale. The geo test found 192 extra orders, so the cost per extra order is $3,000 divided by 192, about $15.63. Both numbers are useful. The second one is the one to put in the budget meeting, because it counts only sales the ads caused.
Average weekly orders:  B = test before, C = control before, D = test after, E = control after

Expected test orders without ads:   =E * (B / C)
Extra orders per week (lift):       =D - E * (B / C)
Lift as a share:                    =(D - E * (B / C)) / (E * (B / C))
Extra orders over the test:         =(D - E * (B / C)) * number_of_weeks
Cost per extra order:               =ad_spend / extra_orders_over_the_test

Practice numbers: B = 401.25, C = 402.5, D = 450.5, E = 403.75, 4 weeks, $3,000 spend
Expected 402.5, lift 48 a week (11.9%), 192 extra orders, $15.63 per extra order
A real test needs more care than practice numbers. Run it long enough to cover a few buying cycles, keep other marketing the same in both groups, and check the regions did not drift apart before the test. The vendors that run geo tests handle this matching for you, which is why OpenAI works with them for lift testing.
If your budget is too small for a geo test
A geo test needs enough sales in each region for a real change to stand out from normal week-to-week noise. In the practice numbers, weekly orders bounced by about 10 either way with no ads at all, and the lift was about 48. If your lift would be closer to the noise, a geo test will not tell you much. Here are three cheaper checks, from strongest to weakest.
- An on-and-off test. Run ads for two weeks, pause for two, run for two more, and compare sales in the on weeks with the off weeks. It is weaker than a geo test, because anything else that changed in those weeks gets mixed in, but it costs nothing extra.
- A holdout of your own customers. If you send your customer list to the platform, keep a random tenth of it out of the audience and compare what both groups buy. This only works for people you already know.
- A sense check against search. Watch searches for your brand name while ads run. If ChatGPT ads are reaching new people, branded searches and direct visits often rise too. That is a hint, not proof.
Whichever you use, write down before you start what result would make you stop, keep, or raise the spend. Deciding afterwards makes almost any result look like success.
Before you raise the budget
Use a short checklist before you put more money into ChatGPT ads. Each item protects you from a number that looks better than it is.
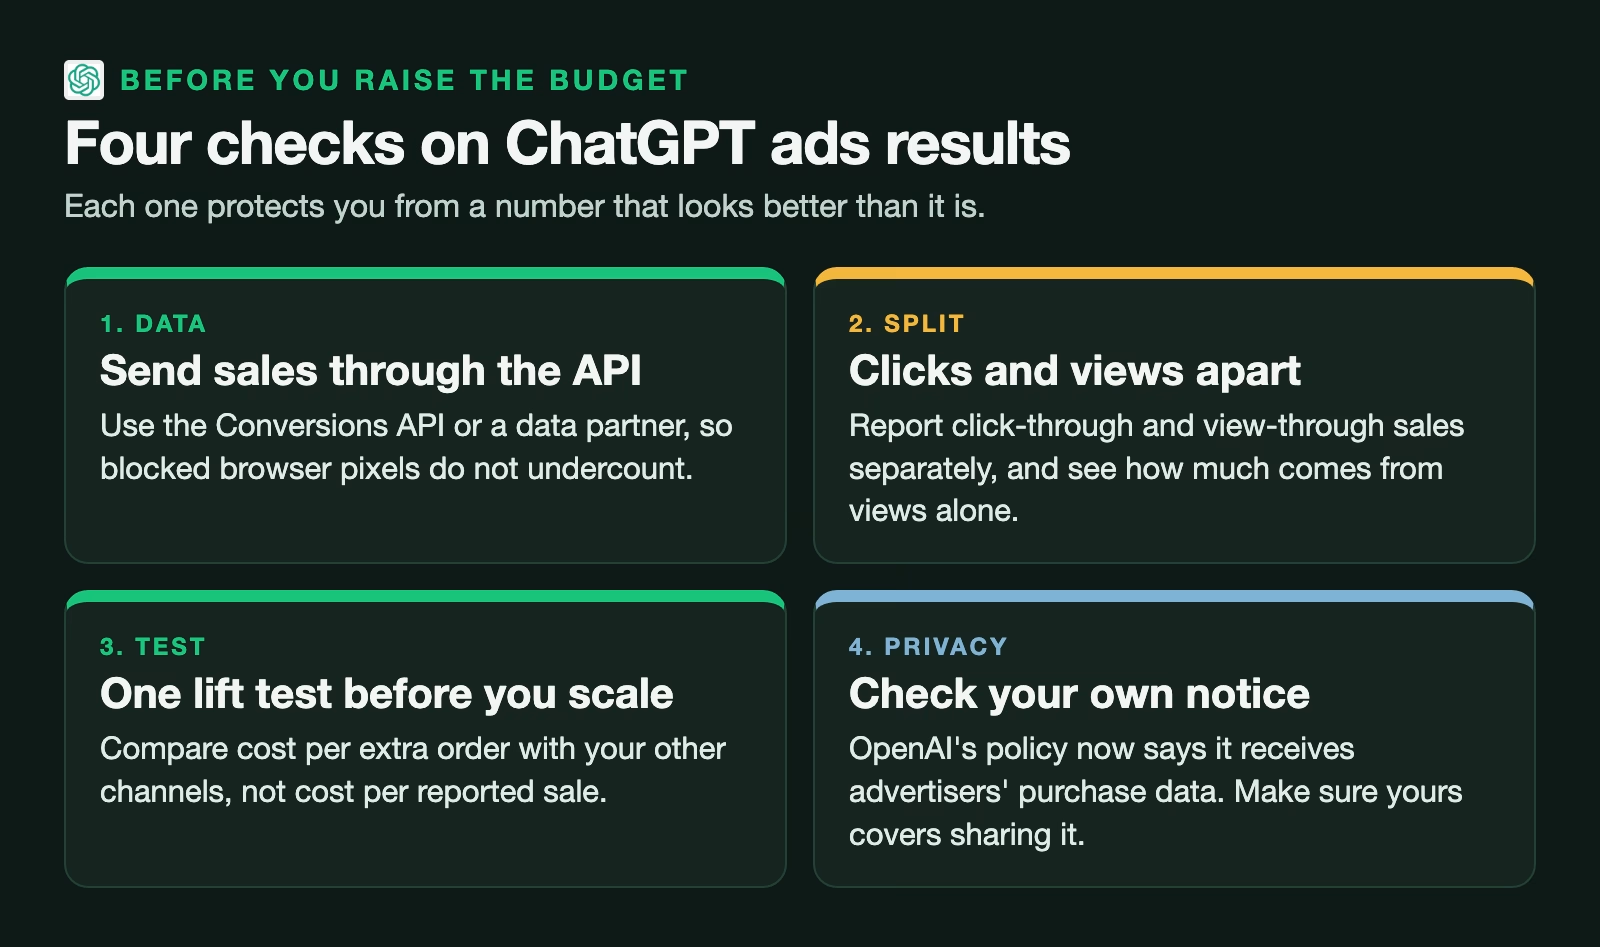
Send your sales data through the Conversions API or a data partner, so the platform’s counts are complete. Report click-through and view-through conversions separately, so you can see how much of the total comes from views alone. Run at least one lift test before you scale, and compare the cost per extra order with the same number for your other channels. And keep privacy in mind. PPC Land reports that OpenAI’s privacy policy now says it receives purchase data from advertisers and their partners to measure ads, so check that your own privacy notice covers sharing sales data with an ad platform.
How this fits with what you measure elsewhere
None of this is special to ChatGPT. The same gap between attributed and extra sales exists for search, social, and TV ads, and the same tests answer it. If your team already runs experiments, reuse the setup. If it does not, the post on measuring whether AI saves your team time uses the same before-and-after logic with a control group, applied to work instead of ads.
What to do this week
Open your ChatGPT Ads account and check two settings: which attribution window you report, and whether view-through conversions are mixed into the total. Split them. Then pick 20 regions with similar past sales and write down a four-week test plan, with half the regions as a holdout. If your spend is too small for a clean geo test, a measurement partner can tell you the minimum budget that would show a result.
Sources
- PPC Land: OpenAI gains 20 measurement partners for ChatGPT ads (October 5, 2026) (partner list by type, ads timeline, pixel and Conversions API, view-through and attribution settings, vendor-reported results, privacy policy change)
- Digiday: OpenAI moves to make ChatGPT ads more measurable and more visual (October 5, 2026) (advertiser complaints, geo tests in early experimentation, image ads test)
- OpenAI Help Center: Set up measurement partner integrations (partner setup)
Keep going
Same lessons in your feed
Short diagrams, hooks, and weekly tutorials on Substack, Instagram, X, and Facebook.