Analytics, business intelligence (BI, the dashboards and reports a company runs on), data science, data engineering, and AI share data and tools, but each aims at a different result. Naming them clearly helps teams hire the right people and avoid turf fights.
Imagine you sit in a planning meeting where the goal is described as “our AI analytics data science platform.” You nod along, but you and each colleague picture different work. A month later, two teams have built overlapping tools, and nobody built the report your manager actually needed.
This post separates the fields in plain language, with an example of the work each one produces. See also data jobs.
What you’ll learn
- A clean definition of each field.
- How they hand work to each other.
- Where AI fits without swallowing everything.
- Examples of good and bad project framing.
- How to staff a small team without five empty titles.
Business intelligence
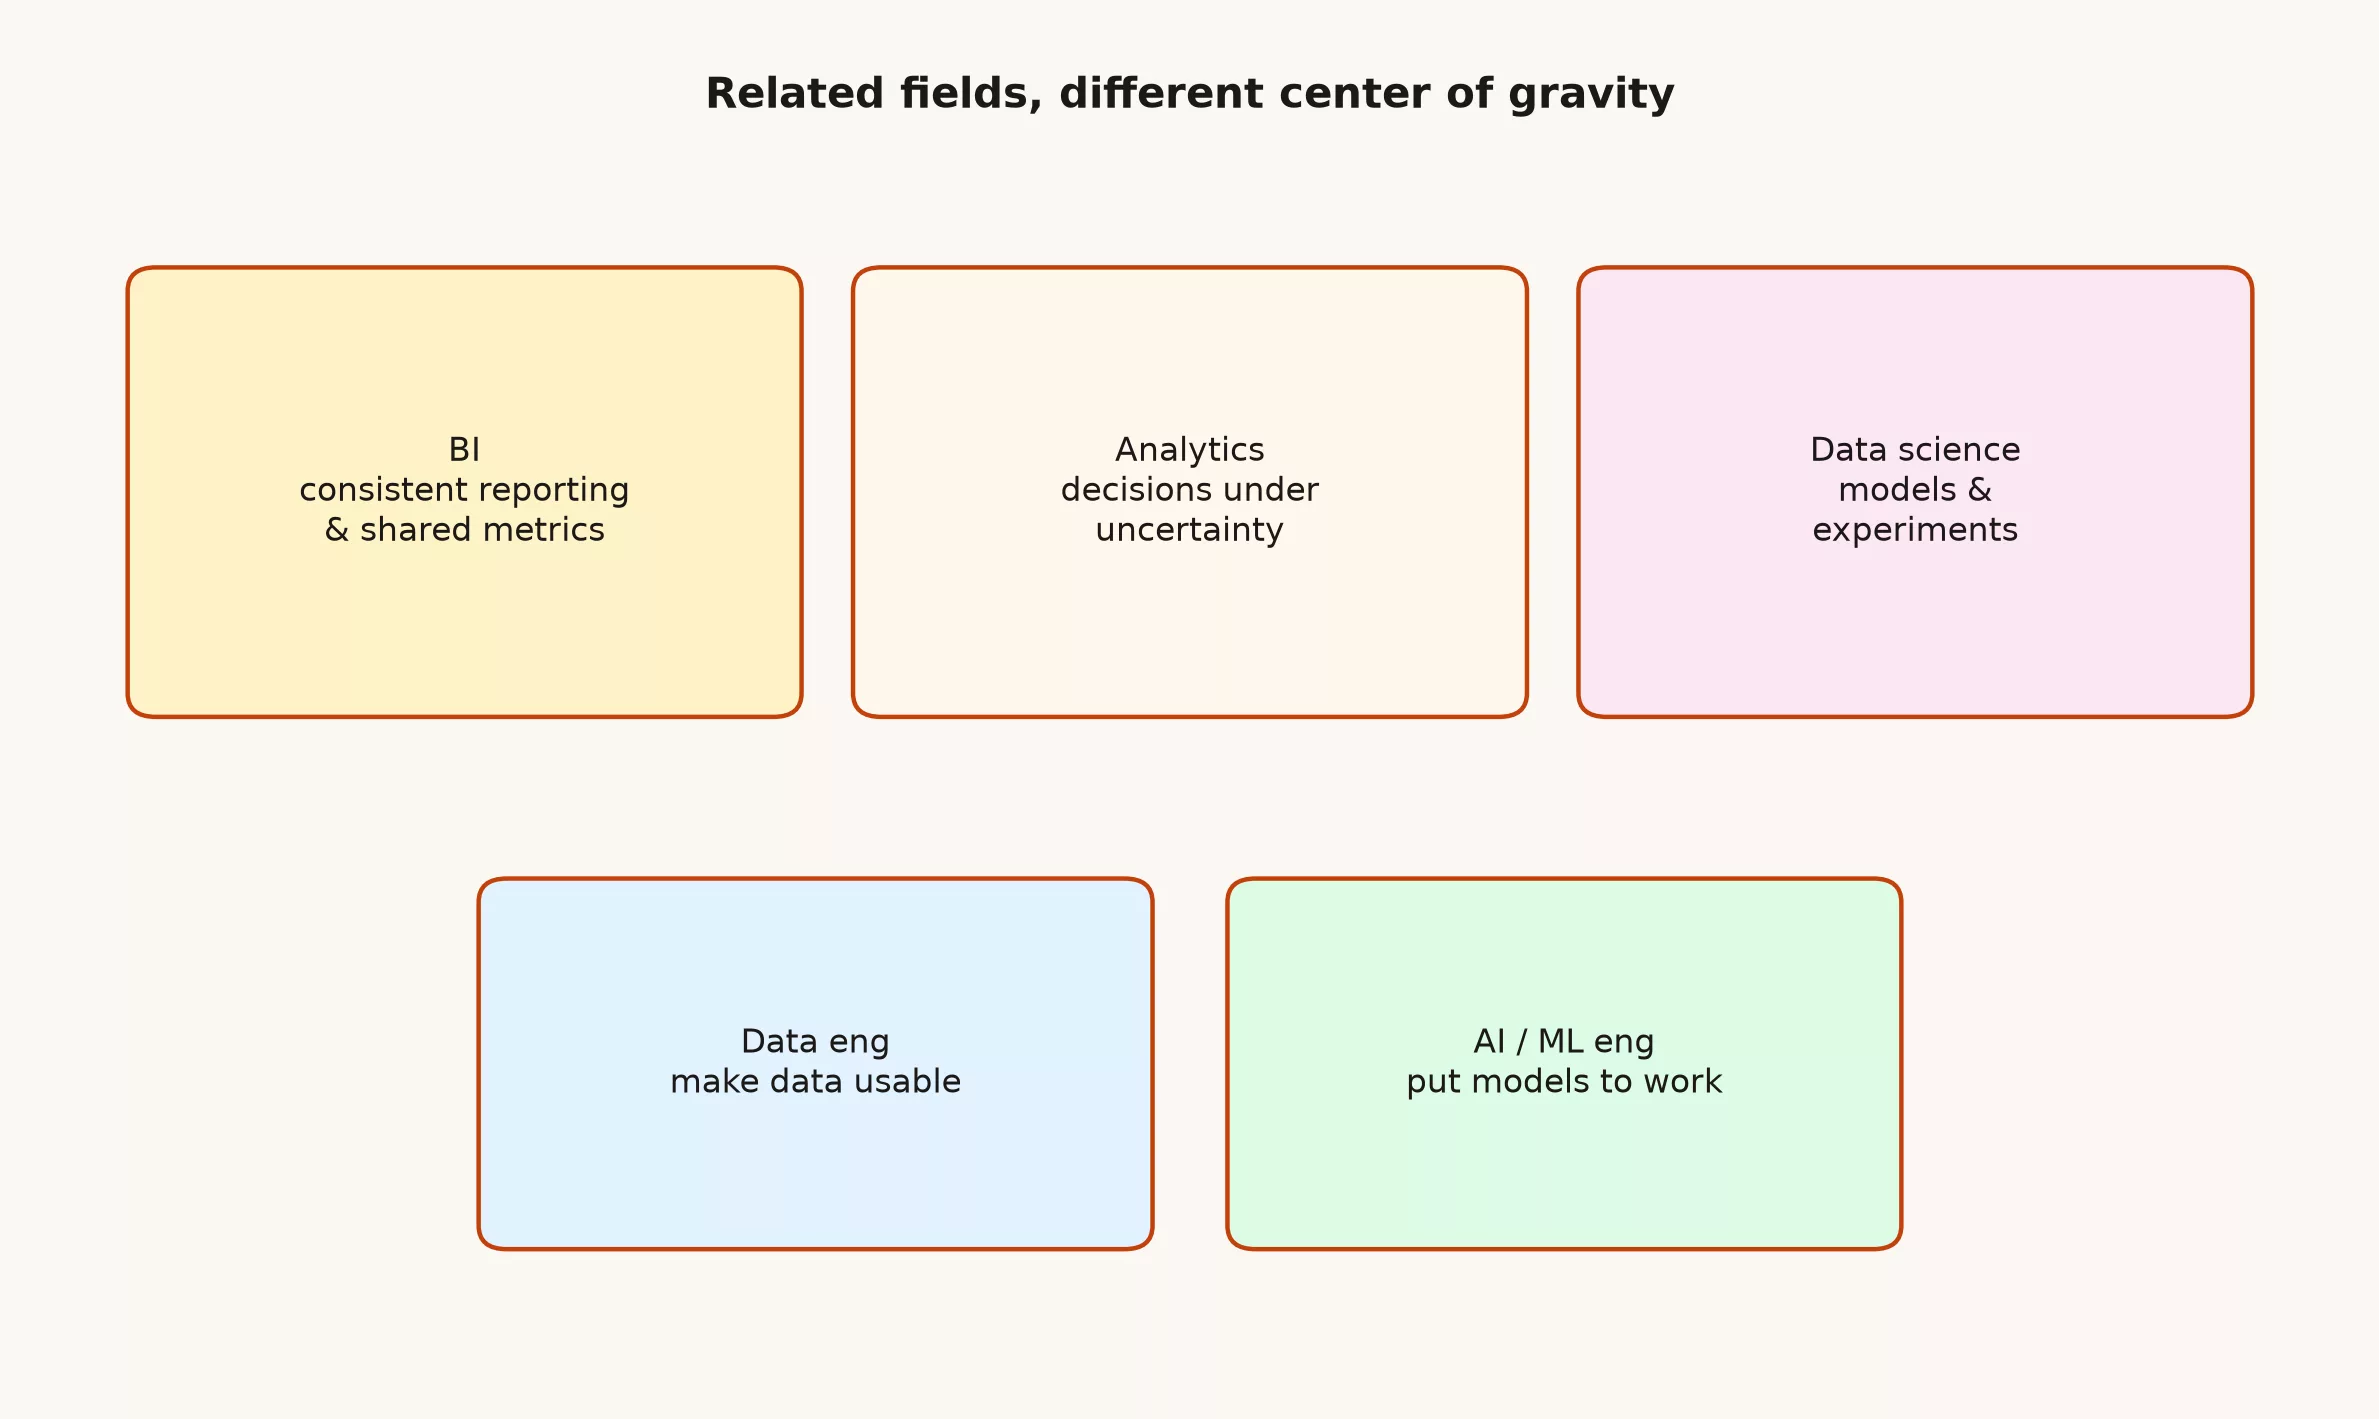
BI makes shared, recurring visibility reliable: scorecards, operational dashboards, standardized metrics. The main win is consistency, because when every team reads the same numbers from the same place, meetings spend their time on decisions instead of arguing about whose figure is right. If every manager sees a different revenue, BI failed even if charts look pretty. BI is closer to publishing a newspaper of record than to one-off investigative reporting.
Analytics
Analytics answers decisions under uncertainty: why did churn spike, which segment to target, what tradeoff we accept. It uses BI data and more ad hoc work. The win is a better decision, not a permanent dashboard (a screen of charts and numbers that updates on its own) for every side question. Good analytics ends in a recommendation someone can refuse or accept with eyes open.
Data science
Data science leans into models, experiments, and statistical rigor when the problem needs them. Not every chart is data science. Calling basic SQL (the standard language for asking a database questions) “science” confuses stakeholders about risk, validation, and how long the work should take.
Data engineering
Data engineering builds the roads: ingestion, storage, orchestration (scheduling data jobs to run in the right order), access, quality at scale. Without it, every analyst ends up spending part of each week fixing broken data feeds instead of answering the questions they were hired to answer. The win is reliable, governed data products that do not depend on one hero’s laptop.
AI and machine learning
AI/ML applies models that learn patterns, including generative LLMs (large language models, the kind behind chatbots). Valuable when automation or prediction beats rules. Expensive theater when bolted on without data quality, evaluation, or a way for people to catch and correct wrong answers safely.
How work flows
| Stage | Owner field | Example artifact |
|---|---|---|
| Ingest and model core tables | Data eng / analytics eng | Warehouse models |
| Define official metrics | BI + domain owners | Semantic layer |
| Investigate a dip | Analytics | One-page brief + findings |
| Forecast demand | Data science | Model + error bands |
| Serve recommendations | ML eng | API + monitors |
Framing projects well
- Bad: “We need AI on the data lake.”.
- Better: “We need same-day stockout predictions for 200 products, with a person able to override them.”.
- Bad: “Build a dashboard for everything.”.
- Better: “The weekly operations meeting needs three key numbers, with a way to drill down to each store.”.
- Bad: “Become a data-driven culture.”.
- Better: “Every pricing change ships with a one-page brief and a success metric.”.
Staffing a small team
A practical starter mix is often: one analytics-minded generalist, one person strong in pipelines, shared BI ownership with the business. Add specialized science/ML when there is a backlog of problems that need it, not as decoration for a pitch deck.
Shared foundations
All of these fields fail without definitions, quality, and access control. That is why governance and literacy keep showing up even when the project is “just a dashboard” or “just a model.” The foundations are not glamorous. They are completely load-bearing.
Quick recap
- BI optimizes consistency; analytics optimizes decisions.
- Data science and ML need problems that justify models.
- Data engineering makes the rest possible.
- Frame projects by outcomes, not buzzwords.
- Small teams blend fields; clarity still matters.
A good first step this week: describe one current project by the decision it supports, not by the field it belongs to. If you cannot name the decision, settle that before you pick tools.
Sources
- https://analyticsmadesimple.com/data-jobs-demystified-what-does-each-role-actually-do/
- https://analyticsmadesimple.com/key-terms/
- https://en.wikipedia.org/wiki/Business_intelligence
Keep going
Same lessons in your feed
Short diagrams, hooks, and weekly tutorials on Substack, Instagram, X, and Facebook.