
Use Excel canvas, Copilot’s new one-page report view, for a fast first draft of a report, and check every number on it against a PivotTable before anyone else sees it. Copilot picks the numbers and the charts for you, and either can tell the wrong story even when the data is right.
Imagine you have a workbook of this year’s sales and your manager asks for “a quick summary with a couple of charts” by the end of the day. Copilot, the AI assistant built into Excel, now offers to build that page for you in a minute. It looks polished. The question is whether the numbers on it mean what your manager will assume they mean, and you are the one whose name goes on it.
This guide covers what Microsoft has confirmed about Excel canvas, how to ask for a first draft, two ways an automatic report can tell the wrong story with correct data, and a ten-minute check you can run before you share it.
What Excel canvas is, in plain words
Microsoft announced the feature to IT administrators in Message Center post MC1485411, published October 2, 2026 and updated October 6. A Message Center post is Microsoft’s official notice to companies about upcoming changes in Microsoft 365. It says Excel canvas is an interactive report that Copilot creates from your workbook data, with key visualizations, metrics and insights in a single view.
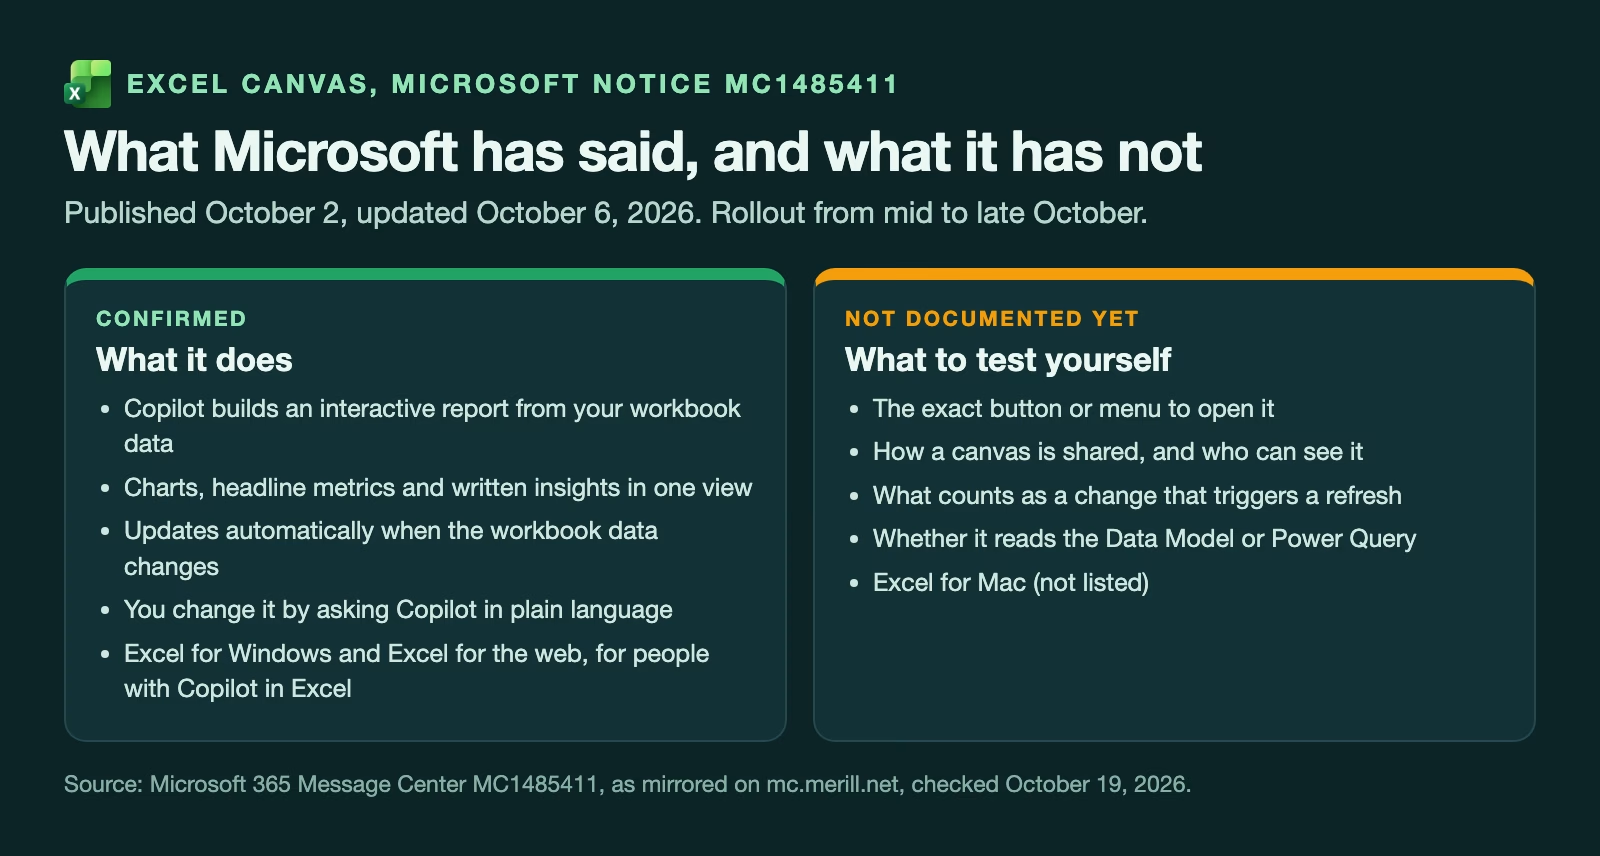
Three details from that notice matter most. The report updates automatically when the data in the workbook changes. You change it by asking Copilot in plain language, such as “show this by quarter” or “add a chart of returns”, rather than editing chart settings by hand. And it is for people with access to Copilot in Excel, in Excel for Windows and Excel for the web. Mac is not listed.
The notice put general availability, meaning the full release rather than a test version, worldwide from mid-October 2026, finishing by the end of October. It lists no action for administrators, so if your company already has Copilot in Excel, the feature should simply appear.
What the notice does not say is just as useful. It does not describe the button that opens a canvas, how a canvas is shared, or what exactly counts as a change that triggers an update. Treat those as things to test on a copy of your workbook, not things to assume.
How to open it and ask Copilot for a first draft
Microsoft has not published step-by-step instructions for canvas as of October 19, 2026, so here is the route that matches its notice and early coverage. Open your workbook in Excel for Windows or Excel for the web. Open the Copilot pane from the Copilot icon in the lower-right corner of Excel, which is where Microsoft’s support pages point people for Copilot. Then ask for a canvas report from the data, in plain words.
Your first request decides most of what you get back, so be specific about three things:
- Who it is for. “A one-page summary for the sales leadership meeting” gets a different page than “a report”.
- Which numbers matter. Name them: “total revenue, number of orders, revenue per order, and revenue by region”. If you leave this out, Copilot picks for you.
- How each number is calculated. “Revenue per order means total revenue divided by the number of orders” removes the most common mistake before it happens, as the next section shows.
Before you ask, put your data in an Excel table (Home > Format as Table) with one header row and no notes or totals mixed into it. Clean headers such as Order date, Region and Amount give Copilot fewer chances to guess wrong. If your data still has stray spaces or numbers stored as text, the guide on cleaning messy data with Copilot’s Clean Data shows how to fix that first.
Why an automatic report can mislead: two examples
Every number on a canvas can be calculated correctly and the page can still tell the wrong story. Two mistakes cause most of the trouble, and neither is unique to Copilot. People make them in hand-built dashboards all the time.
A chart axis that does not start at zero
Here are six months of revenue, made up for this example, drawn twice. The numbers are identical. Only the starting point of the vertical axis changes.
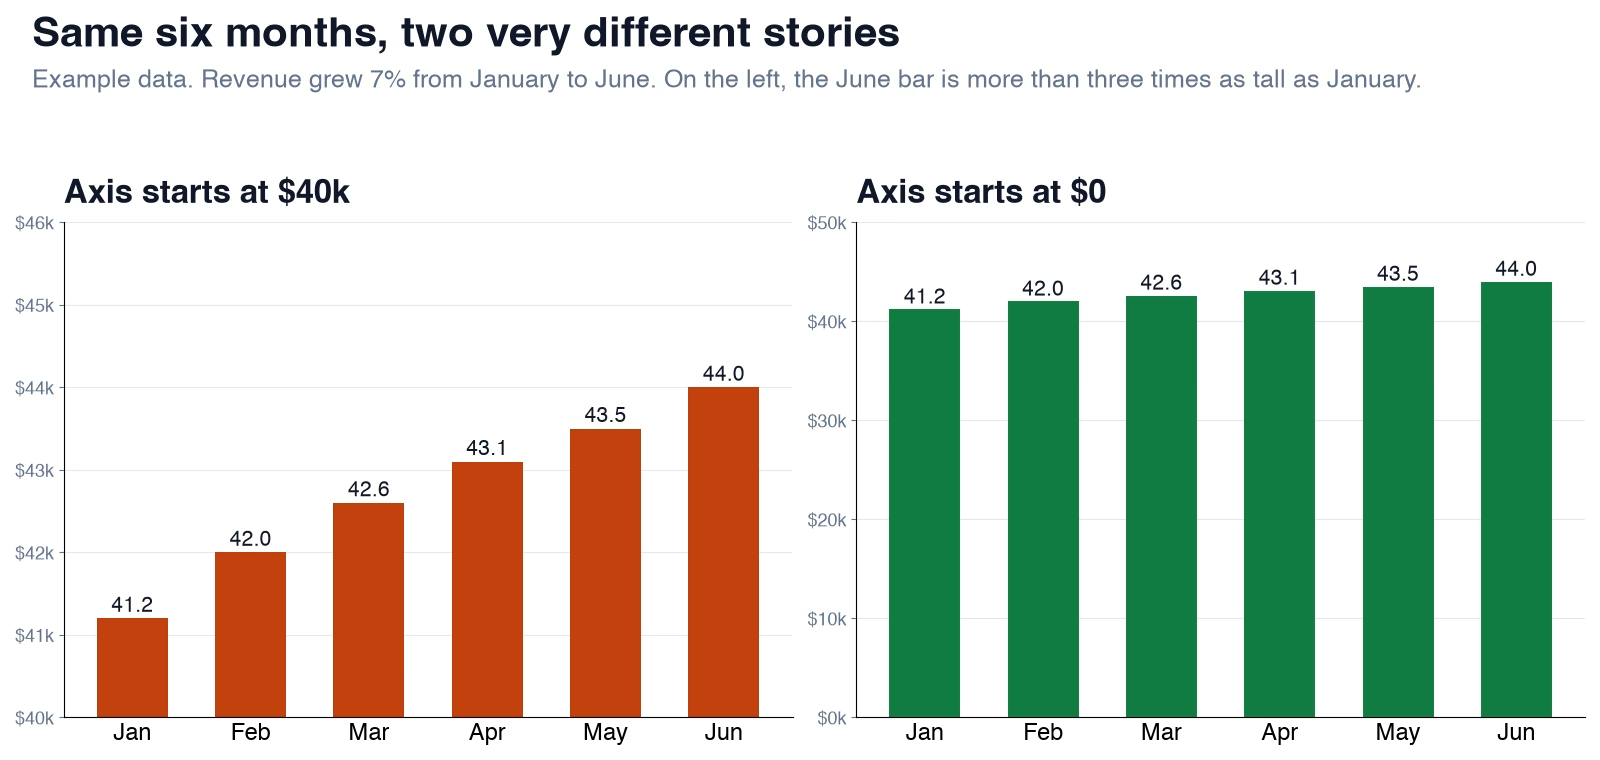
Revenue grew about 7 percent from January to June. On the left, the axis starts at $40,000, so the June bar is more than three times as tall as the January bar, and the eye reads “it tripled”. On the right, the axis starts at zero and the growth looks like what it is: steady and modest. Bar charts should start at zero, because readers compare the bars’ heights. Line charts can start elsewhere, since the reader follows the slope, not the height.
When a canvas shows bars, look at the lowest number on the axis. If it is not zero, ask Copilot to start the axis at zero, or ask for a line chart instead.
An average of averages
Now a headline number. Say Region A had 900 orders averaging $40 each and Region B had 100 orders averaging $120. What is the average order value across the business?
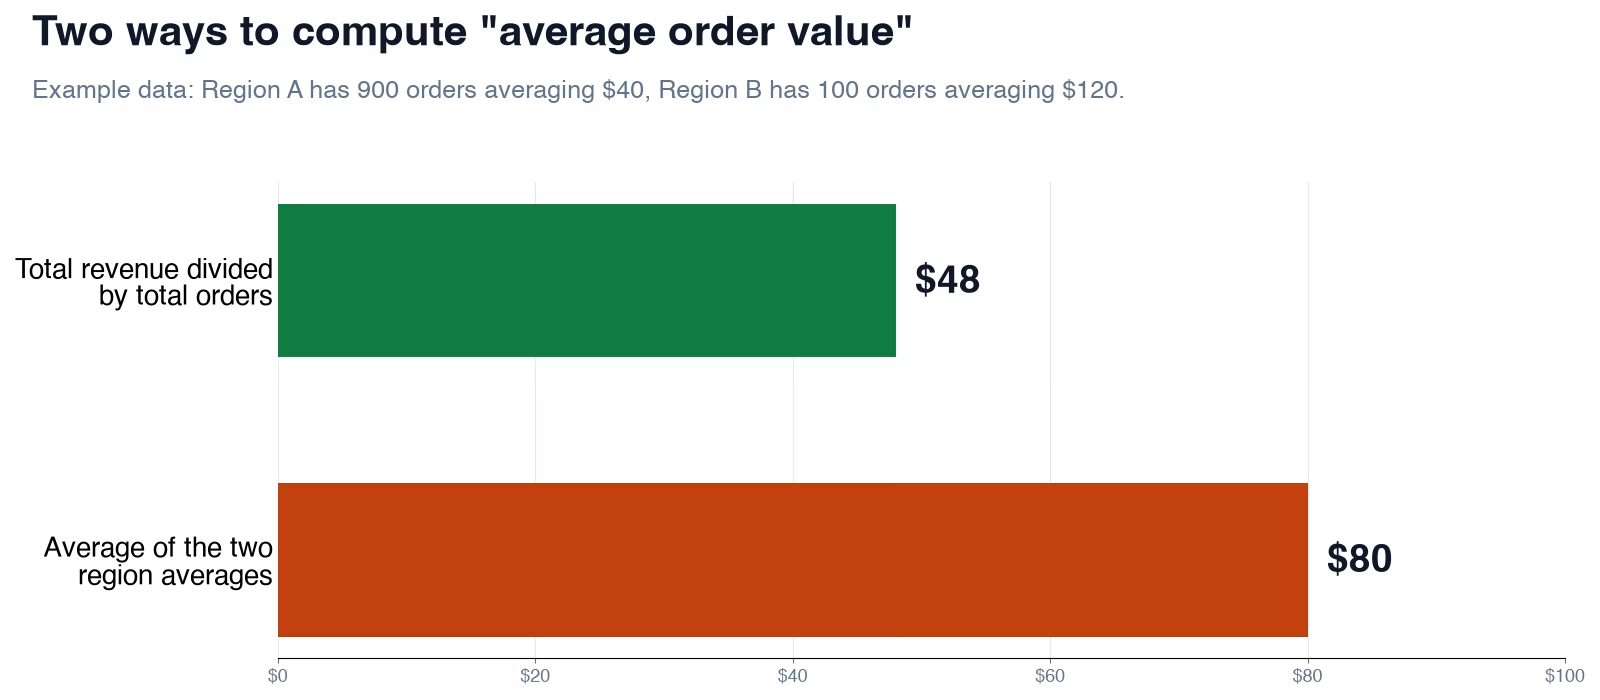
Total revenue is 900 times $40 plus 100 times $120, which is $36,000 plus $12,000, or $48,000. Divide by the 1,000 orders and you get $48. But if a report simply averages the two region averages, it shows $80, two thirds higher than the truth. The small, expensive region gets the same weight as the big one.
Both numbers come from the same data. Only one answers the question your manager is asking. This is why the first request in the previous section names how each number is calculated, and why the next section starts with that question.
Four questions for every number and chart
You do not need to understand how Copilot builds a canvas to check one. Ask four questions about each number and each chart on the page.
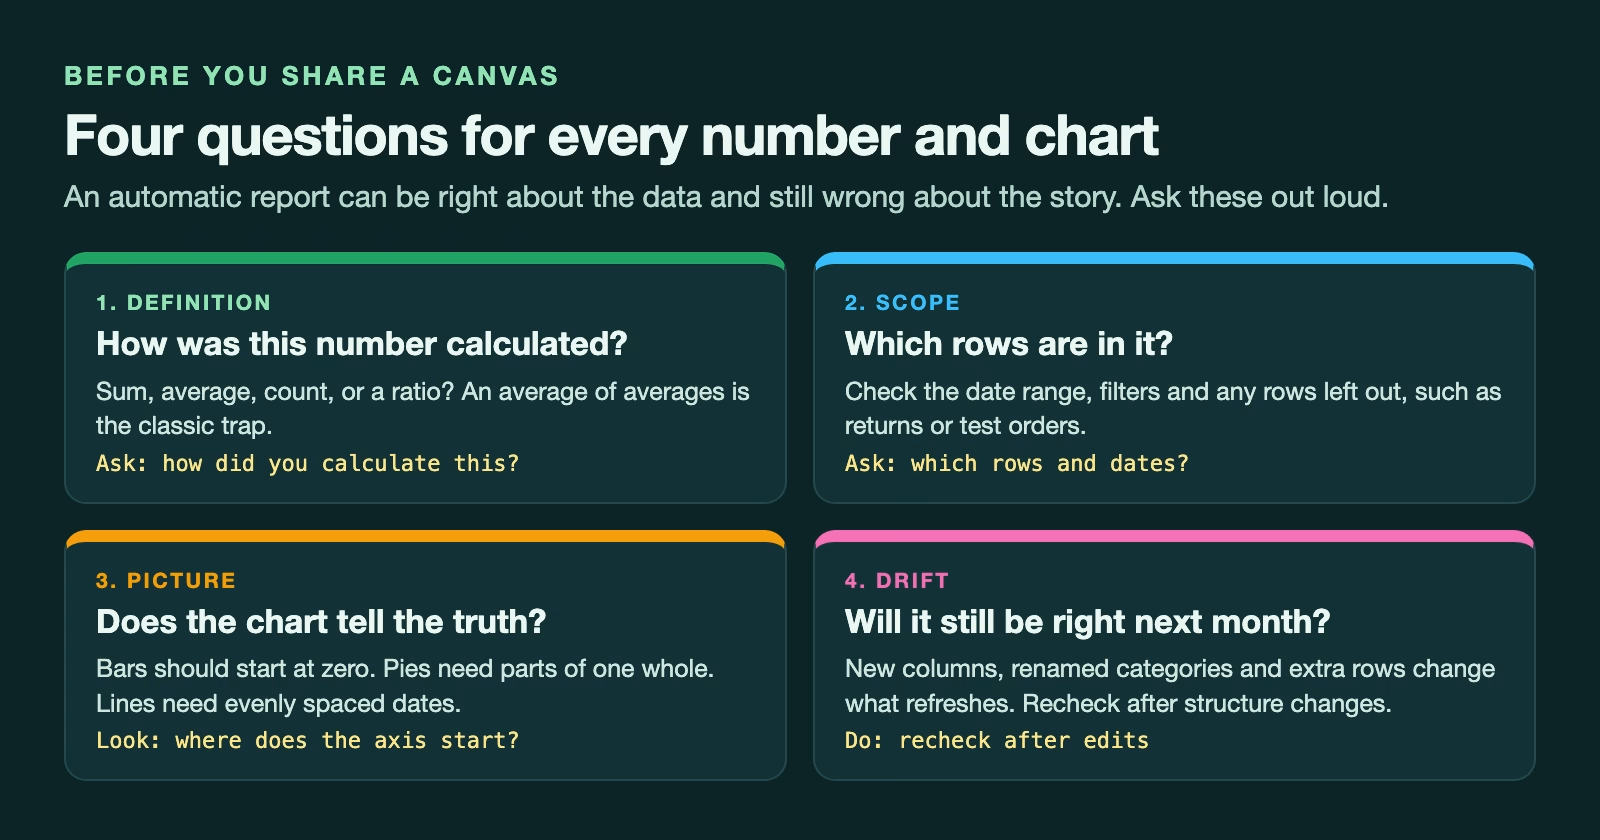
How was this number calculated? A total, an average, a count and a ratio can all wear the same label. Ask Copilot directly, “how did you calculate revenue per order?”, and compare the answer with what you meant.
Which rows are in it? Look for a date range, filters, or rows that were left out, such as returns, test orders or the current unfinished month. A partial month at the end of a trend line makes any business look like it is falling off a cliff.
Does the chart tell the truth? Bars start at zero. A pie chart only makes sense when its slices are parts of one whole and there are only a few of them. A line chart needs evenly spaced dates, or a missing month will look like a smooth trend.
Will it still be right next month? A canvas updates when the data changes, which is the point, but structure changes are where automatic reports drift. A renamed category, a new column, or rows pasted below the table can change what feeds the page. Check the canvas again after anyone edits the workbook’s layout, not just its numbers.
A ten-minute check with a PivotTable
A PivotTable is Excel’s drag-and-drop summary table: you choose a field for the rows and a field to add up, and Excel does the math. It is the fastest way to check a canvas, because every value in it maps to a field you chose yourself.
Insert a PivotTable from the same table the canvas uses (Insert > PivotTable), on a new sheet. Then rebuild the canvas’s numbers one at a time.
| On the canvas | Rebuild it in the PivotTable | What must match |
|---|---|---|
| Total revenue | Put Amount in Values (Sum) | The same total |
| Number of orders | Put Order ID in Values (Count) | The same count |
| Revenue per order | Divide the total by the count yourself | The same value and the same method |
| Revenue by region or product | Put Region in Rows, sort largest to smallest | The same order and values |
| Trend by month | Put Order date in Rows, group by Months | The same months, with no partial month at the end |
If a number matches, tick it. If it does not, the difference usually points at the cause: a different date range, a filter, an average where you expected a total, or rows the canvas did not include. Ask Copilot to explain that one number, fix it with a plain-language request, and check it again.
Keep the PivotTable on its own sheet after you share the canvas. Next month, when the data updates, you can refresh the PivotTable (Data > Refresh All) and compare again in two minutes instead of ten.
What early testers found
Independent testing was still thin in mid-October 2026, so treat early reports as hints. One widely shared hands-on review came from Wyn Hopkins, an expert in Excel and in Power BI, Microsoft’s tool for business reports, who is recognized by Microsoft as an MVP (Most Valuable Professional), who tested an early version and published a video about a day later. HubSite 365’s summary of that video (October 16, 2026) lists both sides.
On the good side, he found report building much faster, the visuals interactive, with tooltips and cross-filtering, and the plain-language editing easy for people who do not build dashboards. On the other side, the summary says some numbers in the visuals were hardcoded and did not update when workbook formulas changed, the early build crashed, asking for changes gave unpredictable results, and there was no clear trail from a metric back to the formulas behind it. It also says the canvas did not use the Data Model, Power Pivot or Power Query connections, which are the tools many analysts use to bring in and model larger data.
Those findings came from a test version and may already be fixed, but they explain why the PivotTable check matters. If a number on the canvas does not change when you change the data behind it, you have found exactly the kind of problem that a quick refresh-and-compare will catch.
It is also worth remembering that Microsoft has pulled a Copilot feature from Excel before. The COPILOT worksheet function let a formula send a prompt to the AI. The Register (October 2, 2026) reported that Microsoft said it had “decided not to move forward” with it, and Microsoft’s support page says the function stopped working on September 14, 2026. Do not build a monthly process that depends on canvas until it has been stable for a while.
The right tool: canvas, PivotChart or Power BI
Excel canvas is not the only way to turn a workbook into a report, and it is not always the best one.
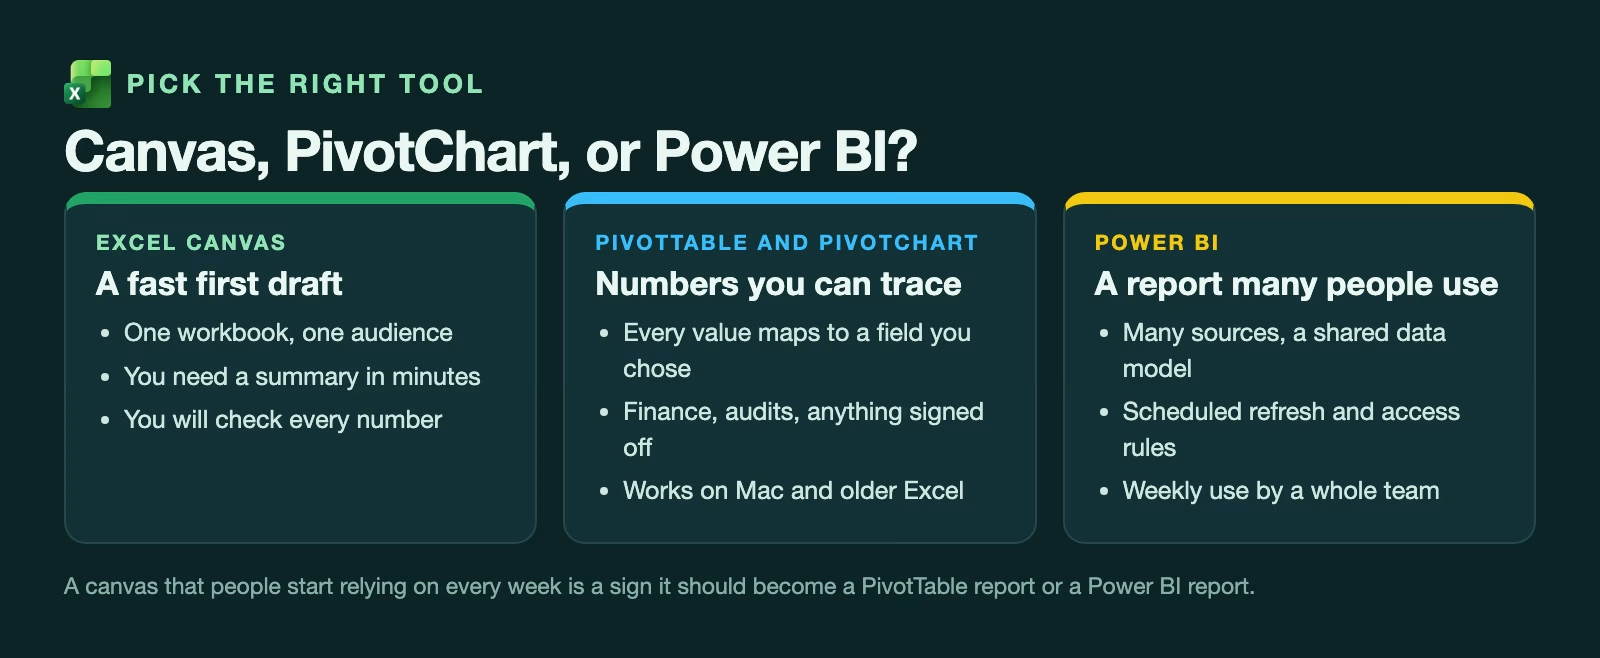
Use a canvas for a fast first draft from one workbook for one audience, when you have time to check every number before it goes out. It is good at getting you from a blank page to something to react to.
Use a PivotTable with a PivotChart when the numbers will be signed off, audited or compared month after month. Every value traces back to a field you chose, it works in every version of Excel including Mac, and nobody has to wonder how a number was calculated. The post on building the data model before the charts in Power BI explains why that traceability matters as reports grow.
Use Power BI when many people rely on the report every week, the data comes from several sources, or you need scheduled refreshes and control over who sees what. If you are weighing the AI assistants inside the big reporting tools, the comparison of the AI assistants in Power BI, Tableau and Databricks covers that choice.
A canvas that people start opening every Monday has outgrown its first draft. That is the moment to rebuild it as a PivotTable report or in Power BI, with the definitions written down.
Your first canvas this week, step by step
You can try all of this in about half an hour, on a workbook you already know well. Knowing the right answers in advance is what makes it a fair test.
- Copy a workbook you already report from, so the original stays untouched.
- Format the data as a table and check that the headers are clear.
- Open the Copilot pane and ask for a canvas report for a named audience, naming the three numbers you want and how each is calculated.
- Ask Copilot how it calculated each headline number, and compare its answer with your own definition.
- Check every bar chart’s axis starts at zero, and look for a partial month at the end of any trend.
- Build the PivotTable check from the table above and tick each number that matches.
- Change one value in the data and confirm that the canvas and the PivotTable both move by the same amount.
Step 7 is the easiest one to skip, and it is the one that catches hardcoded numbers. If both move together, you have a canvas you can share with a clear conscience. If one does not move, you have learned where not to trust it, and you found out before your manager did.
Sources
- Microsoft 365 Message Center MC1485411: Microsoft Excel: Excel canvas (mirror) (what canvas does, automatic updates, Windows and web, rollout from mid to late October 2026, published October 2 and updated October 6, 2026)
- Microsoft Support: COPILOT function (the COPILOT function stopped working on September 14, 2026; Copilot pane in the lower-right corner of Excel)
- The Register: Excel Canvas offers to turn your workbook into the boss’s next report (October 2, 2026 coverage, open questions about chart and metric choices)
- HubSite 365: Canvas in Excel, summary of Wyn Hopkins’ 24-hour hands-on video (October 16, 2026; early test results, good and bad)
Keep going
Same lessons in your feed
Short diagrams, hooks, and weekly tutorials on Substack, Instagram, X, and Facebook.