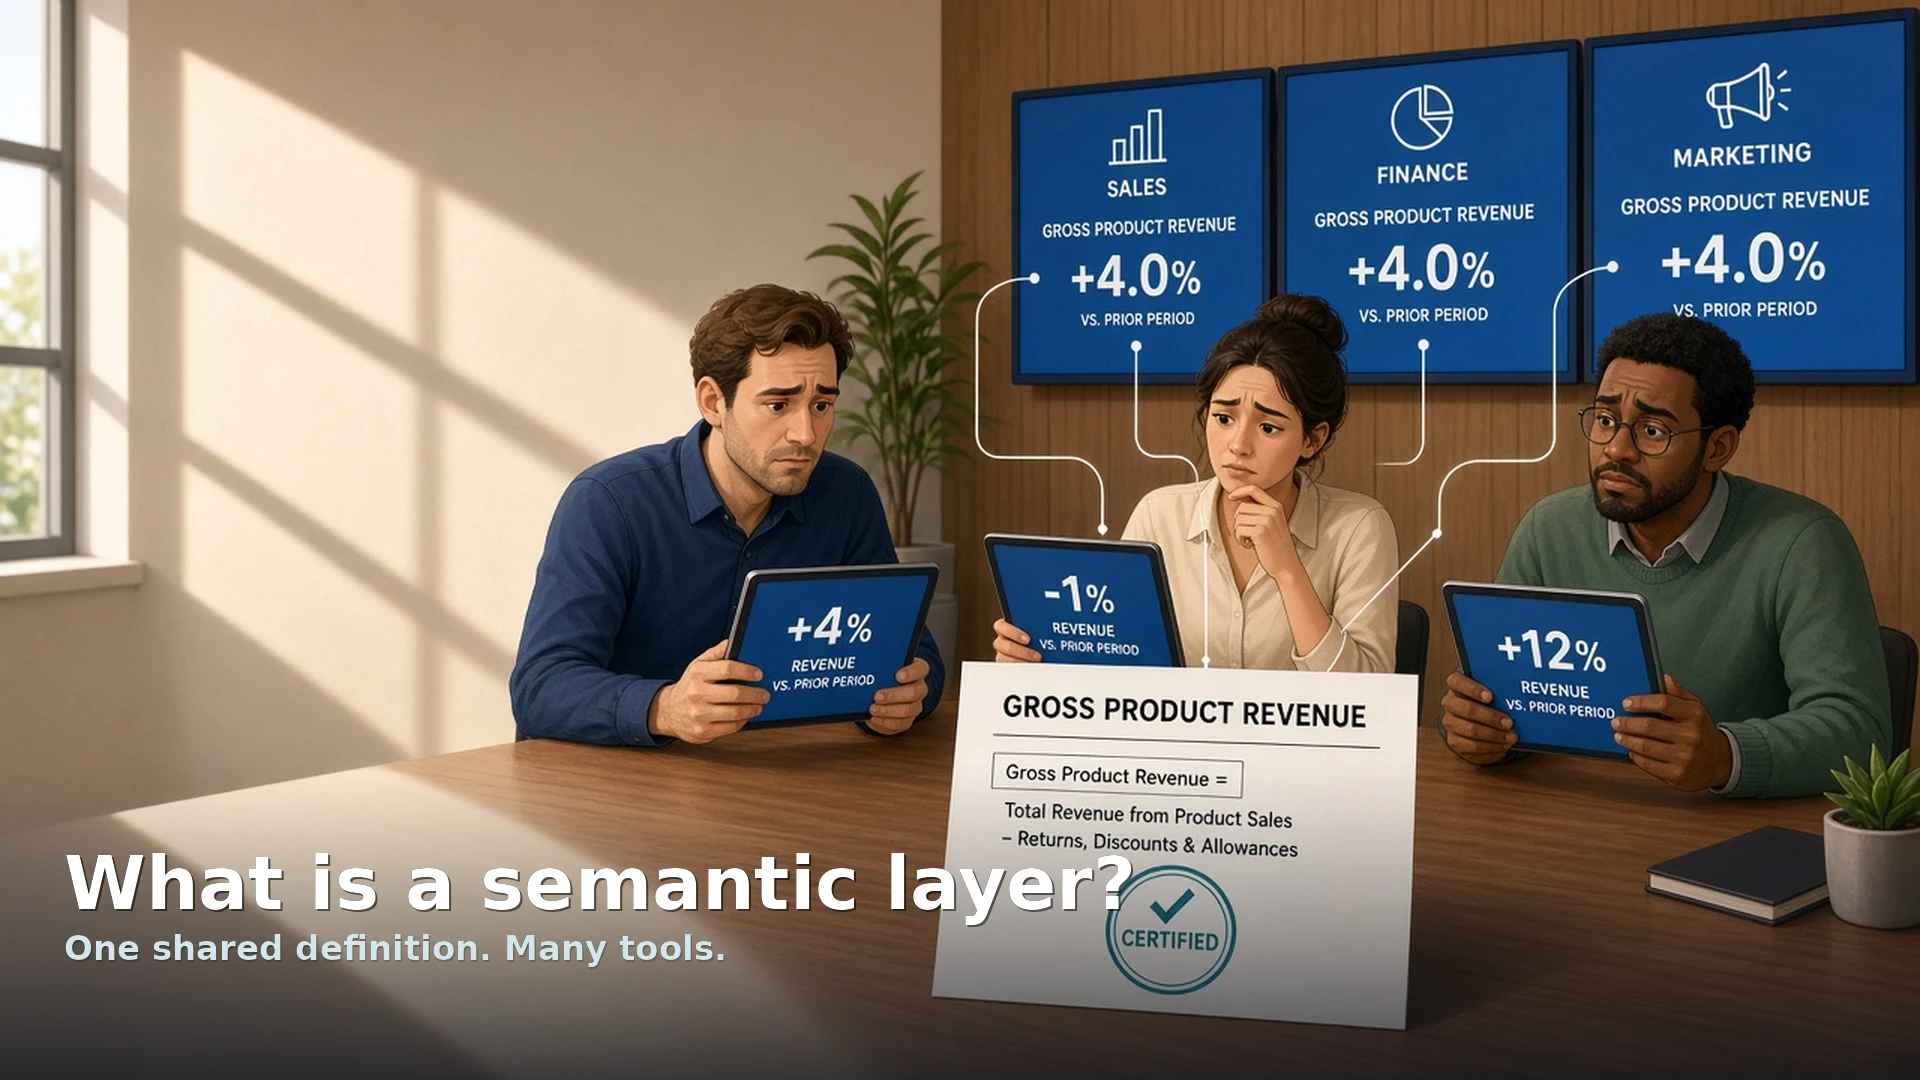
A semantic layer is one shared place where a company defines its business numbers, like revenue or active customers, so every report uses the same definition. Without one, each team calculates its own version, and the numbers disagree.
Imagine you open the sales report and see revenue up 4 percent. Then you open the finance report and see it down 1 percent. Both charts look clean. Each one simply used a different definition of revenue. A semantic layer fixes that by defining revenue once, for everyone.
A semantic layer in plain words
A semantic layer is the one official record of business meaning that sits on top of your analytical data. It spells out what an order is, how revenue adds up, which categories you may group by, and which filters are allowed. Group by means you combine rows that share a category, such as all orders from one region. People then ask for “revenue by region last month” in one shared vocabulary. The layer works out the joins and the math, so two tools do not write two different pieces of SQL. SQL is the language for asking a database questions.
dbt Labs describes a semantic layer as a framework for a unified, business-friendly view of data, with metrics defined centrally so that every tool downstream shares the same logic. Some products, such as MetricFlow in the dbt ecosystem, write the SQL for you from those metric definitions. That replaces copying Excel logic into every workbook. Other ecosystems use LookML-style modeling, reporting tools without their own dashboards (business intelligence, or BI, offered as a service other tools call), or cube-style metric services. An API is a way for one program to ask another program for data or an action. The names change, but the contract stays the same: shared meaning, plus a way to generate or serve the query. A query is a question you send to a database.
Rule of thumb: If two dashboards can redefine revenue without a code review, you do not have a semantic layer. You have a suggestion box.
Where it sits in the stack
Think of it in layers, from the top down.
- Consumption: BI tools, reverse ETL, notebooks, internal apps, and embedded analytics. ETL means extract, transform, and load: pull data out, clean it, and store it. Reverse ETL runs that path backwards, pushing warehouse data into business apps.
- Semantic layer: metrics, dimensions, entities, access policies, and sometimes caching.
- Transformed data: warehouse models such as dbt marts, with clean facts and dimensions.
- Raw data: source-aligned tables, loaded straight from your apps into landing zones.
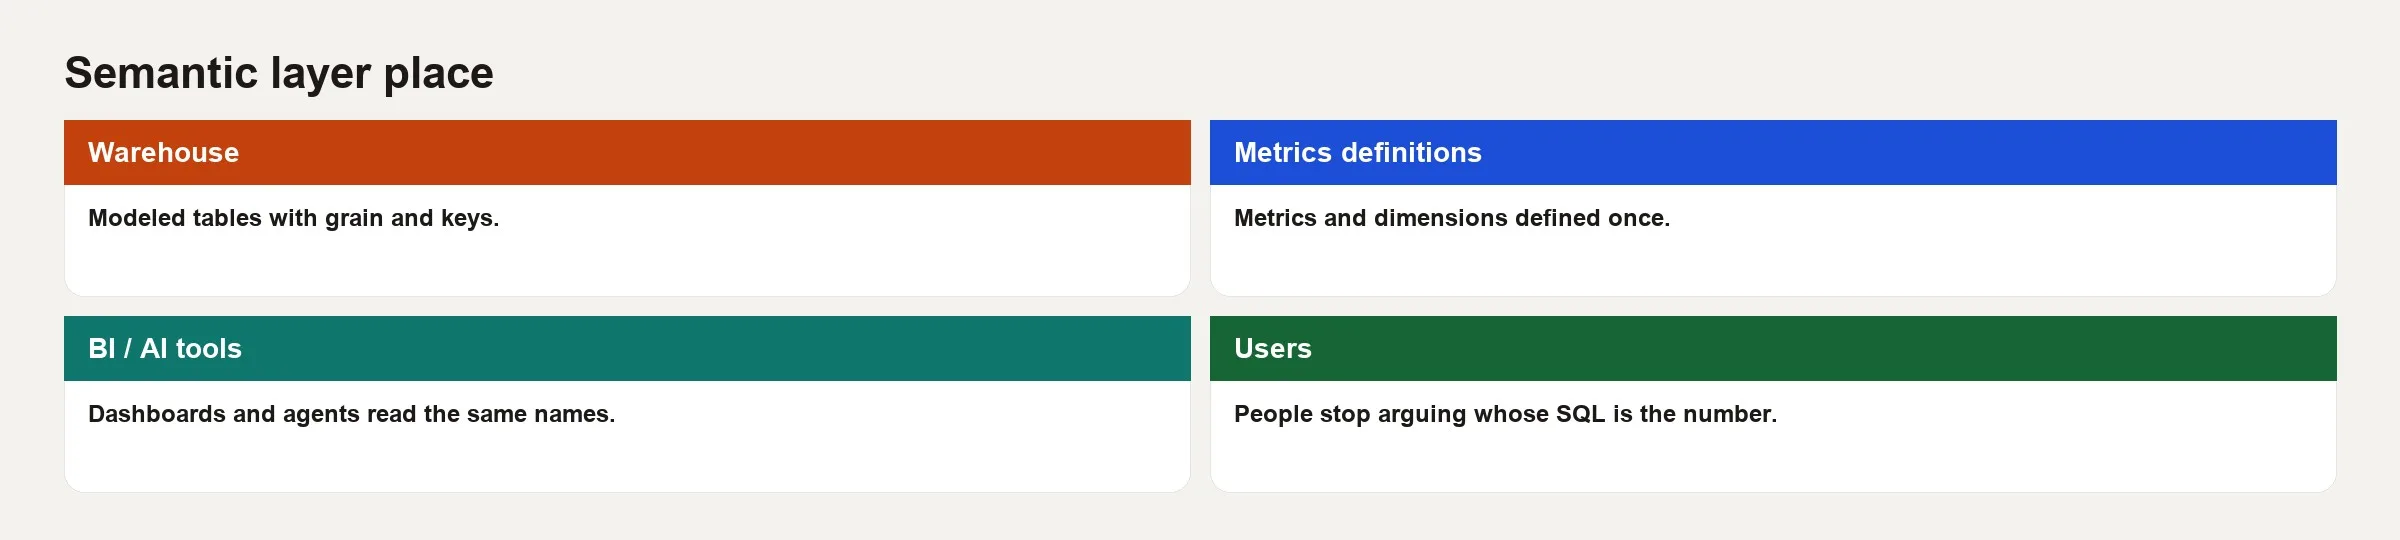
Suppose you only transform tables and leave every calculation in Tableau calculated fields. Then the meaning lives in the BI layer. That works until you add a second BI tool, or an AI agent that needs the same metric through an API. An agent is a program that can take actions across several steps. An API is a way for one program to ask another program for data or an action. Moving definitions “left” into a shared semantic layer is how teams grow self-serve analytics without growing chaos.
Building blocks without the fog
| Concept | Plain English | Example |
|---|---|---|
| Entity | Business object you care about | Customer, Order, Account |
| Dimension | Attribute you slice by | Region, Plan tier, Order date |
| Measure / fact column | Numeric raw input to aggregations | line_amount, quantity |
| Metric | Named calculation with rules | Gross revenue = sum of line amounts excluding tax, on ship date |
| Grain | What one row means under the metric’s inputs | Order line vs order header (see grain Key Term) |
A metric without a grain is only a slogan. Dimensions without relationship rules create fan-out, which means rows multiply after a join and totals inflate. A serious semantic layer forces you to declare both. That is why this topic belongs next to grain and data quality, and not only next to “BI tooling.”
What a semantic layer is not
It is not the warehouse itself
The warehouse stores tables and runs SQL. It does not automatically know that Marketing’s “revenue” excludes internal test orders. You can build a semantic layer out of warehouse views and strict naming, but storage alone does not carry meaning.
It is not only a BI tool’s data model
Looker, Power BI, Tableau, and their peers all have modeling layers. Those can be excellent semantic layers for that one tool. The pitch for a headless or centralized semantic layer is portability, meaning the same metric shows up in BI, a spreadsheet add-in, and an application API. If you will only ever use one BI tool, a strong in-tool model may be enough. Be honest with yourself about that scope.
It is not a feature store
Feature stores serve inputs to machine learning (ML) models, both for training and for fast predictions. Semantic layers serve business metrics and analysis by category. The two overlap in places, since monthly recurring revenue (MRR) might appear in both. Even so, the speed requirements, the point-in-time joins used for training, and the online stores are different problems. Do not buy one platform and assume it solved the other job.
It is not a catalog alone
Data catalogs document tables and their owners, while semantic layers define metrics that can be calculated. You want both. A catalog without runnable metric logic still allows five different revenues. A semantic layer that nobody can discover turns into a secret YAML club. YAML is a plain text format for settings, written as indented labels.
Worked example: one revenue metric
Before the fix, three tools use three different logics.
| Team | Hidden logic | Resulting drama |
|---|---|---|
| Sales BI | Sum of opportunity amount, closed-won, created month | Booking-ish, not recognized revenue |
| Finance export | GL revenue, recognition rules, fiscal calendar | “Official,” slow, not in product dashboards |
| Product analytics | Sum of order_line.amount, order_date, excludes refunds incompletely | Looks like revenue, breaks on partial refunds |
A simplified semantic approach has six steps.
- Agree on the business name, which here is Gross product revenue (ship date).
- Declare the grain of the inputs: one row per order line in
fct_order_lines. - Define the measure:
line_amount_ex_tax. - Define the metric as the sum of that measure where
is_test_order = false, with ship date as the time dimension. - List the legal dimensions, such as region, product family, and channel, each with tested many-to-one paths.
- Expose the metric through the semantic API or a governed BI model, and retire the freestyle copies.
Here is an illustrative metric config. It is not tied to any one vendor’s exact YAML.
# Conceptual metric definition (illustrative)
metric:
  name: gross_product_revenue
  description: >
    Sum of order line amounts excluding tax, on ship date,
    excluding internal test orders. Not GAAP recognition.
  type: sum
  measure: line_amount_ex_tax
  filter: "is_test_order = false"
  time_dimension: ship_date
  grain_note: "Built from fct_order_lines (one row per order line)"
  owner: finance_analytics
  consumers:
    - bi
    - reverse_etl_targets
    - internal_api
People still choose their own charts, but they should not choose a private definition of revenue. When AI assistants answer metric questions, point them at this layer or at certified documentation and not at random wiki neighbors. Embeddings (a search technique that matches by meaning) can find the page, but the semantic layer is what actually runs the number.
Why companies invest, and why projects stall
Real benefits
- Consistent numbers across tools.
- Faster self-serve analysis once trust exists.
- Clearer ownership and change control on metric logic.
- Better inputs for embedded analytics and for AI that must not invent formulas.
- Less duplicate SQL to review in pull requests.
Why rollouts stall
- No business owner will sign off on the revenue definition.
- The underlying marts have mixed grain and broken uniqueness.
- The team tries to model 400 metrics in month one.
- BI power users refuse to give up their personal calculated fields.
- The platform was bought before the basics of data modeling existed.
Success looks like ten certified metrics that people actually use, and not a graveyard of YAML files. Start with the metrics that cause executive arguments.
Lightweight versions that still count
Not every team needs a full commercial semantic platform on day one. There are a few credible stepping stones.
- dbt marts with tests, descriptions, and a written metric card for each KPI. A KPI is one of the few numbers a team agrees to watch.
- A single governed BI semantic model with locked, certified datasets.
- A metrics table or wide mart that pre-aggregates only with explicit grain documentation. It is limited but honest.
- Headless metric APIs, once multiple consumers appear.
The anti-pattern is five unofficial stepping stones with no plan to retire any of them. Pick one path as your source of truth and move consumers to it on purpose.
How this ties to grain, quality, and AI
Grain: Semantic metrics turn into SQL that joins and adds things up. If the underlying facts have mixed grain, the layer will amplify the mess with prettier names, so fix what a row means first.
Quality: Tests on uniqueness, empty values, and reconciliation to Finance seed data belong with the same owners as the metrics. A green semantic query on bad facts is still bad.
AI: Retrieval-augmented generation (RAG), where an AI pulls in your documents before answering, can fetch a metric description. A semantic layer can compute the metric. Agents that only paraphrase wiki text will still invent numbers, so prefer tool calls into governed metrics for anything that looks like a KPI. For SQL assistants, certified definitions beat free-form generation, and you should still run human checks on AI-written SQL.
Common mistakes
- Modeling everything instead of the metrics that cause fights.
- No business owner on the metric, so engineering guesses the filters.
- Ignoring non-additive measures, such as ratios and distinct counts, so dashboards sum nonsense.
- Leaving escape hatches everywhere, which makes certified metrics optional theater.
- Skipping the time spine and fiscal calendar rules until the week of the board deck.
- Confusing catalog screenshots with executable definitions.
- Buying a semantic product to avoid hard conversations about refunds and test orders.
How to practice
- List the five metrics that caused last quarter’s arguments. For each one, write the formula, grain, time basis, owner, and known caveats on one page.
- Trace where each metric is currently calculated, whether that is a BI field, a dbt model, or a notebook (a document that mixes code, its results, and notes), and count the independent implementations.
- Pick one metric. Start with the one that causes the most arguments, because it gains the most from a single definition. Implement or document a single definition, point two consumers at it, and retire one duplicate.
- Read dbt’s semantic layer overview, or the equivalent for your stack, and map its terms to entity, dimension, and metric, so your team uses the same words as the tool.
- Add a reconciliation test that compares the semantic metric to the Finance seed for the last complete month, with a known tolerance and an on-call owner, so a drift from Finance’s number is caught before a meeting finds it.
Quick recap
- A semantic layer centralizes business meaning, in the form of metrics, dimensions, and entities on top of clean models.
- It is not the warehouse alone, not only a catalog, and not a feature store.
- Portable definitions matter when multiple tools and AI agents consume the same KPIs.
- Start with contested metrics, explicit grain, and named owners, and expand after trust builds.
- Tools help, but shared contracts and retiring duplicates are the real work.
When three dashboards disagree, do not start with color palettes. Start with the question “where is revenue defined, at what grain, and by whom?” That question is the semantic layer, whether or not you have bought one yet.
Your next step
List the three metrics that cause the most arguments in your company and write each definition once: what is counted, the grain, the filters, and an owner. Share the list with everyone who reports them. Agreeing on contested metrics first is how a semantic layer earns trust.
Series notes
Related to metrics and warehouse habits on Learn. Pair it with stewardship when definitions need owners.
Sources
Further reading and references used for this article:
- dbt Semantic Layer documentation: https://docs.getdbt.com/docs/use-dbt-semantic-layer/dbt-sl
- dbt Labs, “Semantic Layer: What it is and when to adopt it”: https://www.getdbt.com/blog/semantic-layer-introduction
- dbt Semantic Layer architecture: https://docs.getdbt.com/docs/use-dbt-semantic-layer/sl-architecture
- AMS: Metrics series, Data quality series, Data stewardship series, Learn
Keep going
Same lessons in your feed
Short diagrams, hooks, and weekly tutorials on Substack, Instagram, X, and Facebook.