Save four things with every analysis that matters: the exact inputs, the software versions, the code, and the settings and definitions you chose, so you can get the same numbers again months later. Here is why. Say three months ago you delivered a clear churn chart, which shows how many customers left, and leadership loved it. Today they ask why April looks different in the new deck. You open six notebooks named final, final2 and final_USE_THIS. One depends on a CSV (a plain spreadsheet-style text file) file that lived on a laptop that has since been wiped, and another read a warehouse table that has been rebuilt. You were not careless. You were working alone and moving fast, and nobody asked you for a way to re-run the work until the number became political.
This post is a stand-alone guide to reproducibility for solo analysts, which means being able to get back to the same numbers on purpose. It is not a lab science manifesto, and it does not ask you to build a whole platform team in a backpack. You get four practical layers, a minimum kit, and a worked example you can adopt in a single afternoon.
Reproducibility in solo language
Academic definitions talk about strangers recreating results down to the last bit. For a solo analyst, the reality is closer to this.
Working definition: You, months from now, or a colleague can re-create the same decision-relevant numbers from documented inputs and steps in a reasonable amount of time, and can explain any differences that were intentional.
You do not need to freeze the entire warehouse, but you should freeze the inputs behind any claim you publish. You do not need to package everything into a container (a sealed bundle of software), but you should pin the versions of Python and of each library (an add-on package of ready-made code) that can change results. You can still use notebooks, as long as your results do not depend on hidden cell order or on widgets that nobody replays.
This sits next to the quality and pipeline (the chain of steps that turns raw data into results) habits covered elsewhere on this site. Quality asks whether the number is trustworthy, and reproducibility asks whether we can get back to that number on purpose. See the data quality series and data pipelines series when you outgrow pure solo workflows.
Four layers that actually matter
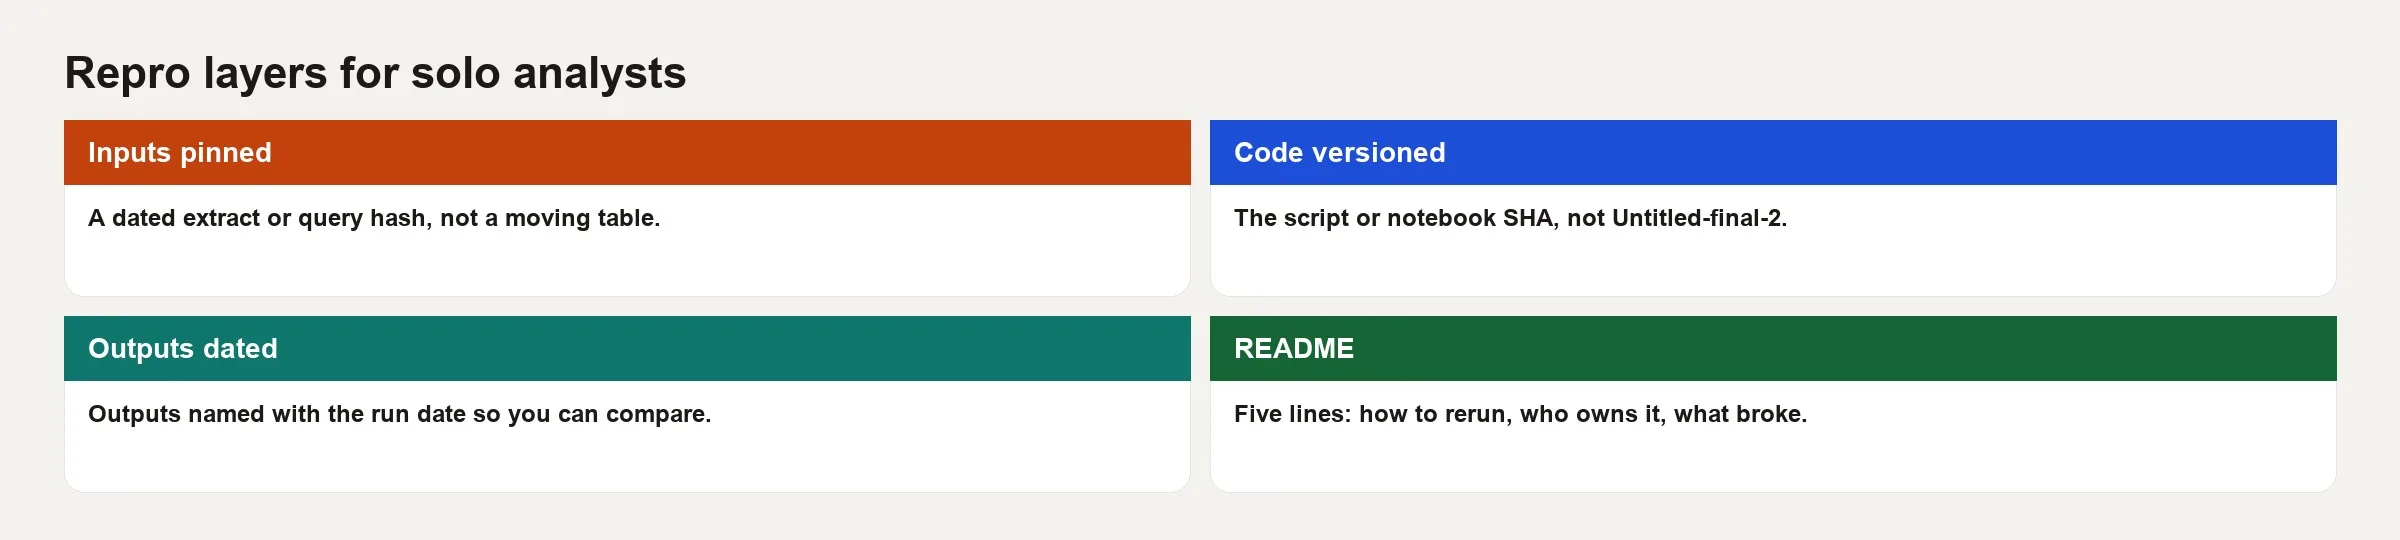
Layer 1: Data inputs
If the inputs change without warning, nothing else can save you. These options work well for one person.
- Export a dated extract, as a CSV or Parquet file (a compact file format for tables), for the exact analysis window.
- Save the SQL (the standard language for asking a database for data) that builds a snapshot table with a date at the end of its name, so you can rebuild or explain any past number later.
- Record the query time, the filters and the row counts in
inputs.md. - For large files, compute a hash (a short fingerprint of the file) so you can tell later that the file did not change.
Live warehouse queries are fine for exploring. A claim you publish needs inputs that are pinned down and written up.
Layer 2: Environment
Python analyses go stale when an upgrade to pandas, a popular Python data library, changes its default behavior. SQL is more stable, but it still depends on the version of the database engine and on session settings.
- Use a virtual environment for each project, or for each year if you need to keep things simple, which is an isolated set of installed packages.
- Pin exact versions in
requirements.txtorenvironment.yml. - Note which SQL dialect your warehouse uses and any session settings you changed from the default.
- Record your operating system only when it matters, such as for file paths, Excel drivers or language settings.
Layer 3: Code path
There should be one obvious way to re-run the work, because every hidden step is a debt you will pay later.
- Prefer a script, or a notebook (a document that mixes code and its results), that runs from top to bottom without manual clicks.
- Put dates and file paths at the top as named settings, so the next run changes one line instead of hunting through the code.
- Avoid file paths that only work on your own computer.
- Keep notes on any manual Excel fix that you truly cannot avoid, and try to remove it next time.
Layer 4: Narrative parameters
The memo is part of the analysis. Definitions, thresholds and exclusions must live next to the code and not only in a slide that someone later overwrote.
- A file named
definition.mdthat says what one row means and what is included or excluded. - Thresholds stored as named settings, such as
CHURN_GAP_DAYS = 28. - A short “how to re-run” section in the README, which is the plain text file that explains a project.
- An output folder with dated exports of the tables and charts you used in the deck.
The solo reproducibility kit
You do not need an enterprise metadata platform on day one. You need a boring folder and a few habits you never skip.
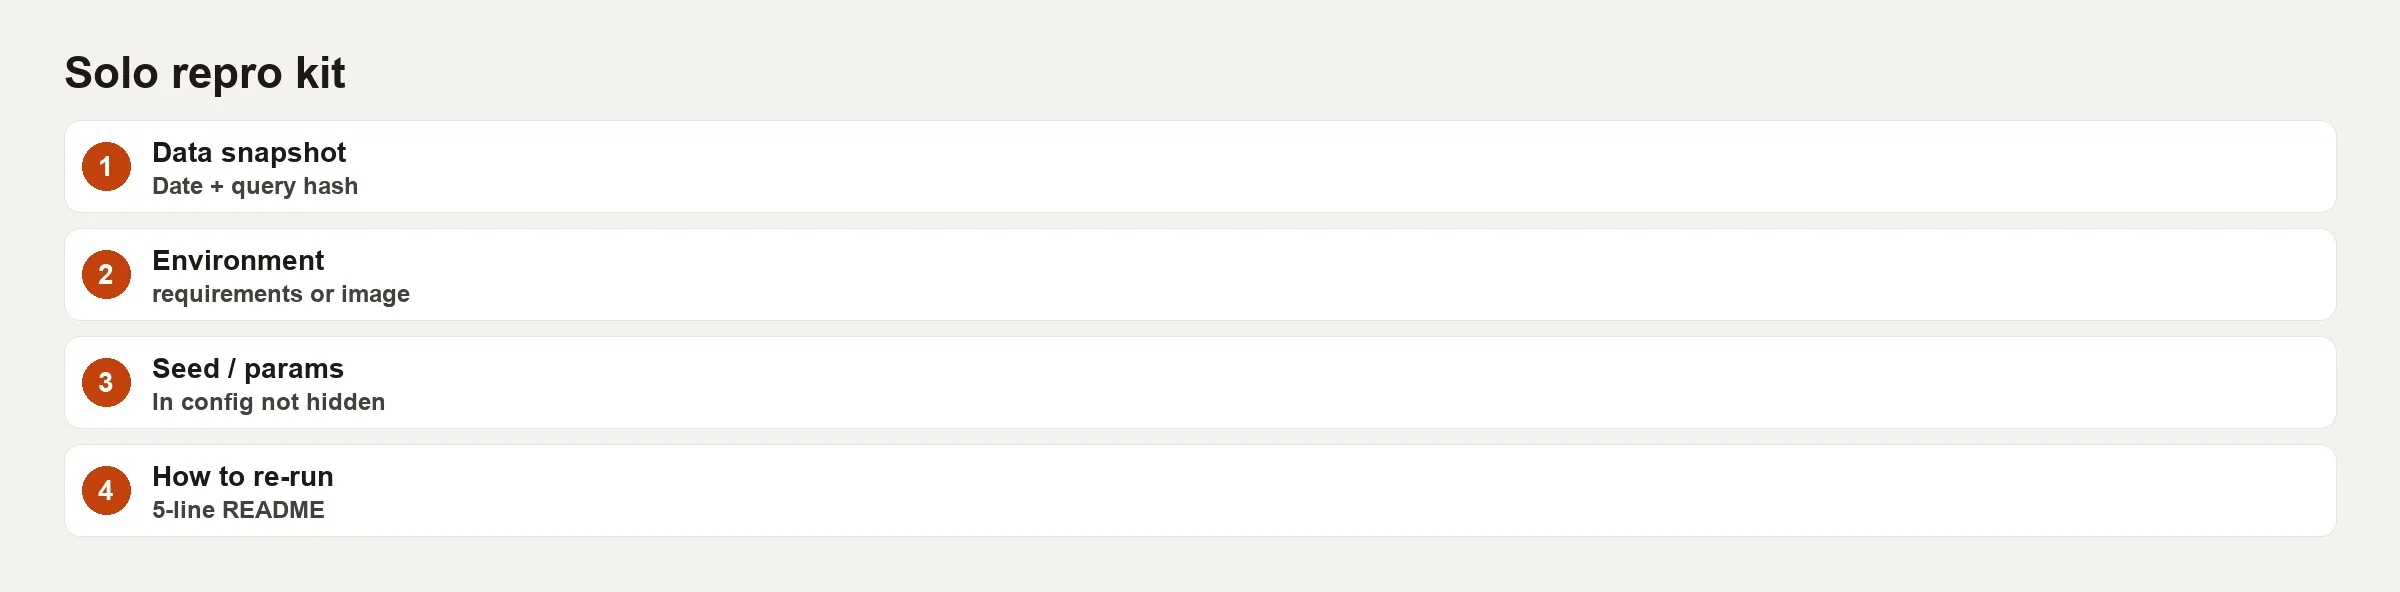
Here is a suggested layout for the folder.
project-churn-2026q1/
  README.md
  definition.md
  inputs.md
  requirements.txt
  params.yaml
  sql/
    01_snapshot_customers.sql
    02_churn_labeled.sql
  src/
    run_analysis.py
  data/
    raw/           # gitignored if sensitive
    snapshot/      # dated extracts you used
  outputs/
    2026-04-02/
      churn_by_segment.csv
      chart_churn.png
      memo.md
Add a tiny params.yaml file so the numbers that drive your results are not buried in the code:
as_of_date: "2026-03-31"
lookback_days: 90
churn_gap_days: 28
min_tenure_days: 14
segments:
  - smb
  - midmarket
  - enterprise
This small settings file holds the numbers that drive the analysis: the date it runs as of, how far back it looks, how many quiet days count as churn, the minimum time as a customer, and the segments. Keeping them in one file means a reviewer can see and change them without digging through the code.
Keep sensitive data out of public git repositories. The structure still works in a private repository (a project folder that keeps every version of its files) or on a shared drive with access controls. Habits around ownership and access matter here, and the data stewardship series covers how to keep roles clear when more people join later.
Notebooks without regret
Notebooks are excellent for thinking, but they are risky as the only record of what you did.
| Habit | Why it helps |
|---|---|
| Restart and run all before export | Catches hidden cell order bugs |
| Parameters in the first cell | No hunting for dates mid-file |
Write final tables to outputs/ | Decks do not depend on open kernels |
Promote stable logic to .py | Re-runs become one command |
| Never hand-edit a result cell as truth | Edits vanish from history |
If AI helped write your notebook code, verify it as carefully as you would verify SQL. The model will not remember your warehouse quirks next quarter, so you need the pinned versions and the checks. Read how to check AI-written SQL when queries are involved, and practice with the Python series when scripting becomes your main path.
Worked example: re-running Q1 churn
Say you are the only analyst at a 40-person software company. In April you published “Q1 churn by segment.” In July the CEO asks you to apply the same definition to Q2 and to explain a Q1 slide that the finance team disputes.
Without a kit, you are stuck. With a kit, you open project-churn-2026q1/README.md:
# Q1 churn by segment

## Claim
Monthly logo churn for customers with tenure >= 14 days,
using a 28-day inactivity gap after last paid activity.

## Re-run
python -m venv .venv && source .venv/bin/activate
pip install -r requirements.txt
python src/run_analysis.py --params params.yaml

## Inputs
See inputs.md. Snapshot tables:
- analytics.snap_customers_20260331
- analytics.snap_activity_20260331

## Outputs
outputs/2026-04-02/ used in the April 3 exec deck.
Here is the core labeling logic in SQL, simplified:
WITH base AS (
  SELECT
    c.customer_id,
    c.segment,
    c.first_paid_date,
    c.last_paid_activity_date
  FROM analytics.snap_customers_20260331 c
  WHERE c.first_paid_date <= DATE '2026-03-31' - INTERVAL '14 days'
),
labeled AS (
  SELECT
    customer_id,
    segment,
    CASE
      WHEN last_paid_activity_date
        < DATE '2026-03-31' - INTERVAL '28 days'
      THEN 1 ELSE 0
    END AS churned_flag
  FROM base
)
SELECT
  segment,
  COUNT(*) AS customers,
  SUM(churned_flag) AS churned,
  SUM(churned_flag) * 1.0 / COUNT(*) AS logo_churn_rate
FROM labeled
GROUP BY 1
ORDER BY 1;
Here is a sketch of a Python runner that keeps the settings out of long SQL strings:
from pathlib import Path
import yaml
import pandas as pd

PARAMS = yaml.safe_load(Path("params.yaml").read_text())
OUT = Path("outputs") / PARAMS["as_of_date"]
OUT.mkdir(parents=True, exist_ok=True)

# In real life: read from warehouse snapshot or local parquet
df = pd.read_parquet("data/snapshot/customers.parquet")

as_of = pd.Timestamp(PARAMS["as_of_date"])
min_start = as_of - pd.Timedelta(days=PARAMS["min_tenure_days"])
gap = pd.Timedelta(days=PARAMS["churn_gap_days"])

eligible = df[df["first_paid_date"] <= min_start].copy()
eligible["churned_flag"] = (
    eligible["last_paid_activity_date"] < (as_of - gap)
).astype(int)

summary = (
    eligible.groupby("segment", as_index=False)
    .agg(customers=("customer_id", "count"), churned=("churned_flag", "sum"))
)
summary["logo_churn_rate"] = summary["churned"] / summary["customers"]
summary.to_csv(OUT / "churn_by_segment.csv", index=False)
print(summary)
This Python runner reads the settings file, makes a dated output folder, loads the customer snapshot, and uses the settings to decide who is old enough to count and how long a gap means churn. Because every number comes from the settings file, rerunning last quarter’s analysis is a matter of changing one date.
When finance disputes Q1, you do not argue from memory. You re-run the work and compare it to outputs/2026-04-02/churn_by_segment.csv. Then you check whether finance used a different gap, such as 30 days, or included customers with less than 14 days of history. That is reproducibility paying for itself.
For Q2, you copy the project folder and update params.yaml and the snapshot names. You keep the definitions stable unless you log a deliberate change, which gives you the same method on a new time window and an honest comparison.
How much freeze is enough?
Not every exploratory chart needs a museum-quality archive. A simple set of tiers helps you decide how much to save.
| Tier | Examples | Minimum bar |
|---|---|---|
| Throwaway | Personal curiosity, dead ends | None; delete or park |
| Team share | Slack answers, working sessions | Query + filters + time run |
| Decision support | Roadmap, pricing, hiring plan | Full kit: inputs, params, outputs, definition |
| External / board | Board decks, public claims | Decision tier + explicit review + retention note |
If you are unsure, move up one tier. A folder costs very little compared with rebuilding a disputed number under time pressure.
Lightweight automation for one human
Working alone does not mean doing everything by hand forever. A little automation goes a long way.
- A shell alias or a Make target, so that typing
make churnruns the whole pipeline. - Scheduled snapshot SQL for metrics you know people will ask about again.
- Simple checks after each run, such as row counts and limits on rates.
- A changelog file that records when a definition changes.
Here is an example block of checks:
assert summary["logo_churn_rate"].between(0, 1).all()
assert summary["customers"].sum() > 0
assert set(summary["segment"]) <= set(PARAMS["segments"])
These checks will not catch every conceptual error, but they will catch the embarrassing ones, such as empty tables, rates above 100% and segment labels you did not expect.
Common mistakes
- Only saving the chart image: a picture cannot be re-run, and it does not record the method.
- Live queries as the record: tables keep changing underneath you.
- Unpinned packages: the same script can behave differently a month later because the defaults changed.
- Magic numbers buried in functions: thresholds that nobody can find later.
- Personal file paths: a path like
/Users/you/Desktop/...is not a process. - Notebook archaeology: 80 cells, 12 of them unused, and one critical filter hidden in the middle.
- No definition file: code without the business sentence still fails an executive review.
- Overbuilding: three weeks of platform work for a one-off chart. Match the tier to the stakes.
Practice: a 45-minute retrofit
Pick one analysis from the last quarter that might come back to you.
- Create the folder skeleton above.
- Write
definition.mdin ten lines or fewer. - Move or re-export the input you actually used; note row counts in
inputs.md. - Pin the packages you remember using, and if you cannot remember, pin what you use today and note the uncertainty.
- Export the tables and charts that appeared in the deck into
outputs/<date>/. - Add a README re-run section even if the first re-run is still partly manual.
An imperfect retrofit beats a perfect intention, and your next project can start clean. For broader skill building, browse Learn.
Quick recap
- Solo reproducibility means you can re-create the numbers behind a decision on purpose.
- The four layers are data inputs, environment, code path and the written assumptions behind the story.
- A boring project kit beats remembering everything yourself.
- Notebooks are fine when you restart and run all cells, keep settings at the top and export your outputs.
- Match your effort to the stakes, since board claims need more freezing than throwaway exploratory data analysis (EDA).
- Retrofit one old analysis this week so the next dispute is calmer.
Sources
- The Turing Way, Guide for Reproducible Research: https://the-turing-way.netlify.app/reproducible-research/reproducible-research.html.
- Sandve et al., Ten Simple Rules for Reproducible Computational Research (Public Library of Science (PLOS) Computational Biology): https://journals.plos.org/ploscompbiol/article?id=10.1371/journal.pcbi.1003285.
- Python Packaging User Guide, installing packages and environment practices: https://packaging.python.org/en/latest/guides/installing-using-pip-and-virtual-environments/.
- pandas documentation (input and output functions and version awareness for analyses): https://pandas.pydata.org/docs/.
- Software Carpentry, reproducible research lessons and good practices: https://software-carpentry.org/lessons/.
- Git documentation (versioning analysis code and configs): https://git-scm.com/doc.
Keep going
Same lessons in your feed
Short diagrams, hooks, and weekly tutorials on Substack, Instagram, X, and Facebook.