SQL is the language you use to ask a database precise questions, and it saves you from wrestling giant spreadsheets by hand. Most companies keep their real records in databases, and SQL lets you pull exactly the rows you need without downloading everything.
Say someone drops a 40,000-row export in a chat and asks, “Can you just filter this real quick?” You open it. The columns have three spellings of the same region, half the emails are blank, and the date column is text that only looks like dates until you sort it. Twenty minutes later you are still fighting the grid, and the meeting has moved on.
That is why SQL still matters. Spreadsheets are fine, but the real store of truth for most companies is a database, and SQL lets you ask it questions without loading the whole thing onto your laptop.
This is the introduction to the SQL series on Analytics Made Simple. We will treat SQL as a workplace tool, not a personality test. You will learn what a table is, why “relational” matters in plain English, how a tiny practice schema (the plan of which tables and columns a database has) works, and what each later part of the series teaches. If you already write queries every day, stay for the shared vocabulary. If you are new, start here and then move into the playground in our setup guide.
What you will learn
- What SQL is, and what it is not
- How tables, rows, and columns map to the spreadsheets you already know
- What “relational” means without a textbook hangover
- A toy
customersandordersschema we reuse for the whole series - When SQL beats a spreadsheet, and when it does not
- The roadmap for our subsequent tutorial guides
- How this series pairs with Python, data quality, and spreadsheet paths on this site
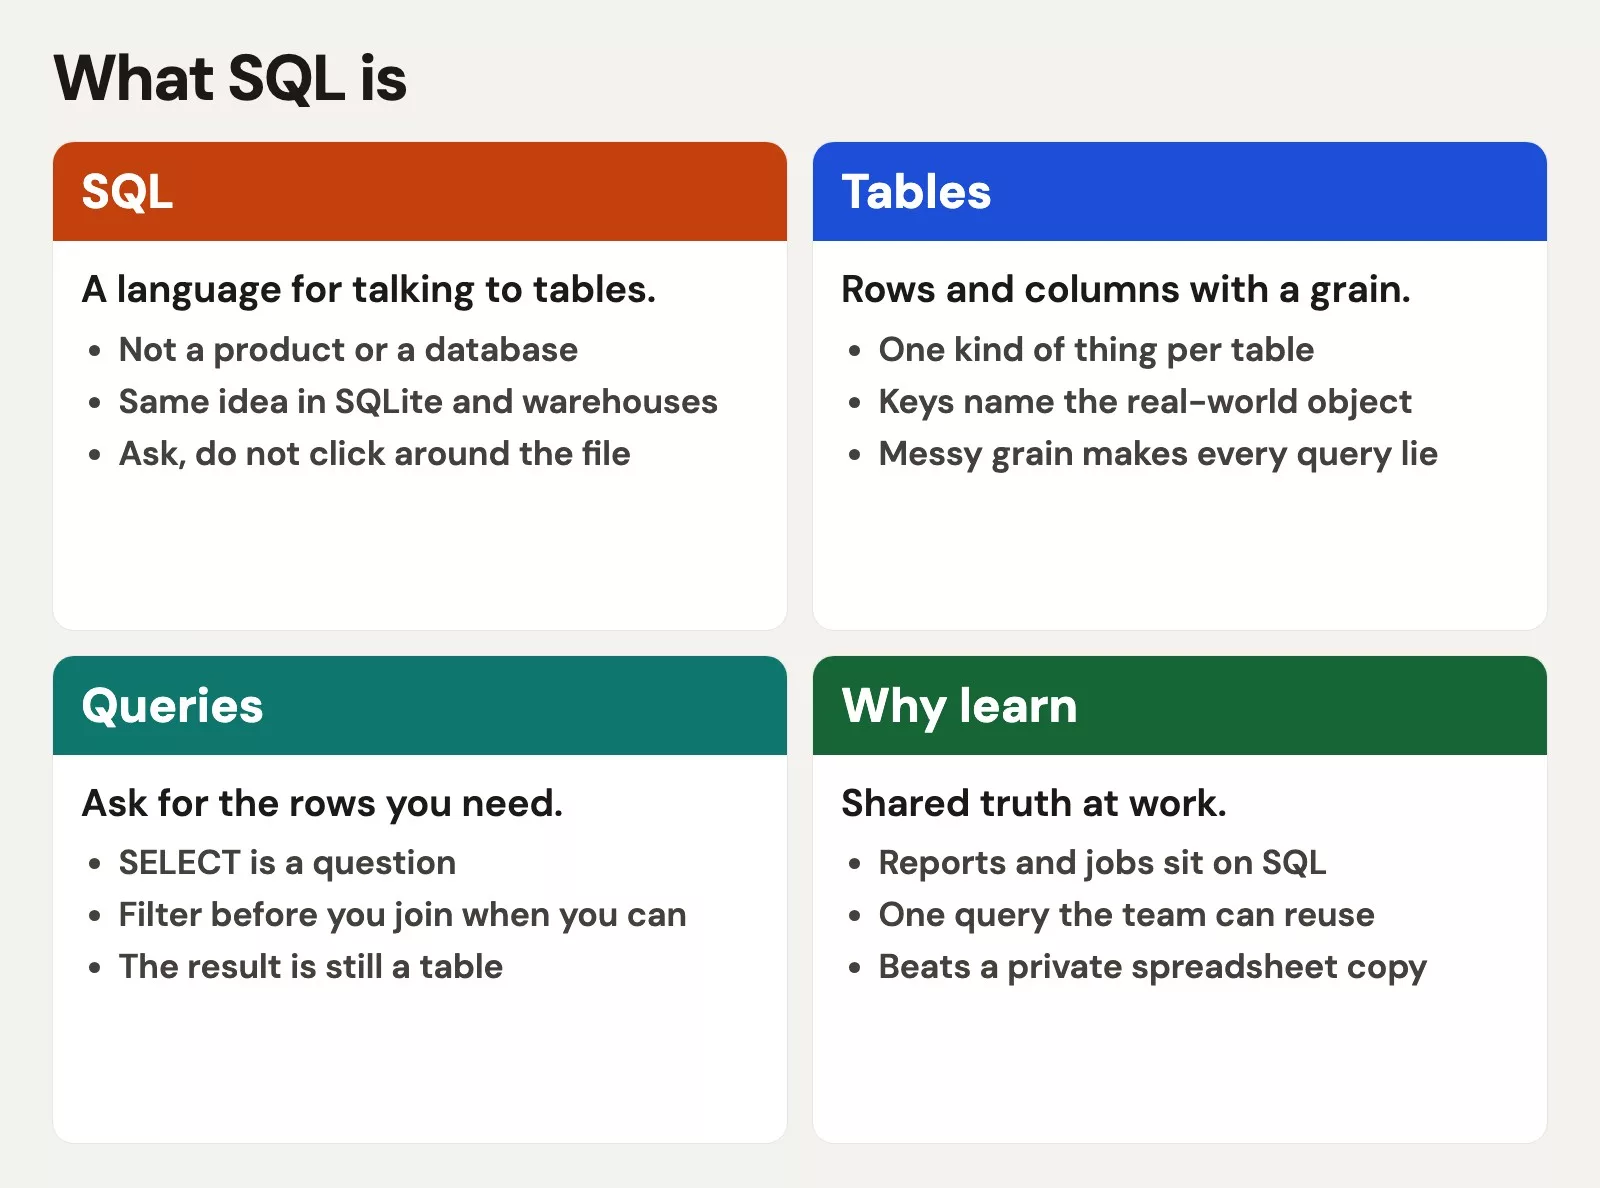
SQL in one plain sentence
SQL stands for Structured Query Language. In practice it is a standard way to talk to relational databases: ask for rows, filter them, join them, summarize them, and sometimes change them. You write a statement. The database engine plans how to fetch the answer. You get a result set back, usually as a table-shaped answer.
That is different from clicking through a product UI, and different from writing a general program that walks every cell by hand. SQL is declarative. You describe what you want. The engine decides how to get it. Good engines are very good at that “how,” which is why a carefully written query can finish in a second against millions of rows while a naive loop in a notebook takes lunch.
You will see “SQL” used as both the language and a stand-in for “the warehouse / the database.” People say “pull it in SQL” when they mean “query the production analytics tables.” In this series we will keep the language meaning clear, and we will name the product (SQLite, PostgreSQL, and so on) when the product matters.
Tables are spreadsheets with rules
If you can read a spreadsheet, you already know the visual shape of SQL data:
- A table is like a sheet with a fixed set of columns.
- A row (also called a record) is one complete item: one customer, one order, one event.
- A column (also called a field) is one attribute shared by every row: name, region, amount, status.
- A cell holds one value for one row and one column.
The difference from a free-form sheet is discipline. In a relational table, every row has the same columns. Types matter: numbers should not quietly become text, dates should not become poetry. Empty means something specific (often NULL, which we will treat carefully later). That discipline is why joins and aggregates can work at scale. It is also why “just paste another column anywhere” is not how databases stay healthy.
A useful habit early: always ask, “What does one row mean?” If one row is one order, do not treat the table as if one row were one customer. That single mental check prevents a huge class of wrong totals later.
Relational, without the fog
A relational database stores data in tables that can be linked by shared keys. “Relational” here is not a therapy term. It means the design expects you to connect related facts across tables instead of stuffing every possible column into one mega sheet.
Classic workplace pattern:
- Customer details live in a
customerstable (stable identity, contact, region). - Purchase events live in an
orderstable (dates, amounts, status, and a pointer back to the customer). - You join them when the question needs both: “Revenue by region last month.”
That split is not bureaucratic clutter. It avoids copying the customer’s email into every order row (and then fixing it in forty places when they change jobs). Keys make the link: a primary key uniquely identifies a row in its own table; a foreign key in another table points at that identity. You will practice this thoroughly in our joins guide. For now, just hold the idea: related tables, shared identifiers, questions that span both.
Our toy schema for the whole series
Throughout this series we reuse two small tables so examples stay comparable. The data is fake and tiny on purpose. Real warehouses are wider and messier. Your job is to learn the shapes of questions first, then bring the same shapes to production data with better names and stricter governance.
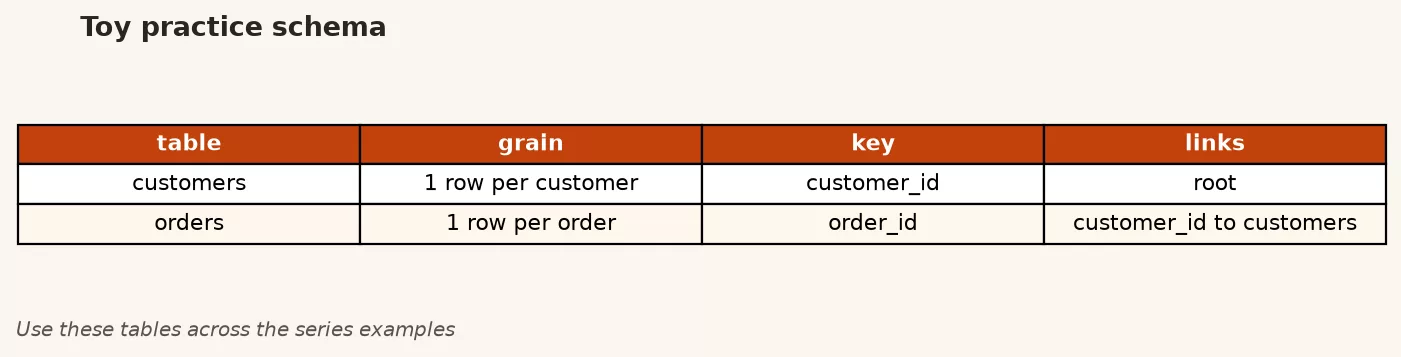
customers
One row is one customer.
| Column | Meaning |
|---|---|
customer_id | Stable unique id for the customer |
name | Display name |
region | Sales region label (for example East, West) |
email | Contact email (may be missing in messy data) |
orders
One row is one order.
| Column | Meaning |
|---|---|
order_id | Stable unique id for the order |
customer_id | Who placed it (links to customers) |
order_date | When the order was placed |
amount | Order total in a single currency for the toy set |
status | Lifecycle label (for example paid, pending, cancelled) |
When you see a query in a later part that mentions region and amount together, you already know you will need both tables. When you only see status and amount, you might stay on orders alone. That “which table owns this fact?” instinct is half of practical SQL literacy.
What SQL is good for at work
SQL earns its keep when the data is shared, large, or both. Typical Monday questions:
- How many paid orders did we book last week by region?
- Which customers ordered more than once but never completed a paid status?
- What is average order value for East versus West, excluding cancelled rows?
- Pull a clean extract for a monthly report without hand-filtering a dump.
Those questions are filter, join, and aggregate problems. Spreadsheets can do them on small extracts. SQL does them closer to the source of truth, with access control, audit logs, and fewer “which file is final?” arguments. Analysts, operators, product managers, marketers who own funnels, and engineers who need sanity checks all end up speaking some SQL, even if their job title never says “database.”
SQL is also the language many business intelligence (BI) tools generate behind the scenes. If you can read that generated SQL, you can tell when a dashboard (a screen of charts that updates on its own) is counting the wrong grain or double-counting after a bad join. That skill is underrated and very employment-friendly.
What SQL is not
Clear boundaries save time:
- Not a full application language. You will not build a website with SQL alone. You will retrieve and shape data that other tools display.
- Not automatic truth. A correct query on wrong definitions still ships a wrong number. Definitions live with humans and data contracts, which is why our data quality series sits next to SQL, not under it.
- Not one identical dialect everywhere. Core
SELECT,WHERE,JOIN, and aggregates travel well. Date functions, string functions, and advanced window syntax vary between engines. Learn portable habits first; specialize when your workplace engine demands it. - Not a replacement for spreadsheets or Python. Sheets still win for tiny shared tables and live meeting edits. Python wins for messy file pipelines, custom logic, and charts in notebooks. SQL wins when the answer lives in a database and the question is set-based. Our Python series and spreadsheets to data series treat those as partners, not enemies.
Flavors and engines (keep it light for now)
You will meet several common engines:
| Engine | Typical home | Learning note |
|---|---|---|
| SQLite | Local files, apps, quick practice | Best first playground: zero server drama |
| PostgreSQL | Apps, analytics, open source stacks | Strong standards-friendly habits |
| MySQL / MariaDB | Web apps, many hosts | Huge installed base |
| SQL Server | Microsoft-heavy enterprises | T-SQL dialect details later |
| BigQuery / Snowflake / Redshift | Cloud warehouses | Same core ideas, cloud billing and scale |
Our setup guide helps you pick a practice playground. For this series we default to SQLite-shaped examples that most engines will understand with minor tweaks. When a feature is engine-specific, we will say so.
A first taste: asking for rows
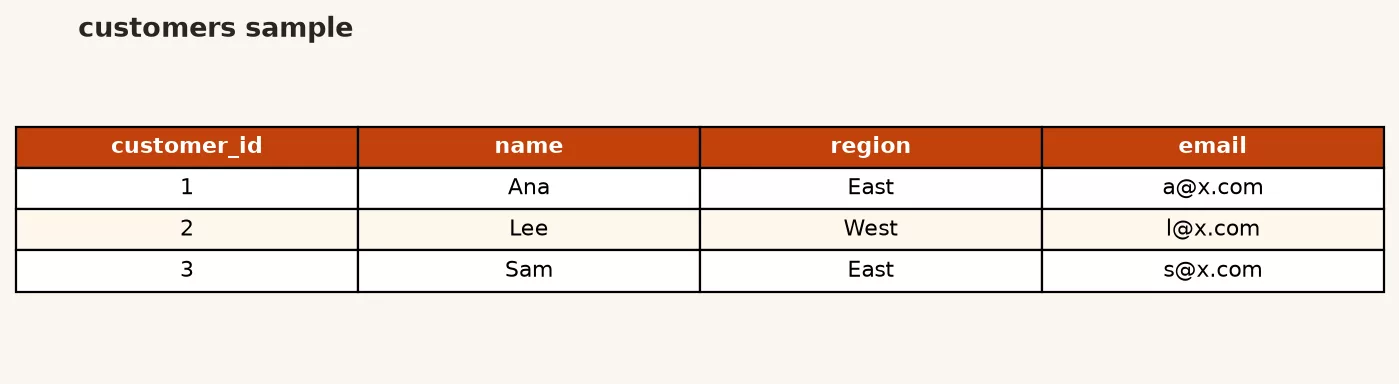
You do not need a full environment yet. Still, it helps to see the shape of a real statement. This query asks for every column from every customer row. In a tiny table that is fine. In a production table with hundreds of columns and millions of rows, you will learn to be much pickier in our SELECT tutorial.
Read it top to bottom: “Select all columns from the customers table.”
SELECT *
FROM customers;
What that returns on our toy data is a small grid of people and regions. Treat the image as the kind of result panel you will see in any SQL client.
Example output:
A slightly more intentional version names the columns and limits the rows so you do not flood your screen later:
SELECT
  customer_id,
  name,
  region
FROM customers
LIMIT 5;
You will build up from here: filters in our filtering guide, summaries in our aggregates guide, and multi-table questions in our joins guide. The grammar stays readable if you keep one question per query while you learn.
How people actually learn SQL (and how we will)
Many courses drown you in theory before you ever select a row. Many workplace “trainings” show a graphical user interface (GUI) and never explain the query behind the chart. We take a middle path:
- Start with a playground you control (our setup guide).
- Learn the four core verbs for reading and changing data (our core commands guide), with safety habits on write operations.
- Get excellent at reading: columns, distinct values, and query limits (our
SELECTtutorial). - Filter and sort like you mean it (our filtering guide).
- Summarize with aggregates and groups (our aggregates guide).
- Join tables without exploding row counts by accident (our joins tutorial).
- Then go deeper: subqueries, safer modifications, views and indexes, advanced patterns, database objects, optimization, and maintenance (our advanced and operations tutorials).
Each part should leave you able to answer a workplace-shaped question on the toy schema. When you move to company data, the hard parts become permissions, definitions, and quality, not the keyword list.
Complete SQL series curriculum
| Part | Focus | You leave able to… |
|---|---|---|
| 1 | Playground setup | Run SQLite (or similar) and issue a first query |
| 2 | Core commands | Use SELECT, INSERT, UPDATE, and DELETE with safety |
| 3 | SELECT query craft | Pick columns, aliases, DISTINCT, and LIMIT |
| 4 | Filter and sort | WHERE, AND/OR, IN, BETWEEN, LIKE, ORDER BY, and NULL basics |
| 5 | Aggregates | COUNT, SUM, AVG, MIN, MAX, GROUP BY, and HAVING |
| 6 | Joins | INNER and LEFT joins, keys, and row-count caution |
| 7 | Subqueries | Nest questions when a single flat query is awkward |
| 8 | Modifying data | Write changes with checks and rollback thinking |
| 9 | Views and indexes | Reuse logic and understand speed basics |
| 10 | Advanced techniques | Common table expressions (CTEs), window functions, and multi-step SQL |
| 11 | Procedures and friends | Know when DB-side logic helps or hurts |
| 12 | Best practices | Write clearer, safer, more efficient queries |
| 13 | Maintenance | Think about upkeep, permissions, and long-term health |
You can skim ahead, but the early parts stack. Skipping filters before joins is how people invent “SQL is hard” stories that are really “I joined everything to everything.”
Worked example: translate a business question
Imagine a weekly ops review. The lead asks: “How many customers do we have in the East region?”
Before typing SQL, restate the grain. You are counting customers, not orders. The filter lives on customers.region. A first draft:
SELECT
  COUNT(*) AS east_customers
FROM customers
WHERE region = 'East';
That is already a real analysis pattern: aggregate plus filter. If the lead then asks for East revenue, you will need orders and a join (our joins guide), plus a decision about which statuses count as revenue (our filtering and aggregates guides). Notice how the business definition (“what counts as revenue?”) matters as much as the syntax. SQL will happily sum the wrong rows with perfect grammar.
Second translation: “List customer names and emails for a outreach list in the West.”
SELECT
  name,
  email
FROM customers
WHERE region = 'West'
ORDER BY name;
You will later add “email is not null,” distinct emails if duplicates exist, and maybe a join to recent orders so you only contact active buyers. Each of those is a later part. The skill you practice now is mapping English to tables and columns without panicking.
A day-in-the-life sketch
Here is how SQL shows up on an ordinary analytics Tuesday, without the conference-talk gloss.
Morning: a Slack ping asks for “yesterday’s paid orders by region.” You do not download the warehouse. You write a filtered, grouped query against orders joined to customers (skills from our filtering and joins guides). You check that cancelled rows are out. You paste a small result, not a 50-column dump.
Midday: marketing wants a list of West-region customers with emails for a campaign draft. That is a column list, a region filter, and a NULL check on email (our querying and filtering guides). You limit the preview, then remove the limit once the logic is trusted.
Afternoon: finance disputes a dashboard total. You open the SQL behind the chart, restate the grain, and find a join that duplicated order lines. The fix is not “SQL is wrong.” The fix is the join definition and a reconcile query. That is why this series spends so much time on grain and safety, not only on keywords.
None of that requires you to become a database administrator. It requires you to ask clear questions of structured tables and to notice when the answer shape does not match the business sentence.
Common mistakes beginners make (and we will unteach)
- Treating every export as truth. Exports freeze a moment. Databases keep updating. Prefer querying the live source when policy allows.
- Counting the wrong grain. Counting order rows when someone asked for customers is a classic. Join carefully; aggregate carefully.
SELECT *forever. Fine for exploration on small tables. Painful for production extracts and unclear reports.UPDATEorDELETEwithoutWHERE. We will be very loud about this in our core commands guide. Practice on copies. Preview withSELECTfirst.- Assuming
NULLbehaves like an empty string. It does not. Our filtering guide covers the basics; quality work covers the rest. - Joining before filtering in your head. Mentally reduce each table to the rows you care about, then combine. Your future self will thank you.
- Learning only a GUI. Visual graphical user interfaces help, but reading the SQL they produce helps even more.
How to practice this week
- Pick three questions from your own work that currently end in “export then filter in Sheets.” Write each as: tables involved, grain of one row, columns needed, filters, and whether you need a total or a list.
- Sketch the toy schema on paper and invent five rows of customers and eight rows of orders that feel realistic for a tiny shop.
- Browse the series hub at SQL series and bookmark our setup guide.
- If your data life is still mostly grids, pair this path with From spreadsheets to real data.
- When your questions outgrow pure SQL into file cleaning and notebooks, peek at Python for analytics.
- For more learning paths on the site, start at Learn.
Quick recap
- SQL is the standard language for asking relational databases precise questions.
- Tables are disciplined grids: fixed columns, row grain, and keys that link related facts.
- Our series practice set is
customersandorderslinked bycustomer_id. - SQL shines on shared, large, set-based questions; Sheets and Python still have honest jobs.
- Our comprehensive curriculum moves from playground setup through joins, advanced patterns, and maintenance.
- Business definitions and data quality sit beside syntax. Correct SQL on the wrong definition still fails the meeting.
Next up: set up a playground, create practice tables, and run your first real statement without waiting for IT to provision a warehouse. That is the focus of our next tutorial.
Sources
Background and further reading used for this introduction:
- SQLite: SQL Language Reference (compact, readable core SQL reference for practice)
- PostgreSQL: The SQL Language tutorial (strong intro path for a full server engine)
- Wikipedia: SQL (history and overview; use alongside primary docs)
- Analytics Made Simple: SQL series (full part list and hub)
- Analytics Made Simple: Learn (site learning paths)
- Analytics Made Simple: Data quality series (definitions and trust next to syntax)
- Analytics Made Simple: Python series (when notebooks join the workflow)
- Analytics Made Simple: Spreadsheets to data (bridge from grids to structured work)
Keep going
Same lessons in your feed
Short diagrams, hooks, and weekly tutorials on Substack, Instagram, X, and Facebook.